Zip Codes with the Largest French Community in Iowa
RELATED REPORTS & OPTIONS
French
Iowa
Compare Zip Codes
Map of Zip Codes with the Largest French Community in Iowa
0
1,000
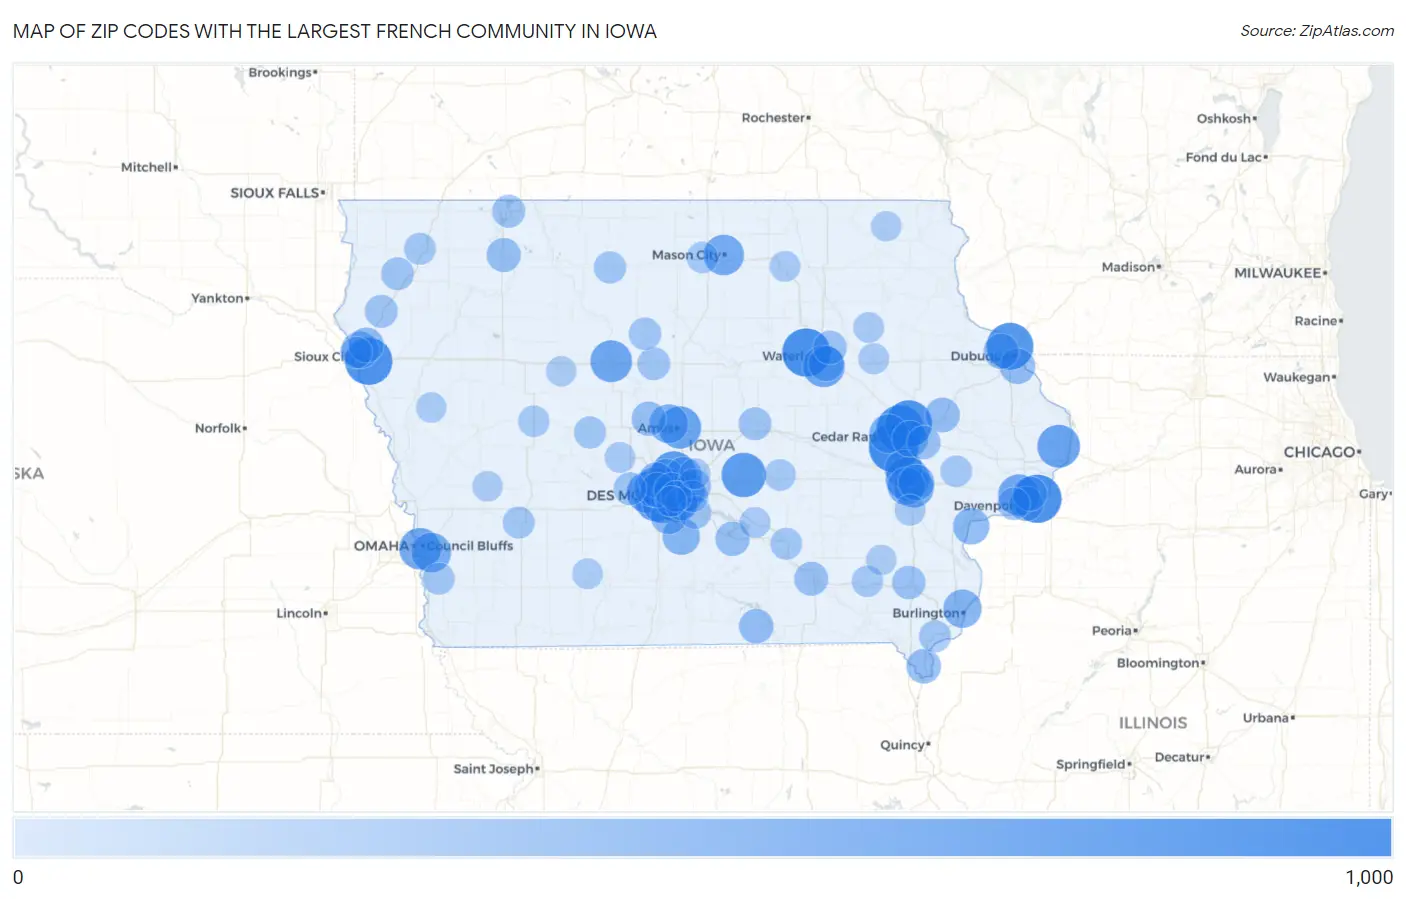
Zip Codes with the Largest French Community in Iowa
| Zip Code | French | vs State | vs National | |
| 1. | 52404 | 887 | 51,528(1.72%)#1 | 6,841,915(0.01%)#1,738 |
| 2. | 50613 | 830 | 51,528(1.61%)#2 | 6,841,915(0.01%)#2,007 |
| 3. | 52722 | 830 | 51,528(1.61%)#3 | 6,841,915(0.01%)#2,010 |
| 4. | 51106 | 797 | 51,528(1.55%)#4 | 6,841,915(0.01%)#2,183 |
| 5. | 52402 | 781 | 51,528(1.52%)#5 | 6,841,915(0.01%)#2,265 |
| 6. | 52001 | 777 | 51,528(1.51%)#6 | 6,841,915(0.01%)#2,293 |
| 7. | 52302 | 776 | 51,528(1.51%)#7 | 6,841,915(0.01%)#2,298 |
| 8. | 50023 | 696 | 51,528(1.35%)#8 | 6,841,915(0.01%)#2,762 |
| 9. | 50208 | 682 | 51,528(1.32%)#9 | 6,841,915(0.01%)#2,858 |
| 10. | 52241 | 646 | 51,528(1.25%)#10 | 6,841,915(0.01%)#3,088 |
| 11. | 50322 | 640 | 51,528(1.24%)#11 | 6,841,915(0.01%)#3,139 |
| 12. | 50266 | 623 | 51,528(1.21%)#12 | 6,841,915(0.01%)#3,274 |
| 13. | 52732 | 613 | 51,528(1.19%)#13 | 6,841,915(0.01%)#3,369 |
| 14. | 50010 | 592 | 51,528(1.15%)#14 | 6,841,915(0.01%)#3,547 |
| 15. | 50701 | 581 | 51,528(1.13%)#15 | 6,841,915(0.01%)#3,622 |
| 16. | 50501 | 573 | 51,528(1.11%)#16 | 6,841,915(0.01%)#3,686 |
| 17. | 50263 | 562 | 51,528(1.09%)#17 | 6,841,915(0.01%)#3,789 |
| 18. | 51501 | 561 | 51,528(1.09%)#18 | 6,841,915(0.01%)#3,796 |
| 19. | 50315 | 559 | 51,528(1.08%)#19 | 6,841,915(0.01%)#3,819 |
| 20. | 50265 | 559 | 51,528(1.08%)#20 | 6,841,915(0.01%)#3,820 |
| 21. | 52806 | 552 | 51,528(1.07%)#21 | 6,841,915(0.01%)#3,873 |
| 22. | 50401 | 523 | 51,528(1.01%)#22 | 6,841,915(0.01%)#4,157 |
| 23. | 52240 | 510 | 51,528(0.99%)#23 | 6,841,915(0.01%)#4,283 |
| 24. | 51503 | 492 | 51,528(0.95%)#24 | 6,841,915(0.01%)#4,498 |
| 25. | 50317 | 489 | 51,528(0.95%)#25 | 6,841,915(0.01%)#4,525 |
| 26. | 50323 | 470 | 51,528(0.91%)#26 | 6,841,915(0.01%)#4,757 |
| 27. | 52405 | 462 | 51,528(0.90%)#27 | 6,841,915(0.01%)#4,840 |
| 28. | 50014 | 459 | 51,528(0.89%)#28 | 6,841,915(0.01%)#4,871 |
| 29. | 52601 | 433 | 51,528(0.84%)#29 | 6,841,915(0.01%)#5,163 |
| 30. | 50312 | 428 | 51,528(0.83%)#30 | 6,841,915(0.01%)#5,240 |
| 31. | 52317 | 422 | 51,528(0.82%)#31 | 6,841,915(0.01%)#5,320 |
| 32. | 52246 | 406 | 51,528(0.79%)#32 | 6,841,915(0.01%)#5,508 |
| 33. | 50125 | 401 | 51,528(0.78%)#33 | 6,841,915(0.01%)#5,573 |
| 34. | 50131 | 393 | 51,528(0.76%)#34 | 6,841,915(0.01%)#5,679 |
| 35. | 51104 | 384 | 51,528(0.75%)#35 | 6,841,915(0.01%)#5,812 |
| 36. | 52761 | 362 | 51,528(0.70%)#36 | 6,841,915(0.01%)#6,123 |
| 37. | 50311 | 361 | 51,528(0.70%)#37 | 6,841,915(0.01%)#6,143 |
| 38. | 52403 | 351 | 51,528(0.68%)#38 | 6,841,915(0.01%)#6,289 |
| 39. | 52245 | 348 | 51,528(0.68%)#39 | 6,841,915(0.01%)#6,334 |
| 40. | 50021 | 346 | 51,528(0.67%)#40 | 6,841,915(0.01%)#6,366 |
| 41. | 50211 | 344 | 51,528(0.67%)#41 | 6,841,915(0.01%)#6,399 |
| 42. | 52003 | 328 | 51,528(0.64%)#42 | 6,841,915(0.00%)#6,649 |
| 43. | 52002 | 318 | 51,528(0.62%)#43 | 6,841,915(0.00%)#6,830 |
| 44. | 50111 | 318 | 51,528(0.62%)#44 | 6,841,915(0.00%)#6,832 |
| 45. | 50702 | 317 | 51,528(0.62%)#45 | 6,841,915(0.00%)#6,847 |
| 46. | 51108 | 305 | 51,528(0.59%)#46 | 6,841,915(0.00%)#7,028 |
| 47. | 50325 | 296 | 51,528(0.57%)#47 | 6,841,915(0.00%)#7,173 |
| 48. | 52205 | 295 | 51,528(0.57%)#48 | 6,841,915(0.00%)#7,195 |
| 49. | 50310 | 291 | 51,528(0.56%)#49 | 6,841,915(0.00%)#7,254 |
| 50. | 52803 | 289 | 51,528(0.56%)#50 | 6,841,915(0.00%)#7,294 |
| 51. | 52632 | 287 | 51,528(0.56%)#51 | 6,841,915(0.00%)#7,332 |
| 52. | 50009 | 285 | 51,528(0.55%)#52 | 6,841,915(0.00%)#7,368 |
| 53. | 52544 | 285 | 51,528(0.55%)#53 | 6,841,915(0.00%)#7,372 |
| 54. | 52807 | 282 | 51,528(0.55%)#54 | 6,841,915(0.00%)#7,420 |
| 55. | 50036 | 278 | 51,528(0.54%)#55 | 6,841,915(0.00%)#7,484 |
| 56. | 50138 | 278 | 51,528(0.54%)#56 | 6,841,915(0.00%)#7,487 |
| 57. | 51301 | 270 | 51,528(0.52%)#57 | 6,841,915(0.00%)#7,624 |
| 58. | 52501 | 262 | 51,528(0.51%)#58 | 6,841,915(0.00%)#7,761 |
| 59. | 50703 | 251 | 51,528(0.49%)#59 | 6,841,915(0.00%)#8,005 |
| 60. | 52314 | 245 | 51,528(0.48%)#60 | 6,841,915(0.00%)#8,142 |
| 61. | 52641 | 243 | 51,528(0.47%)#61 | 6,841,915(0.00%)#8,178 |
| 62. | 50320 | 229 | 51,528(0.44%)#62 | 6,841,915(0.00%)#8,475 |
| 63. | 51360 | 223 | 51,528(0.43%)#63 | 6,841,915(0.00%)#8,609 |
| 64. | 50158 | 221 | 51,528(0.43%)#64 | 6,841,915(0.00%)#8,640 |
| 65. | 51031 | 221 | 51,528(0.43%)#65 | 6,841,915(0.00%)#8,647 |
| 66. | 50003 | 221 | 51,528(0.43%)#66 | 6,841,915(0.00%)#8,654 |
| 67. | 51041 | 218 | 51,528(0.42%)#67 | 6,841,915(0.00%)#8,722 |
| 68. | 50047 | 215 | 51,528(0.42%)#68 | 6,841,915(0.00%)#8,776 |
| 69. | 50595 | 214 | 51,528(0.42%)#69 | 6,841,915(0.00%)#8,794 |
| 70. | 50533 | 207 | 51,528(0.40%)#70 | 6,841,915(0.00%)#8,968 |
| 71. | 52804 | 203 | 51,528(0.39%)#71 | 6,841,915(0.00%)#9,042 |
| 72. | 50511 | 196 | 51,528(0.38%)#72 | 6,841,915(0.00%)#9,215 |
| 73. | 50129 | 192 | 51,528(0.37%)#73 | 6,841,915(0.00%)#9,323 |
| 74. | 52627 | 188 | 51,528(0.36%)#74 | 6,841,915(0.00%)#9,423 |
| 75. | 51534 | 184 | 51,528(0.36%)#75 | 6,841,915(0.00%)#9,541 |
| 76. | 51201 | 182 | 51,528(0.35%)#76 | 6,841,915(0.00%)#9,609 |
| 77. | 50022 | 179 | 51,528(0.35%)#77 | 6,841,915(0.00%)#9,696 |
| 78. | 52577 | 178 | 51,528(0.35%)#78 | 6,841,915(0.00%)#9,713 |
| 79. | 50112 | 174 | 51,528(0.34%)#79 | 6,841,915(0.00%)#9,830 |
| 80. | 51103 | 172 | 51,528(0.33%)#80 | 6,841,915(0.00%)#9,878 |
| 81. | 50327 | 172 | 51,528(0.33%)#81 | 6,841,915(0.00%)#9,880 |
| 82. | 52772 | 172 | 51,528(0.33%)#82 | 6,841,915(0.00%)#9,887 |
| 83. | 50428 | 171 | 51,528(0.33%)#83 | 6,841,915(0.00%)#9,916 |
| 84. | 52556 | 164 | 51,528(0.32%)#84 | 6,841,915(0.00%)#10,126 |
| 85. | 51401 | 161 | 51,528(0.31%)#85 | 6,841,915(0.00%)#10,207 |
| 86. | 52327 | 149 | 51,528(0.29%)#86 | 6,841,915(0.00%)#10,612 |
| 87. | 50309 | 146 | 51,528(0.28%)#87 | 6,841,915(0.00%)#10,696 |
| 88. | 50644 | 145 | 51,528(0.28%)#88 | 6,841,915(0.00%)#10,727 |
| 89. | 50219 | 144 | 51,528(0.28%)#89 | 6,841,915(0.00%)#10,754 |
| 90. | 50035 | 141 | 51,528(0.27%)#90 | 6,841,915(0.00%)#10,902 |
| 91. | 50616 | 140 | 51,528(0.27%)#91 | 6,841,915(0.00%)#10,925 |
| 92. | 50220 | 140 | 51,528(0.27%)#92 | 6,841,915(0.00%)#10,926 |
| 93. | 50662 | 137 | 51,528(0.27%)#93 | 6,841,915(0.00%)#11,039 |
| 94. | 50321 | 136 | 51,528(0.26%)#94 | 6,841,915(0.00%)#11,072 |
| 95. | 50801 | 134 | 51,528(0.26%)#95 | 6,841,915(0.00%)#11,157 |
| 96. | 51537 | 128 | 51,528(0.25%)#96 | 6,841,915(0.00%)#11,374 |
| 97. | 52540 | 126 | 51,528(0.24%)#97 | 6,841,915(0.00%)#11,472 |
| 98. | 50579 | 125 | 51,528(0.24%)#98 | 6,841,915(0.00%)#11,507 |
| 99. | 51034 | 125 | 51,528(0.24%)#99 | 6,841,915(0.00%)#11,514 |
| 100. | 52101 | 124 | 51,528(0.24%)#100 | 6,841,915(0.00%)#11,525 |
Common Questions
What are the Top 10 Zip Codes with the Largest French Community in Iowa?
Top 10 Zip Codes with the Largest French Community in Iowa are:
What zip code has the Largest French Community in Iowa?
52404 has the Largest French Community in Iowa with 887.
What is the Total French Population in the State of Iowa?
Total French Population in Iowa is 51,528.
What is the Total French Population in the United States?
Total French Population in the United States is 6,841,915.