Zip Codes with the Lowest Percentage of Owner-Occupied Units in Iowa
RELATED REPORTS & OPTIONS
Lowest Owner-Occupied
Iowa
Compare Zip Codes
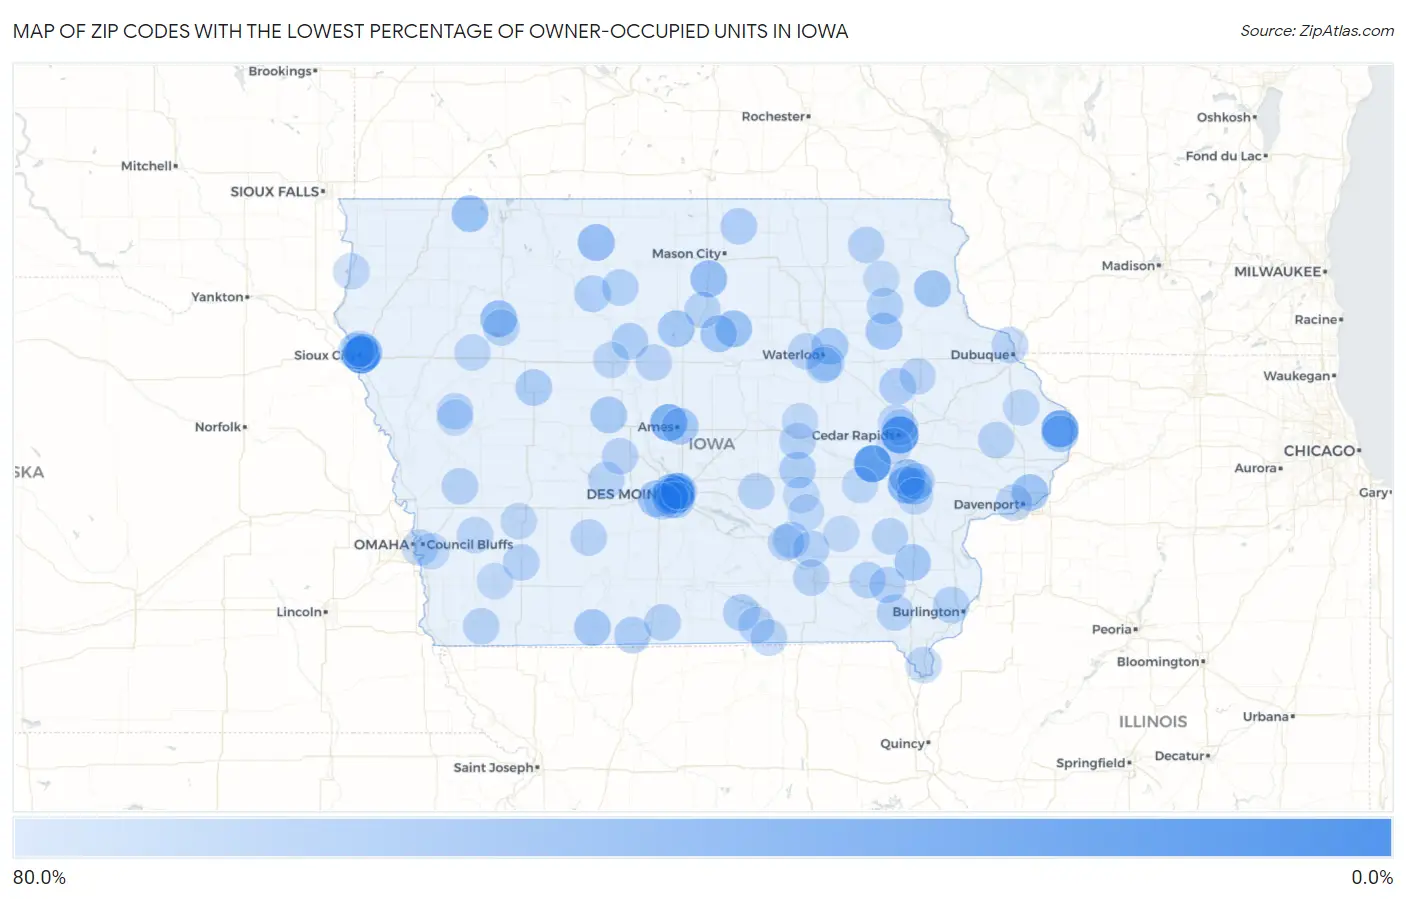
Map of Zip Codes with the Lowest Percentage of Owner-Occupied Units in Iowa
80.0%
0.0%
Zip Codes with the Lowest Percentage of Owner-Occupied Units in Iowa
| Zip Code | % Owner-Occupied | vs State | vs National | |
| 1. | 51101 | 10.6% | 71.5%(-60.9)#1 | 64.8%(-54.2)#186 |
| 2. | 50309 | 12.3% | 71.5%(-59.2)#2 | 64.8%(-52.5)#216 |
| 3. | 52307 | 16.7% | 71.5%(-54.9)#3 | 64.8%(-48.1)#300 |
| 4. | 52401 | 18.5% | 71.5%(-53.0)#4 | 64.8%(-46.3)#337 |
| 5. | 52771 | 27.0% | 71.5%(-44.5)#5 | 64.8%(-37.8)#618 |
| 6. | 50014 | 36.2% | 71.5%(-35.3)#6 | 64.8%(-28.6)#1,186 |
| 7. | 52246 | 40.9% | 71.5%(-30.6)#7 | 64.8%(-23.9)#1,593 |
| 8. | 50314 | 42.8% | 71.5%(-28.7)#8 | 64.8%(-22.0)#1,781 |
| 9. | 51105 | 43.7% | 71.5%(-27.8)#9 | 64.8%(-21.1)#1,874 |
| 10. | 50559 | 45.8% | 71.5%(-25.7)#10 | 64.8%(-19.0)#2,143 |
| 11. | 50477 | 46.6% | 71.5%(-24.9)#11 | 64.8%(-18.2)#2,261 |
| 12. | 50592 | 47.1% | 71.5%(-24.5)#12 | 64.8%(-17.8)#2,332 |
| 13. | 51345 | 48.0% | 71.5%(-23.5)#13 | 64.8%(-16.8)#2,470 |
| 14. | 50311 | 48.4% | 71.5%(-23.1)#14 | 64.8%(-16.4)#2,527 |
| 15. | 50633 | 49.1% | 71.5%(-22.4)#15 | 64.8%(-15.7)#2,662 |
| 16. | 52240 | 50.3% | 71.5%(-21.2)#16 | 64.8%(-14.5)#2,853 |
| 17. | 52807 | 50.5% | 71.5%(-21.0)#17 | 64.8%(-14.3)#2,886 |
| 18. | 50266 | 51.6% | 71.5%(-20.0)#18 | 64.8%(-13.3)#3,071 |
| 19. | 52072 | 52.4% | 71.5%(-19.1)#19 | 64.8%(-12.4)#3,229 |
| 20. | 50010 | 53.2% | 71.5%(-18.3)#20 | 64.8%(-11.6)#3,375 |
| 21. | 50041 | 53.4% | 71.5%(-18.1)#21 | 64.8%(-11.4)#3,421 |
| 22. | 52647 | 53.8% | 71.5%(-17.7)#22 | 64.8%(-11.0)#3,501 |
| 23. | 50101 | 53.8% | 71.5%(-17.7)#23 | 64.8%(-11.0)#3,503 |
| 24. | 52241 | 53.9% | 71.5%(-17.6)#24 | 64.8%(-10.9)#3,525 |
| 25. | 50835 | 55.6% | 71.5%(-16.0)#25 | 64.8%(-9.26)#3,906 |
| 26. | 50671 | 55.7% | 71.5%(-15.8)#26 | 64.8%(-9.15)#3,943 |
| 27. | 52701 | 56.5% | 71.5%(-15.0)#27 | 64.8%(-8.29)#4,154 |
| 28. | 50064 | 56.8% | 71.5%(-14.8)#28 | 64.8%(-8.06)#4,218 |
| 29. | 50703 | 56.9% | 71.5%(-14.6)#29 | 64.8%(-7.87)#4,263 |
| 30. | 51433 | 57.2% | 71.5%(-14.3)#30 | 64.8%(-7.61)#4,333 |
| 31. | 50157 | 57.7% | 71.5%(-13.8)#31 | 64.8%(-7.07)#4,468 |
| 32. | 50594 | 58.6% | 71.5%(-12.9)#32 | 64.8%(-6.22)#4,694 |
| 33. | 50140 | 59.0% | 71.5%(-12.5)#33 | 64.8%(-5.78)#4,830 |
| 34. | 50570 | 59.4% | 71.5%(-12.1)#34 | 64.8%(-5.40)#4,926 |
| 35. | 50315 | 59.5% | 71.5%(-12.1)#35 | 64.8%(-5.36)#4,943 |
| 36. | 50321 | 59.8% | 71.5%(-11.8)#36 | 64.8%(-5.05)#5,041 |
| 37. | 52581 | 60.0% | 71.5%(-11.5)#37 | 64.8%(-4.82)#5,106 |
| 38. | 52344 | 60.0% | 71.5%(-11.5)#38 | 64.8%(-4.82)#5,111 |
| 39. | 52595 | 60.1% | 71.5%(-11.4)#39 | 64.8%(-4.72)#5,136 |
| 40. | 50440 | 60.1% | 71.5%(-11.4)#40 | 64.8%(-4.69)#5,147 |
| 41. | 52655 | 60.7% | 71.5%(-10.9)#41 | 64.8%(-4.16)#5,307 |
| 42. | 50560 | 61.0% | 71.5%(-10.6)#42 | 64.8%(-3.85)#5,413 |
| 43. | 52142 | 61.2% | 71.5%(-10.3)#43 | 64.8%(-3.57)#5,509 |
| 44. | 52245 | 61.4% | 71.5%(-10.1)#44 | 64.8%(-3.39)#5,579 |
| 45. | 50702 | 61.5% | 71.5%(-10.1)#45 | 64.8%(-3.36)#5,590 |
| 46. | 50847 | 61.8% | 71.5%(-9.75)#46 | 64.8%(-3.05)#5,717 |
| 47. | 52556 | 62.0% | 71.5%(-9.56)#47 | 64.8%(-2.85)#5,780 |
| 48. | 51565 | 62.0% | 71.5%(-9.53)#48 | 64.8%(-2.83)#5,791 |
| 49. | 52561 | 62.3% | 71.5%(-9.21)#49 | 64.8%(-2.51)#5,905 |
| 50. | 51103 | 62.5% | 71.5%(-9.06)#50 | 64.8%(-2.35)#5,954 |
| 51. | 52630 | 62.5% | 71.5%(-9.02)#51 | 64.8%(-2.32)#5,970 |
| 52. | 52168 | 62.6% | 71.5%(-8.89)#52 | 64.8%(-2.18)#6,020 |
| 53. | 50144 | 62.7% | 71.5%(-8.79)#53 | 64.8%(-2.09)#6,062 |
| 54. | 50137 | 62.9% | 71.5%(-8.66)#54 | 64.8%(-1.96)#6,121 |
| 55. | 52001 | 62.9% | 71.5%(-8.66)#55 | 64.8%(-1.96)#6,125 |
| 56. | 50452 | 62.9% | 71.5%(-8.65)#56 | 64.8%(-1.94)#6,132 |
| 57. | 50588 | 63.0% | 71.5%(-8.51)#57 | 64.8%(-1.81)#6,187 |
| 58. | 50146 | 63.0% | 71.5%(-8.51)#58 | 64.8%(-1.81)#6,188 |
| 59. | 51460 | 63.2% | 71.5%(-8.36)#59 | 64.8%(-1.66)#6,259 |
| 60. | 52635 | 63.4% | 71.5%(-8.11)#60 | 64.8%(-1.41)#6,373 |
| 61. | 52254 | 63.4% | 71.5%(-8.10)#61 | 64.8%(-1.40)#6,379 |
| 62. | 51601 | 63.4% | 71.5%(-8.07)#62 | 64.8%(-1.37)#6,389 |
| 63. | 52501 | 63.5% | 71.5%(-8.05)#63 | 64.8%(-1.35)#6,402 |
| 64. | 52544 | 63.5% | 71.5%(-8.04)#64 | 64.8%(-1.33)#6,406 |
| 65. | 52353 | 63.6% | 71.5%(-7.94)#65 | 64.8%(-1.24)#6,449 |
| 66. | 50849 | 63.6% | 71.5%(-7.90)#66 | 64.8%(-1.20)#6,467 |
| 67. | 52339 | 63.9% | 71.5%(-7.64)#67 | 64.8%(-0.941)#6,561 |
| 68. | 52804 | 64.0% | 71.5%(-7.50)#68 | 64.8%(-0.798)#6,613 |
| 69. | 52577 | 64.1% | 71.5%(-7.37)#69 | 64.8%(-0.671)#6,665 |
| 70. | 52555 | 64.2% | 71.5%(-7.32)#70 | 64.8%(-0.619)#6,688 |
| 71. | 50595 | 64.5% | 71.5%(-7.02)#71 | 64.8%(-0.323)#6,818 |
| 72. | 50220 | 64.6% | 71.5%(-6.94)#72 | 64.8%(-0.240)#6,855 |
| 73. | 50613 | 64.7% | 71.5%(-6.81)#73 | 64.8%(-0.110)#6,919 |
| 74. | 52330 | 64.8% | 71.5%(-6.70)#74 | 64.8%(-0.002)#6,962 |
| 75. | 50312 | 65.0% | 71.5%(-6.52)#75 | 64.8%(+0.181)#7,050 |
| 76. | 51501 | 65.1% | 71.5%(-6.47)#76 | 64.8%(+0.235)#7,084 |
| 77. | 50701 | 65.1% | 71.5%(-6.40)#77 | 64.8%(+0.298)#7,111 |
| 78. | 52235 | 65.4% | 71.5%(-6.10)#78 | 64.8%(+0.597)#7,259 |
| 79. | 51104 | 65.6% | 71.5%(-5.93)#79 | 64.8%(+0.774)#7,359 |
| 80. | 50265 | 65.7% | 71.5%(-5.84)#80 | 64.8%(+0.864)#7,402 |
| 81. | 50316 | 65.9% | 71.5%(-5.64)#81 | 64.8%(+1.06)#7,493 |
| 82. | 52233 | 65.9% | 71.5%(-5.58)#82 | 64.8%(+1.12)#7,518 |
| 83. | 52361 | 66.1% | 71.5%(-5.42)#83 | 64.8%(+1.28)#7,595 |
| 84. | 50501 | 66.2% | 71.5%(-5.34)#84 | 64.8%(+1.37)#7,640 |
| 85. | 51020 | 66.5% | 71.5%(-5.00)#85 | 64.8%(+1.70)#7,761 |
| 86. | 52632 | 66.7% | 71.5%(-4.77)#86 | 64.8%(+1.93)#7,896 |
| 87. | 52030 | 66.9% | 71.5%(-4.64)#87 | 64.8%(+2.06)#7,958 |
| 88. | 52402 | 67.1% | 71.5%(-4.44)#88 | 64.8%(+2.26)#8,062 |
| 89. | 50022 | 67.2% | 71.5%(-4.34)#89 | 64.8%(+2.36)#8,121 |
| 90. | 51560 | 67.3% | 71.5%(-4.27)#90 | 64.8%(+2.44)#8,160 |
| 91. | 52342 | 67.4% | 71.5%(-4.09)#91 | 64.8%(+2.61)#8,245 |
| 92. | 51439 | 67.4% | 71.5%(-4.09)#92 | 64.8%(+2.61)#8,248 |
| 93. | 50171 | 67.4% | 71.5%(-4.09)#93 | 64.8%(+2.61)#8,251 |
| 94. | 52404 | 67.6% | 71.5%(-3.96)#94 | 64.8%(+2.74)#8,309 |
| 95. | 52175 | 67.6% | 71.5%(-3.96)#95 | 64.8%(+2.74)#8,313 |
| 96. | 51503 | 67.7% | 71.5%(-3.77)#96 | 64.8%(+2.93)#8,398 |
| 97. | 50027 | 67.8% | 71.5%(-3.76)#97 | 64.8%(+2.95)#8,410 |
| 98. | 51566 | 67.8% | 71.5%(-3.71)#98 | 64.8%(+2.99)#8,441 |
| 99. | 51023 | 67.9% | 71.5%(-3.57)#99 | 64.8%(+3.13)#8,515 |
| 100. | 52591 | 68.0% | 71.5%(-3.56)#100 | 64.8%(+3.14)#8,523 |
Common Questions
What are the Top 10 Zip Codes with the Lowest Percentage of Owner-Occupied Units in Iowa?
Top 10 Zip Codes with the Lowest Percentage of Owner-Occupied Units in Iowa are:
What zip code has the Lowest Percentage of Owner-Occupied Units in Iowa?
51101 has the Lowest Percentage of Owner-Occupied Units in Iowa with 10.6%.
What is the Percentage of Owner-Occupied Units in the State of Iowa?
Percentage of Owner-Occupied Units in Iowa is 71.5%.
What is the Percentage of Owner-Occupied Units in the United States?
Percentage of Owner-Occupied Units in the United States is 64.8%.