Zip Codes with the Highest Percentage of Population Employed in Accommodation & Food Services in Iowa
RELATED REPORTS & OPTIONS
Accommodation & Food Services
Iowa
Compare Zip Codes
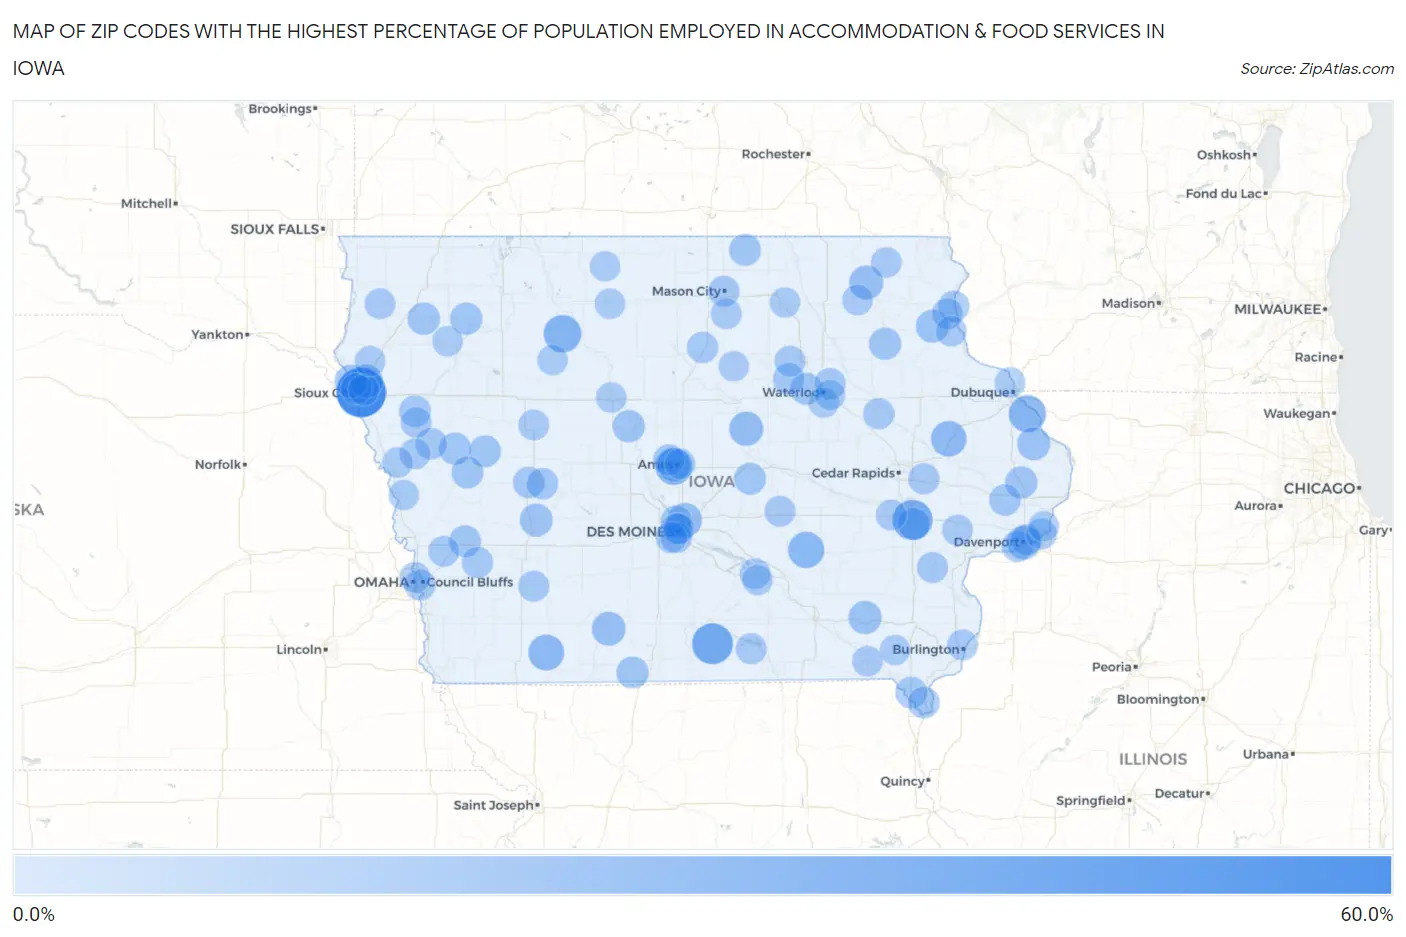
Map of Zip Codes with the Highest Percentage of Population Employed in Accommodation & Food Services in Iowa
0.0%
60.0%
Zip Codes with the Highest Percentage of Population Employed in Accommodation & Food Services in Iowa
| Zip Code | % Employed | vs State | vs National | |
| 1. | 51101 | 52.4% | 5.5%(+46.9)#1 | 6.9%(+45.5)#82 |
| 2. | 50165 | 31.8% | 5.5%(+26.3)#2 | 6.9%(+24.9)#284 |
| 3. | 52242 | 30.1% | 5.5%(+24.6)#3 | 6.9%(+23.2)#329 |
| 4. | 50573 | 24.1% | 5.5%(+18.6)#4 | 6.9%(+17.3)#551 |
| 5. | 50013 | 23.3% | 5.5%(+17.8)#5 | 6.9%(+16.4)#598 |
| 6. | 52071 | 23.0% | 5.5%(+17.5)#6 | 6.9%(+16.1)#618 |
| 7. | 50027 | 21.0% | 5.5%(+15.5)#7 | 6.9%(+14.1)#743 |
| 8. | 50848 | 20.0% | 5.5%(+14.5)#8 | 6.9%(+13.1)#826 |
| 9. | 52252 | 19.4% | 5.5%(+13.9)#9 | 6.9%(+12.5)#895 |
| 10. | 50032 | 16.3% | 5.5%(+10.8)#10 | 6.9%(+9.45)#1,380 |
| 11. | 50269 | 16.2% | 5.5%(+10.7)#11 | 6.9%(+9.30)#1,413 |
| 12. | 52168 | 16.1% | 5.5%(+10.6)#12 | 6.9%(+9.19)#1,440 |
| 13. | 52801 | 15.4% | 5.5%(+9.93)#13 | 6.9%(+8.54)#1,571 |
| 14. | 50831 | 15.4% | 5.5%(+9.89)#14 | 6.9%(+8.50)#1,588 |
| 15. | 51108 | 14.6% | 5.5%(+9.08)#15 | 6.9%(+7.69)#1,799 |
| 16. | 50012 | 14.6% | 5.5%(+9.06)#16 | 6.9%(+7.68)#1,803 |
| 17. | 51109 | 14.1% | 5.5%(+8.65)#17 | 6.9%(+7.27)#1,920 |
| 18. | 52557 | 14.0% | 5.5%(+8.52)#18 | 6.9%(+7.14)#1,967 |
| 19. | 52072 | 13.8% | 5.5%(+8.34)#19 | 6.9%(+6.96)#2,018 |
| 20. | 52075 | 13.6% | 5.5%(+8.06)#20 | 6.9%(+6.68)#2,111 |
| 21. | 50117 | 13.2% | 5.5%(+7.69)#21 | 6.9%(+6.31)#2,274 |
| 22. | 51022 | 12.2% | 5.5%(+6.75)#22 | 6.9%(+5.36)#2,690 |
| 23. | 52774 | 12.0% | 5.5%(+6.51)#23 | 6.9%(+5.12)#2,829 |
| 24. | 50530 | 12.0% | 5.5%(+6.48)#24 | 6.9%(+5.09)#2,845 |
| 25. | 51058 | 12.0% | 5.5%(+6.48)#25 | 6.9%(+5.09)#2,850 |
| 26. | 51460 | 11.8% | 5.5%(+6.27)#26 | 6.9%(+4.88)#2,986 |
| 27. | 52142 | 11.7% | 5.5%(+6.19)#27 | 6.9%(+4.80)#3,028 |
| 28. | 50120 | 11.4% | 5.5%(+5.95)#28 | 6.9%(+4.57)#3,197 |
| 29. | 50140 | 11.4% | 5.5%(+5.93)#29 | 6.9%(+4.55)#3,213 |
| 30. | 52240 | 11.4% | 5.5%(+5.87)#30 | 6.9%(+4.48)#3,263 |
| 31. | 50613 | 11.2% | 5.5%(+5.75)#31 | 6.9%(+4.37)#3,365 |
| 32. | 51570 | 11.1% | 5.5%(+5.60)#32 | 6.9%(+4.21)#3,484 |
| 33. | 51441 | 10.8% | 5.5%(+5.30)#33 | 6.9%(+3.91)#3,721 |
| 34. | 51520 | 10.8% | 5.5%(+5.27)#34 | 6.9%(+3.89)#3,740 |
| 35. | 50426 | 10.7% | 5.5%(+5.22)#35 | 6.9%(+3.83)#3,789 |
| 36. | 52619 | 10.7% | 5.5%(+5.17)#36 | 6.9%(+3.79)#3,824 |
| 37. | 51004 | 10.6% | 5.5%(+5.10)#37 | 6.9%(+3.71)#3,896 |
| 38. | 52729 | 10.5% | 5.5%(+5.01)#38 | 6.9%(+3.62)#3,988 |
| 39. | 52632 | 10.4% | 5.5%(+4.86)#39 | 6.9%(+3.48)#4,141 |
| 40. | 51034 | 10.3% | 5.5%(+4.85)#40 | 6.9%(+3.46)#4,157 |
| 41. | 51463 | 10.1% | 5.5%(+4.64)#41 | 6.9%(+3.25)#4,374 |
| 42. | 51440 | 10.1% | 5.5%(+4.64)#42 | 6.9%(+3.25)#4,375 |
| 43. | 50703 | 10.1% | 5.5%(+4.60)#43 | 6.9%(+3.22)#4,412 |
| 44. | 50660 | 9.9% | 5.5%(+4.40)#44 | 6.9%(+3.01)#4,675 |
| 45. | 52802 | 9.8% | 5.5%(+4.34)#45 | 6.9%(+2.95)#4,739 |
| 46. | 50313 | 9.8% | 5.5%(+4.32)#46 | 6.9%(+2.94)#4,771 |
| 47. | 52803 | 9.8% | 5.5%(+4.29)#47 | 6.9%(+2.90)#4,813 |
| 48. | 50314 | 9.8% | 5.5%(+4.29)#48 | 6.9%(+2.90)#4,816 |
| 49. | 50014 | 9.7% | 5.5%(+4.19)#49 | 6.9%(+2.80)#4,951 |
| 50. | 51536 | 9.6% | 5.5%(+4.14)#50 | 6.9%(+2.75)#5,015 |
| 51. | 50452 | 9.6% | 5.5%(+4.10)#51 | 6.9%(+2.71)#5,082 |
| 52. | 50401 | 9.5% | 5.5%(+3.99)#52 | 6.9%(+2.60)#5,235 |
| 53. | 52314 | 9.4% | 5.5%(+3.94)#53 | 6.9%(+2.56)#5,298 |
| 54. | 52158 | 9.3% | 5.5%(+3.82)#54 | 6.9%(+2.44)#5,475 |
| 55. | 52329 | 9.3% | 5.5%(+3.76)#55 | 6.9%(+2.38)#5,566 |
| 56. | 50315 | 9.2% | 5.5%(+3.69)#56 | 6.9%(+2.30)#5,672 |
| 57. | 50670 | 9.2% | 5.5%(+3.66)#57 | 6.9%(+2.27)#5,725 |
| 58. | 52157 | 9.1% | 5.5%(+3.65)#58 | 6.9%(+2.27)#5,737 |
| 59. | 51559 | 9.1% | 5.5%(+3.62)#59 | 6.9%(+2.24)#5,779 |
| 60. | 52739 | 9.1% | 5.5%(+3.62)#60 | 6.9%(+2.24)#5,782 |
| 61. | 50321 | 9.1% | 5.5%(+3.62)#61 | 6.9%(+2.23)#5,786 |
| 62. | 50316 | 9.1% | 5.5%(+3.57)#62 | 6.9%(+2.18)#5,870 |
| 63. | 51501 | 9.1% | 5.5%(+3.56)#63 | 6.9%(+2.18)#5,875 |
| 64. | 52767 | 9.0% | 5.5%(+3.52)#64 | 6.9%(+2.14)#5,925 |
| 65. | 50843 | 9.0% | 5.5%(+3.47)#65 | 6.9%(+2.08)#6,024 |
| 66. | 51103 | 8.9% | 5.5%(+3.43)#66 | 6.9%(+2.05)#6,078 |
| 67. | 50112 | 8.9% | 5.5%(+3.38)#67 | 6.9%(+1.99)#6,157 |
| 68. | 52574 | 8.9% | 5.5%(+3.38)#68 | 6.9%(+1.99)#6,164 |
| 69. | 52601 | 8.8% | 5.5%(+3.33)#69 | 6.9%(+1.94)#6,236 |
| 70. | 52322 | 8.8% | 5.5%(+3.29)#70 | 6.9%(+1.90)#6,317 |
| 71. | 51105 | 8.7% | 5.5%(+3.20)#71 | 6.9%(+1.81)#6,486 |
| 72. | 51010 | 8.6% | 5.5%(+3.12)#72 | 6.9%(+1.73)#6,614 |
| 73. | 50119 | 8.6% | 5.5%(+3.09)#73 | 6.9%(+1.70)#6,668 |
| 74. | 52720 | 8.6% | 5.5%(+3.09)#74 | 6.9%(+1.70)#6,670 |
| 75. | 51250 | 8.6% | 5.5%(+3.08)#75 | 6.9%(+1.69)#6,682 |
| 76. | 51510 | 8.4% | 5.5%(+2.91)#76 | 6.9%(+1.53)#6,982 |
| 77. | 51433 | 8.4% | 5.5%(+2.91)#77 | 6.9%(+1.52)#6,998 |
| 78. | 52565 | 8.4% | 5.5%(+2.89)#78 | 6.9%(+1.50)#7,024 |
| 79. | 52101 | 8.3% | 5.5%(+2.84)#79 | 6.9%(+1.45)#7,129 |
| 80. | 51044 | 8.3% | 5.5%(+2.84)#80 | 6.9%(+1.45)#7,142 |
| 81. | 50469 | 8.3% | 5.5%(+2.83)#81 | 6.9%(+1.44)#7,166 |
| 82. | 51040 | 8.3% | 5.5%(+2.82)#82 | 6.9%(+1.44)#7,174 |
| 83. | 52171 | 8.2% | 5.5%(+2.73)#83 | 6.9%(+1.35)#7,364 |
| 84. | 52049 | 8.2% | 5.5%(+2.70)#84 | 6.9%(+1.31)#7,427 |
| 85. | 51038 | 8.2% | 5.5%(+2.66)#85 | 6.9%(+1.27)#7,535 |
| 86. | 50501 | 8.1% | 5.5%(+2.59)#86 | 6.9%(+1.21)#7,642 |
| 87. | 50701 | 8.0% | 5.5%(+2.48)#87 | 6.9%(+1.09)#7,876 |
| 88. | 50574 | 8.0% | 5.5%(+2.47)#88 | 6.9%(+1.09)#7,888 |
| 89. | 50256 | 7.9% | 5.5%(+2.44)#89 | 6.9%(+1.06)#7,952 |
| 90. | 51037 | 7.8% | 5.5%(+2.32)#90 | 6.9%(+0.932)#8,235 |
| 91. | 50511 | 7.8% | 5.5%(+2.27)#91 | 6.9%(+0.887)#8,329 |
| 92. | 50010 | 7.7% | 5.5%(+2.25)#92 | 6.9%(+0.865)#8,382 |
| 93. | 52753 | 7.7% | 5.5%(+2.23)#93 | 6.9%(+0.844)#8,431 |
| 94. | 52001 | 7.7% | 5.5%(+2.21)#94 | 6.9%(+0.828)#8,476 |
| 95. | 50707 | 7.7% | 5.5%(+2.18)#95 | 6.9%(+0.795)#8,559 |
| 96. | 50616 | 7.7% | 5.5%(+2.17)#96 | 6.9%(+0.782)#8,593 |
| 97. | 52630 | 7.6% | 5.5%(+2.11)#97 | 6.9%(+0.728)#8,735 |
| 98. | 51545 | 7.6% | 5.5%(+2.10)#98 | 6.9%(+0.714)#8,759 |
| 99. | 50633 | 7.6% | 5.5%(+2.08)#99 | 6.9%(+0.695)#8,795 |
| 100. | 50517 | 7.6% | 5.5%(+2.08)#100 | 6.9%(+0.691)#8,803 |
Common Questions
What are the Top 10 Zip Codes with the Highest Percentage of Population Employed in Accommodation & Food Services in Iowa?
Top 10 Zip Codes with the Highest Percentage of Population Employed in Accommodation & Food Services in Iowa are:
What zip code has the Highest Percentage of Population Employed in Accommodation & Food Services in Iowa?
51101 has the Highest Percentage of Population Employed in Accommodation & Food Services in Iowa with 52.4%.
What is the Percentage of Population Employed in Accommodation & Food Services in the State of Iowa?
Percentage of Population Employed in Accommodation & Food Services in Iowa is 5.5%.
What is the Percentage of Population Employed in Accommodation & Food Services in the United States?
Percentage of Population Employed in Accommodation & Food Services in the United States is 6.9%.