Zip Codes with the Largest German Community in Iowa
RELATED REPORTS & OPTIONS
German
Iowa
Compare Zip Codes
Map of Zip Codes with the Largest German Community in Iowa
0
20,000
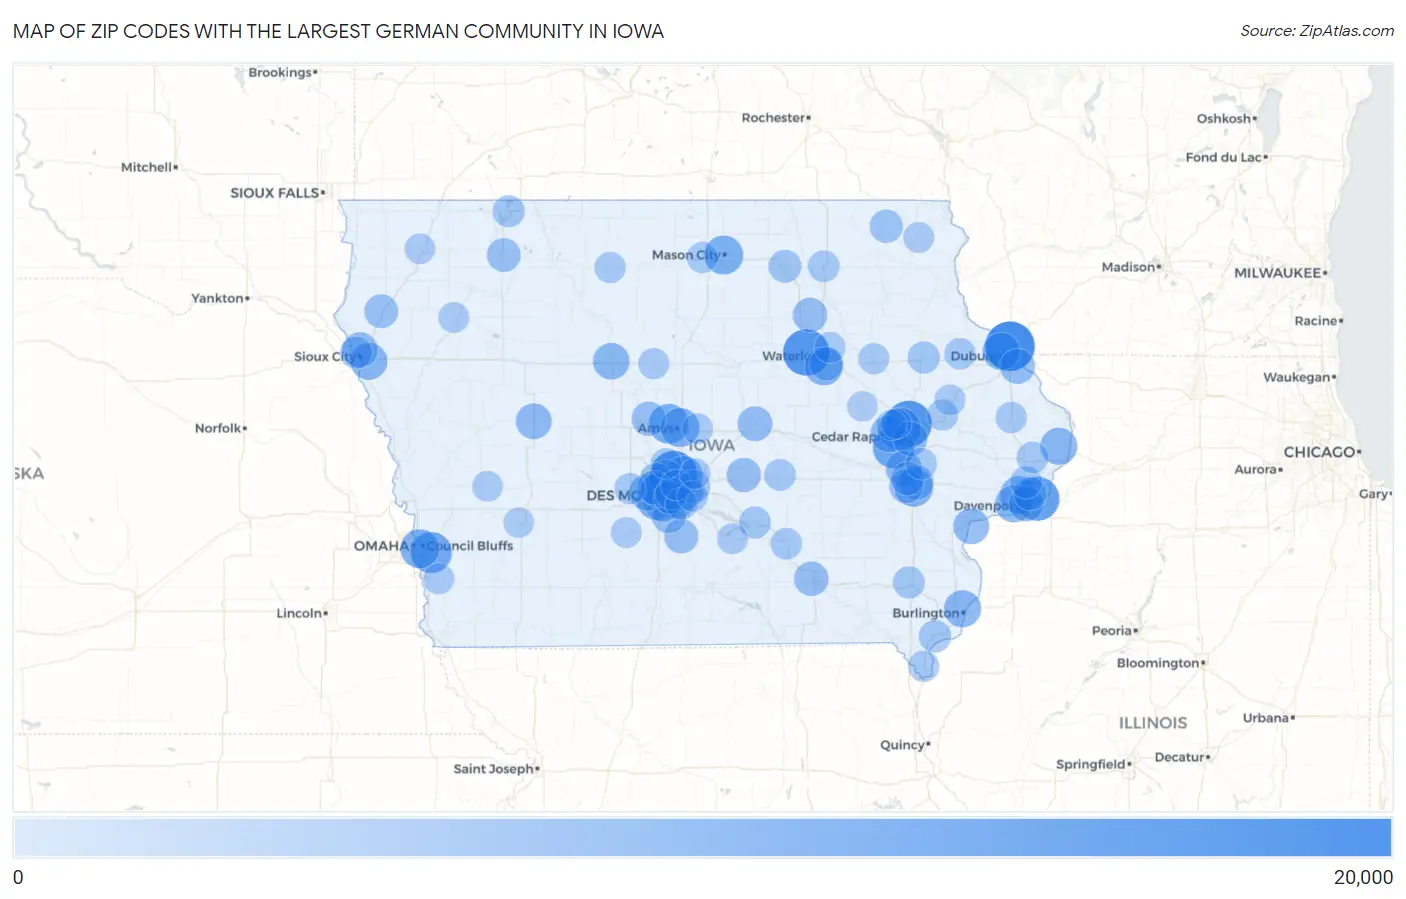
Zip Codes with the Largest German Community in Iowa
| Zip Code | German | vs State | vs National | |
| 1. | 52001 | 18,369 | 998,268(1.84%)#1 | 41,919,607(0.04%)#12 |
| 2. | 50613 | 15,626 | 998,268(1.57%)#2 | 41,919,607(0.04%)#44 |
| 3. | 52302 | 15,480 | 998,268(1.55%)#3 | 41,919,607(0.04%)#46 |
| 4. | 50023 | 15,372 | 998,268(1.54%)#4 | 41,919,607(0.04%)#49 |
| 5. | 52722 | 13,563 | 998,268(1.36%)#5 | 41,919,607(0.03%)#89 |
| 6. | 52402 | 11,979 | 998,268(1.20%)#6 | 41,919,607(0.03%)#157 |
| 7. | 52404 | 11,842 | 998,268(1.19%)#7 | 41,919,607(0.03%)#164 |
| 8. | 51503 | 11,322 | 998,268(1.13%)#8 | 41,919,607(0.03%)#194 |
| 9. | 50014 | 10,138 | 998,268(1.02%)#9 | 41,919,607(0.02%)#290 |
| 10. | 50266 | 9,756 | 998,268(0.98%)#10 | 41,919,607(0.02%)#334 |
| 11. | 50010 | 9,529 | 998,268(0.95%)#11 | 41,919,607(0.02%)#373 |
| 12. | 51501 | 9,504 | 998,268(0.95%)#12 | 41,919,607(0.02%)#378 |
| 13. | 50401 | 9,490 | 998,268(0.95%)#13 | 41,919,607(0.02%)#380 |
| 14. | 52240 | 9,139 | 998,268(0.92%)#14 | 41,919,607(0.02%)#419 |
| 15. | 50322 | 9,081 | 998,268(0.91%)#15 | 41,919,607(0.02%)#431 |
| 16. | 50701 | 8,790 | 998,268(0.88%)#16 | 41,919,607(0.02%)#473 |
| 17. | 50265 | 8,418 | 998,268(0.84%)#17 | 41,919,607(0.02%)#545 |
| 18. | 50021 | 8,380 | 998,268(0.84%)#18 | 41,919,607(0.02%)#554 |
| 19. | 52806 | 8,341 | 998,268(0.84%)#19 | 41,919,607(0.02%)#562 |
| 20. | 52002 | 8,190 | 998,268(0.82%)#20 | 41,919,607(0.02%)#603 |
| 21. | 52804 | 7,996 | 998,268(0.80%)#21 | 41,919,607(0.02%)#644 |
| 22. | 51106 | 7,986 | 998,268(0.80%)#22 | 41,919,607(0.02%)#649 |
| 23. | 52601 | 7,959 | 998,268(0.80%)#23 | 41,919,607(0.02%)#658 |
| 24. | 52732 | 7,874 | 998,268(0.79%)#24 | 41,919,607(0.02%)#677 |
| 25. | 52405 | 7,631 | 998,268(0.76%)#25 | 41,919,607(0.02%)#735 |
| 26. | 50501 | 7,454 | 998,268(0.75%)#26 | 41,919,607(0.02%)#771 |
| 27. | 50263 | 7,419 | 998,268(0.74%)#27 | 41,919,607(0.02%)#778 |
| 28. | 50317 | 7,295 | 998,268(0.73%)#28 | 41,919,607(0.02%)#819 |
| 29. | 50315 | 6,950 | 998,268(0.70%)#29 | 41,919,607(0.02%)#934 |
| 30. | 52317 | 6,912 | 998,268(0.69%)#30 | 41,919,607(0.02%)#949 |
| 31. | 52761 | 6,859 | 998,268(0.69%)#31 | 41,919,607(0.02%)#970 |
| 32. | 51401 | 6,851 | 998,268(0.69%)#32 | 41,919,607(0.02%)#974 |
| 33. | 51104 | 6,637 | 998,268(0.66%)#33 | 41,919,607(0.02%)#1,065 |
| 34. | 50310 | 6,623 | 998,268(0.66%)#34 | 41,919,607(0.02%)#1,075 |
| 35. | 52003 | 6,295 | 998,268(0.63%)#35 | 41,919,607(0.02%)#1,221 |
| 36. | 50131 | 6,270 | 998,268(0.63%)#36 | 41,919,607(0.01%)#1,230 |
| 37. | 52803 | 6,238 | 998,268(0.62%)#37 | 41,919,607(0.01%)#1,251 |
| 38. | 50158 | 6,064 | 998,268(0.61%)#38 | 41,919,607(0.01%)#1,350 |
| 39. | 52245 | 5,917 | 998,268(0.59%)#39 | 41,919,607(0.01%)#1,423 |
| 40. | 52403 | 5,876 | 998,268(0.59%)#40 | 41,919,607(0.01%)#1,447 |
| 41. | 52501 | 5,765 | 998,268(0.58%)#41 | 41,919,607(0.01%)#1,515 |
| 42. | 50677 | 5,754 | 998,268(0.58%)#42 | 41,919,607(0.01%)#1,523 |
| 43. | 50036 | 5,672 | 998,268(0.57%)#43 | 41,919,607(0.01%)#1,571 |
| 44. | 50125 | 5,661 | 998,268(0.57%)#44 | 41,919,607(0.01%)#1,583 |
| 45. | 50208 | 5,615 | 998,268(0.56%)#45 | 41,919,607(0.01%)#1,612 |
| 46. | 52246 | 5,434 | 998,268(0.54%)#46 | 41,919,607(0.01%)#1,729 |
| 47. | 50211 | 5,402 | 998,268(0.54%)#47 | 41,919,607(0.01%)#1,748 |
| 48. | 50111 | 5,395 | 998,268(0.54%)#48 | 41,919,607(0.01%)#1,752 |
| 49. | 50325 | 5,316 | 998,268(0.53%)#49 | 41,919,607(0.01%)#1,815 |
| 50. | 51031 | 5,288 | 998,268(0.53%)#50 | 41,919,607(0.01%)#1,838 |
| 51. | 51301 | 5,199 | 998,268(0.52%)#51 | 41,919,607(0.01%)#1,888 |
| 52. | 50702 | 5,143 | 998,268(0.52%)#52 | 41,919,607(0.01%)#1,934 |
| 53. | 50323 | 5,084 | 998,268(0.51%)#53 | 41,919,607(0.01%)#1,975 |
| 54. | 52241 | 5,071 | 998,268(0.51%)#54 | 41,919,607(0.01%)#1,982 |
| 55. | 52101 | 4,793 | 998,268(0.48%)#55 | 41,919,607(0.01%)#2,216 |
| 56. | 52807 | 4,649 | 998,268(0.47%)#56 | 41,919,607(0.01%)#2,341 |
| 57. | 50009 | 4,618 | 998,268(0.46%)#57 | 41,919,607(0.01%)#2,377 |
| 58. | 50616 | 4,442 | 998,268(0.44%)#58 | 41,919,607(0.01%)#2,532 |
| 59. | 50312 | 4,278 | 998,268(0.43%)#59 | 41,919,607(0.01%)#2,691 |
| 60. | 52627 | 4,121 | 998,268(0.41%)#60 | 41,919,607(0.01%)#2,887 |
| 61. | 52748 | 4,116 | 998,268(0.41%)#61 | 41,919,607(0.01%)#2,890 |
| 62. | 50311 | 3,923 | 998,268(0.39%)#62 | 41,919,607(0.01%)#3,125 |
| 63. | 52057 | 3,910 | 998,268(0.39%)#63 | 41,919,607(0.01%)#3,144 |
| 64. | 51103 | 3,842 | 998,268(0.38%)#64 | 41,919,607(0.01%)#3,211 |
| 65. | 52641 | 3,800 | 998,268(0.38%)#65 | 41,919,607(0.01%)#3,263 |
| 66. | 50320 | 3,762 | 998,268(0.38%)#66 | 41,919,607(0.01%)#3,305 |
| 67. | 51360 | 3,756 | 998,268(0.38%)#67 | 41,919,607(0.01%)#3,314 |
| 68. | 50219 | 3,600 | 998,268(0.36%)#68 | 41,919,607(0.01%)#3,535 |
| 69. | 52742 | 3,535 | 998,268(0.35%)#69 | 41,919,607(0.01%)#3,611 |
| 70. | 50112 | 3,529 | 998,268(0.35%)#70 | 41,919,607(0.01%)#3,618 |
| 71. | 50659 | 3,411 | 998,268(0.34%)#71 | 41,919,607(0.01%)#3,790 |
| 72. | 52040 | 3,379 | 998,268(0.34%)#72 | 41,919,607(0.01%)#3,839 |
| 73. | 52333 | 3,364 | 998,268(0.34%)#73 | 41,919,607(0.01%)#3,855 |
| 74. | 52577 | 3,361 | 998,268(0.34%)#74 | 41,919,607(0.01%)#3,860 |
| 75. | 52060 | 3,230 | 998,268(0.32%)#75 | 41,919,607(0.01%)#4,067 |
| 76. | 52205 | 3,170 | 998,268(0.32%)#76 | 41,919,607(0.01%)#4,177 |
| 77. | 50428 | 3,157 | 998,268(0.32%)#77 | 41,919,607(0.01%)#4,197 |
| 78. | 50703 | 3,146 | 998,268(0.32%)#78 | 41,919,607(0.01%)#4,223 |
| 79. | 52632 | 3,100 | 998,268(0.31%)#79 | 41,919,607(0.01%)#4,305 |
| 80. | 50003 | 3,051 | 998,268(0.31%)#80 | 41,919,607(0.01%)#4,387 |
| 81. | 50511 | 3,048 | 998,268(0.31%)#81 | 41,919,607(0.01%)#4,394 |
| 82. | 50644 | 3,012 | 998,268(0.30%)#82 | 41,919,607(0.01%)#4,460 |
| 83. | 50595 | 3,009 | 998,268(0.30%)#83 | 41,919,607(0.01%)#4,466 |
| 84. | 50226 | 2,986 | 998,268(0.30%)#84 | 41,919,607(0.01%)#4,504 |
| 85. | 50313 | 2,941 | 998,268(0.29%)#85 | 41,919,607(0.01%)#4,581 |
| 86. | 51534 | 2,894 | 998,268(0.29%)#86 | 41,919,607(0.01%)#4,673 |
| 87. | 50327 | 2,838 | 998,268(0.28%)#87 | 41,919,607(0.01%)#4,791 |
| 88. | 52310 | 2,835 | 998,268(0.28%)#88 | 41,919,607(0.01%)#4,798 |
| 89. | 52172 | 2,814 | 998,268(0.28%)#89 | 41,919,607(0.01%)#4,838 |
| 90. | 50201 | 2,787 | 998,268(0.28%)#90 | 41,919,607(0.01%)#4,896 |
| 91. | 50035 | 2,742 | 998,268(0.27%)#91 | 41,919,607(0.01%)#4,980 |
| 92. | 50138 | 2,731 | 998,268(0.27%)#92 | 41,919,607(0.01%)#4,999 |
| 93. | 51537 | 2,705 | 998,268(0.27%)#93 | 41,919,607(0.01%)#5,041 |
| 94. | 51012 | 2,693 | 998,268(0.27%)#94 | 41,919,607(0.01%)#5,065 |
| 95. | 51201 | 2,660 | 998,268(0.27%)#95 | 41,919,607(0.01%)#5,126 |
| 96. | 50273 | 2,628 | 998,268(0.26%)#96 | 41,919,607(0.01%)#5,180 |
| 97. | 52411 | 2,607 | 998,268(0.26%)#97 | 41,919,607(0.01%)#5,218 |
| 98. | 52349 | 2,517 | 998,268(0.25%)#98 | 41,919,607(0.01%)#5,414 |
| 99. | 50022 | 2,476 | 998,268(0.25%)#99 | 41,919,607(0.01%)#5,518 |
| 100. | 52233 | 2,451 | 998,268(0.25%)#100 | 41,919,607(0.01%)#5,574 |
Common Questions
What are the Top 10 Zip Codes with the Largest German Community in Iowa?
Top 10 Zip Codes with the Largest German Community in Iowa are:
What zip code has the Largest German Community in Iowa?
52001 has the Largest German Community in Iowa with 18,369.
What is the Total German Population in the State of Iowa?
Total German Population in Iowa is 998,268.
What is the Total German Population in the United States?
Total German Population in the United States is 41,919,607.