Zip Codes with the Largest Slavic Community in Iowa

RELATED REPORTS & OPTIONS

Slavic
Population
Families and Households
Female Fertility
Female Fertility (Unmarried)
Race (Community Size)
Race (Percentage)
Ancestry (Community Size)
AfghanAfricanAlaska NativeAlaskan AthabascanAlbanianAleutAlsatianAmericanApacheArabArapahoArgentineanArmenianAssyrian / Chaldean / SyriacAustralianAustrianBahamianBangladeshiBarbadianBasqueBelgianBelizeanBermudanBhutaneseBlackfeetBolivianBrazilianBritishBritish West IndianBulgarianBurmeseCajunCambodianCanadianCape VerdeanCarpatho RusynCelticCentral AmericanCentral American IndianCherokeeCheyenneChickasawChileanChineseChippewaChoctawColombianColvilleComancheCosta RicanCreeCreekCroatianCrowCubanCypriotCzechCzechoslovakianDanishDelawareDominicanDutchDutch West IndianEastern EuropeanEcuadorianEgyptianEnglishEstonianEthiopianEuropeanFijianFilipinoFinnishFrenchFrench American IndianFrench CanadianGermanGerman RussianGhanaianGreekGuamanian / ChamorroGuatemalanGuyaneseHaitianHmongHonduranHopiHoumaHungarianIcelanderIndian (Asian)IndonesianInupiatIranianIraqiIrishIroquoisIsraeliItalianJamaicanJapaneseJordanianKenyanKiowaKoreanLaotianLatvianLebaneseLiberianLithuanianLumbeeLuxembourgerMacedonianMalaysianMalteseMarshalleseMenomineeMexicanMexican American IndianMongolianMoroccanNative HawaiianNavajoNepaleseNew ZealanderNicaraguanNigerianNorthern EuropeanNorwegianOkinawanOsageOttawaPaiutePakistaniPalestinianPanamanianParaguayanPennsylvania GermanPeruvianPimaPolishPortuguesePotawatomiPuebloPuerto RicanPuget Sound SalishRomanianRussianSalvadoranSamoanScandinavianScotch-IrishScottishSeminoleSenegaleseSerbianShoshoneSierra LeoneanSiouxSlavicSlovakSloveneSomaliSouth AfricanSouth AmericanSouth American IndianSoviet UnionSpaniardSpanishSpanish AmericanSpanish American IndianSri LankanSubsaharan AfricanSudaneseSwedishSwissSyrianTaiwaneseThaiTlingit-HaidaTohono O'OdhamTonganTrinidadian and TobagonianTsimshianTurkishU.S. Virgin IslanderUgandanUkrainianUruguayanUteVenezuelanVietnameseWelshWest IndianYakamaYaquiYugoslavianYumanYup'ikZimbabwean
Ancestry (Percentage)
AfghanAfricanAlaska NativeAlaskan AthabascanAlbanianAleutAlsatianAmericanApacheArabArapahoArgentineanArmenianAssyrian / Chaldean / SyriacAustralianAustrianBahamianBangladeshiBarbadianBasqueBelgianBelizeanBermudanBhutaneseBlackfeetBolivianBrazilianBritishBritish West IndianBulgarianBurmeseCajunCambodianCanadianCape VerdeanCarpatho RusynCelticCentral AmericanCentral American IndianCherokeeCheyenneChickasawChileanChineseChippewaChoctawColombianColvilleComancheCosta RicanCreeCreekCroatianCrowCubanCypriotCzechCzechoslovakianDanishDelawareDominicanDutchDutch West IndianEastern EuropeanEcuadorianEgyptianEnglishEstonianEthiopianEuropeanFijianFilipinoFinnishFrenchFrench American IndianFrench CanadianGermanGerman RussianGhanaianGreekGuamanian / ChamorroGuatemalanGuyaneseHaitianHmongHonduranHopiHoumaHungarianIcelanderIndian (Asian)IndonesianInupiatIranianIraqiIrishIroquoisIsraeliItalianJamaicanJapaneseJordanianKenyanKiowaKoreanLaotianLatvianLebaneseLiberianLithuanianLumbeeLuxembourgerMacedonianMalaysianMalteseMarshalleseMenomineeMexicanMexican American IndianMongolianMoroccanNative HawaiianNavajoNepaleseNew ZealanderNicaraguanNigerianNorthern EuropeanNorwegianOkinawanOsageOttawaPaiutePakistaniPalestinianPanamanianParaguayanPennsylvania GermanPeruvianPimaPolishPortuguesePotawatomiPuebloPuerto RicanPuget Sound SalishRomanianRussianSalvadoranSamoanScandinavianScotch-IrishScottishSeminoleSenegaleseSerbianShoshoneSierra LeoneanSiouxSlavicSlovakSloveneSomaliSouth AfricanSouth AmericanSouth American IndianSoviet UnionSpaniardSpanishSpanish AmericanSpanish American IndianSri LankanSubsaharan AfricanSudaneseSwedishSwissSyrianTaiwaneseThaiTlingit-HaidaTohono O'OdhamTonganTrinidadian and TobagonianTsimshianTurkishU.S. Virgin IslanderUgandanUkrainianUruguayanUteVenezuelanVietnameseWelshWest IndianYakamaYaquiYugoslavianYumanYup'ikZimbabwean
Immigrant Origin (Total)
AfghanistanAfricaAlbaniaArgentinaArmeniaAsiaAustraliaAustriaAzoresBahamasBangladeshBarbadosBelarusBelgiumBelizeBoliviaBosnia and HerzegovinaBrazilBulgariaBurma / MyanmarCabo VerdeCambodiaCameroonCanadaCaribbeanCentral AmericaChileChinaColombiaCongoCosta RicaCroatiaCubaCzechoslovakiaDenmarkDominicaDominican RepublicEastern AfricaEastern AsiaEastern EuropeEcuadorEgyptEl SalvadorEnglandEritreaEthiopiaEuropeFijiFranceGermanyGhanaGreeceGrenadaGuatemalaGuyanaHaitiHondurasHong KongHungaryIndiaIndonesiaIranIraqIrelandIsraelItalyJamaicaJapanJordanKazakhstanKenyaKoreaKuwaitLaosLatin AmericaLatviaLebanonLiberiaLithuaniaMalaysiaMexicoMicronesiaMiddle AfricaMoldovaMoroccoNepalNetherlandsNicaraguaNigeriaNorth MacedoniaNorthern AfricaNorthern EuropeNorwayOceaniaPakistanPanamaPeruPhilippinesPolandPortugalRomaniaRussiaSaudi ArabiaScotlandSenegalSerbiaSierra LeoneSingaporeSomaliaSouth AfricaSouth AmericaSouth Central AsiaSouth Eastern AsiaSouthern EuropeSpainSri LankaSt. Vincent and the GrenadinesSudanSwedenSwitzerlandSyriaTaiwanThailandTrinidad and TobagoTurkeyUgandaUkraineUruguayUzbekistanVenezuelaVietnamWest IndiesWestern AfricaWestern AsiaWestern EuropeYemenZaireZimbabwe
Immigrant Origin (Percentage)
AfghanistanAfricaAlbaniaArgentinaArmeniaAsiaAustraliaAustriaAzoresBahamasBangladeshBarbadosBelarusBelgiumBelizeBoliviaBosnia and HerzegovinaBrazilBulgariaBurma / MyanmarCabo VerdeCambodiaCameroonCanadaCaribbeanCentral AmericaChileChinaColombiaCongoCosta RicaCroatiaCubaCzechoslovakiaDenmarkDominicaDominican RepublicEastern AfricaEastern AsiaEastern EuropeEcuadorEgyptEl SalvadorEnglandEritreaEthiopiaEuropeFijiFranceGermanyGhanaGreeceGrenadaGuatemalaGuyanaHaitiHondurasHong KongHungaryIndiaIndonesiaIranIraqIrelandIsraelItalyJamaicaJapanJordanKazakhstanKenyaKoreaKuwaitLaosLatin AmericaLatviaLebanonLiberiaLithuaniaMalaysiaMexicoMicronesiaMiddle AfricaMoldovaMoroccoNepalNetherlandsNicaraguaNigeriaNorth MacedoniaNorthern AfricaNorthern EuropeNorwayOceaniaPakistanPanamaPeruPhilippinesPolandPortugalRomaniaRussiaSaudi ArabiaScotlandSenegalSerbiaSierra LeoneSingaporeSomaliaSouth AfricaSouth AmericaSouth Central AsiaSouth Eastern AsiaSouthern EuropeSpainSri LankaSt. Vincent and the GrenadinesSudanSwedenSwitzerlandSyriaTaiwanThailandTrinidad and TobagoTurkeyUgandaUkraineUruguayUzbekistanVenezuelaVietnamWest IndiesWestern AfricaWestern AsiaWestern EuropeYemenZaireZimbabwe
Income
Income (Families)
Income (Households)
Poverty
Poverty (Families)
Unemployment
Employment Occupations
Employment Industries
Employer Class
Commute Time
Commute Means
School Enrollment
Education by Degree Field
Occupancy
Finances
Physical Characteristics
Iowa
Compare Zip Codes
Comparison Subject

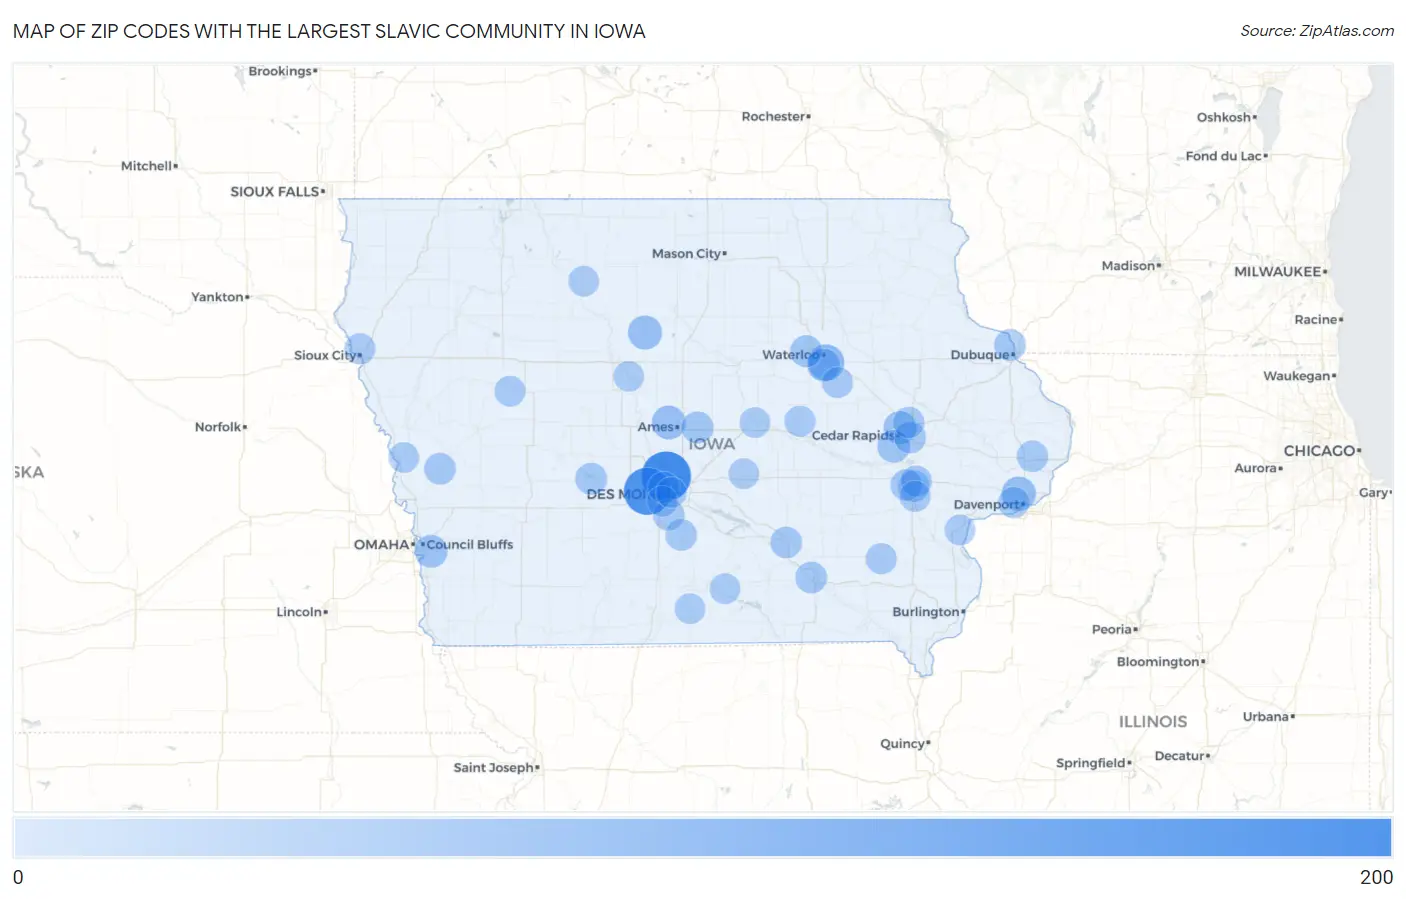
Map of Zip Codes with the Largest Slavic Community in Iowa

0
200
Zip Codes with the Largest Slavic Community in Iowa Map

Zip Codes with the Largest Slavic Community in Iowa

Zip Code Slavic vs State vs National
1.50131175790(22.15%)#1129,541(0.14%)#52
2.50263154790(19.49%)#2129,541(0.12%)#67
3.5070251790(6.46%)#3129,541(0.04%)#583
4.5280635790(4.43%)#4129,541(0.03%)#1,020
5.5053332790(4.05%)#5129,541(0.02%)#1,161
6.5001431790(3.92%)#6129,541(0.02%)#1,177
7.5070122790(2.78%)#7129,541(0.02%)#1,715
8.5240221790(2.66%)#8129,541(0.02%)#1,787
9.5240421790(2.66%)#9129,541(0.02%)#1,788
10.5150321790(2.66%)#10129,541(0.02%)#1,794
11.5061314790(1.77%)#11129,541(0.01%)#2,574
12.5020114790(1.77%)#12129,541(0.01%)#2,673
13.5240313790(1.65%)#13129,541(0.01%)#2,767
14.5021613790(1.65%)#14129,541(0.01%)#2,864
15.5200111790(1.39%)#15129,541(0.01%)#3,073
16.5224011790(1.39%)#16129,541(0.01%)#3,085
17.5032211790(1.39%)#17129,541(0.01%)#3,093
18.5250111790(1.39%)#18129,541(0.01%)#3,100
19.5157911790(1.39%)#19129,541(0.01%)#3,203
20.5257710790(1.27%)#20129,541(0.01%)#3,380
21.523029790(1.14%)#21129,541(0.01%)#3,477
22.522469790(1.14%)#22129,541(0.01%)#3,566
23.501259790(1.14%)#23129,541(0.01%)#3,576
24.527429790(1.14%)#24129,541(0.01%)#3,654
25.528048790(1.01%)#25129,541(0.01%)#3,783
26.502118790(1.01%)#26129,541(0.01%)#3,841
27.522457790(0.89%)#27129,541(0.01%)#4,038
28.523426790(0.76%)#28129,541(0.00%)#4,367
29.511045790(0.63%)#29129,541(0.00%)#4,463
30.506515790(0.63%)#30129,541(0.00%)#4,546
31.525405790(0.63%)#31129,541(0.00%)#4,588
32.522355790(0.63%)#32129,541(0.00%)#4,597
33.502654790(0.51%)#33129,541(0.00%)#4,629
34.503114790(0.51%)#34129,541(0.00%)#4,659
35.514663790(0.38%)#35129,541(0.00%)#4,984
36.501582790(0.25%)#36129,541(0.00%)#5,027
37.505972790(0.25%)#37129,541(0.00%)#5,167
38.502382790(0.25%)#38129,541(0.00%)#5,175
39.501232790(0.25%)#39129,541(0.00%)#5,191
40.502081790(0.13%)#40129,541(0.00%)#5,252
41.527491790(0.13%)#41129,541(0.00%)#5,326
42.505571790(0.13%)#42129,541(0.00%)#5,333
43.515451790(0.13%)#43129,541(0.00%)#5,352

Common Questions

What are the Top 10 Zip Codes with the Largest Slavic Community in Iowa?
Top 10 Zip Codes with the Largest Slavic Community in Iowa are:
#1
175
#2
154
#3
51
#4
35
#5
32
#6
31
#7
22
#8
21
#9
21
#10
21
What zip code has the Largest Slavic Community in Iowa?
50131 has the Largest Slavic Community in Iowa with 175.
What is the Total Slavic Population in the State of Iowa?
Total Slavic Population in Iowa is 790.
What is the Total Slavic Population in the United States?
Total Slavic Population in the United States is 129,541.