Zip Codes with the Largest Austrian Community in Iowa
RELATED REPORTS & OPTIONS
Austrian
Iowa
Compare Zip Codes
Map of Zip Codes with the Largest Austrian Community in Iowa
0
250
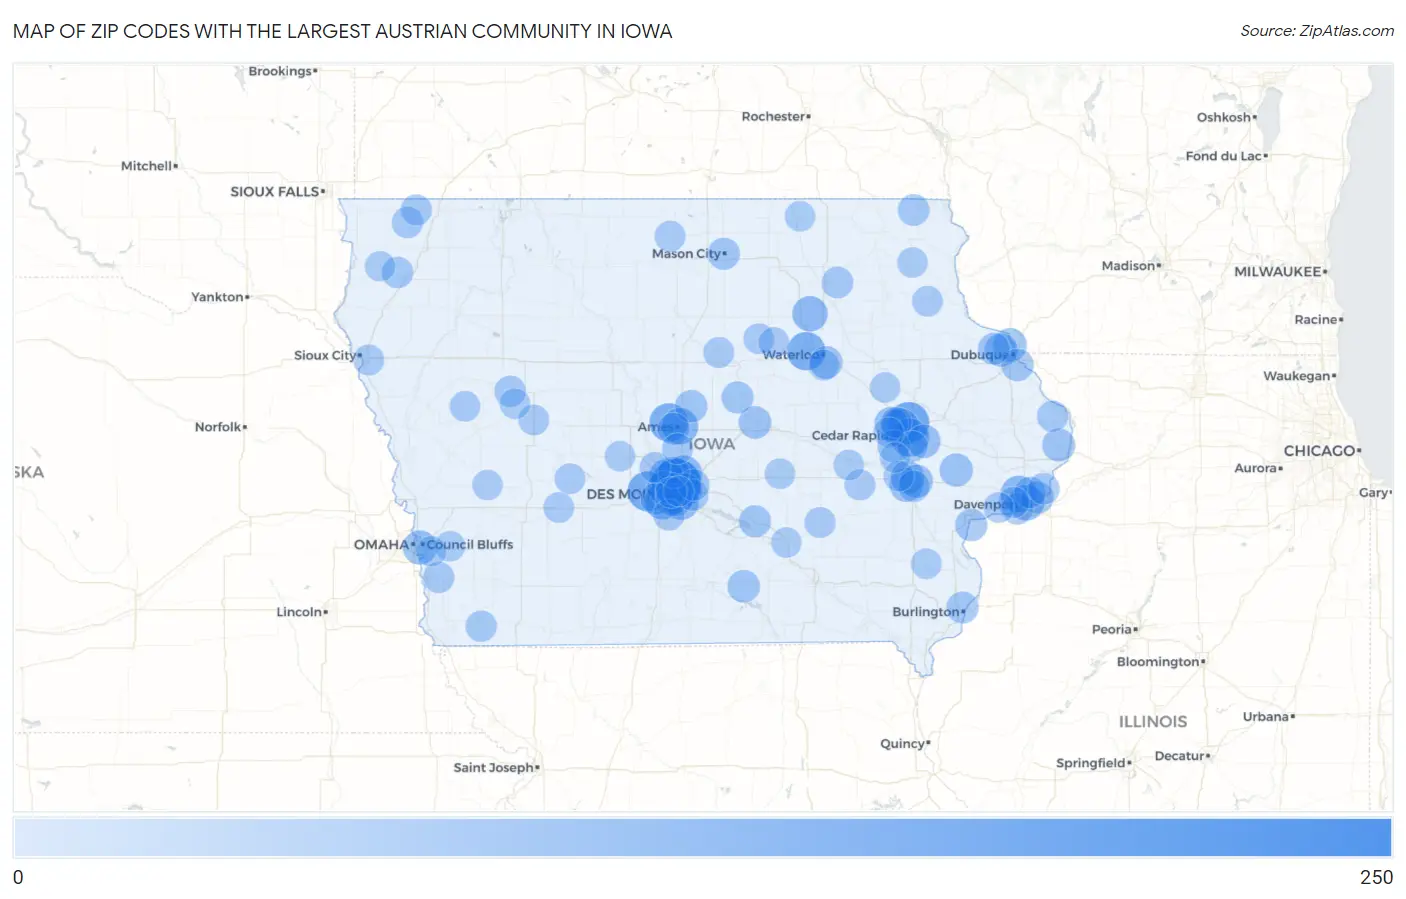
Zip Codes with the Largest Austrian Community in Iowa
| Zip Code | Austrian | vs State | vs National | |
| 1. | 50313 | 246 | 4,003(6.15%)#1 | 616,016(0.04%)#236 |
| 2. | 52302 | 139 | 4,003(3.47%)#2 | 616,016(0.02%)#1,039 |
| 3. | 50263 | 125 | 4,003(3.12%)#3 | 616,016(0.02%)#1,250 |
| 4. | 52402 | 109 | 4,003(2.72%)#4 | 616,016(0.02%)#1,541 |
| 5. | 50014 | 108 | 4,003(2.70%)#5 | 616,016(0.02%)#1,562 |
| 6. | 50613 | 107 | 4,003(2.67%)#6 | 616,016(0.02%)#1,581 |
| 7. | 52403 | 105 | 4,003(2.62%)#7 | 616,016(0.02%)#1,634 |
| 8. | 50010 | 83 | 4,003(2.07%)#8 | 616,016(0.01%)#2,273 |
| 9. | 50265 | 83 | 4,003(2.07%)#9 | 616,016(0.01%)#2,274 |
| 10. | 50021 | 82 | 4,003(2.05%)#10 | 616,016(0.01%)#2,309 |
| 11. | 52806 | 80 | 4,003(2.00%)#11 | 616,016(0.01%)#2,382 |
| 12. | 50309 | 79 | 4,003(1.97%)#12 | 616,016(0.01%)#2,426 |
| 13. | 52803 | 75 | 4,003(1.87%)#13 | 616,016(0.01%)#2,545 |
| 14. | 50677 | 70 | 4,003(1.75%)#14 | 616,016(0.01%)#2,762 |
| 15. | 50320 | 65 | 4,003(1.62%)#15 | 616,016(0.01%)#2,994 |
| 16. | 50131 | 58 | 4,003(1.45%)#16 | 616,016(0.01%)#3,355 |
| 17. | 51501 | 56 | 4,003(1.40%)#17 | 616,016(0.01%)#3,461 |
| 18. | 52001 | 49 | 4,003(1.22%)#18 | 616,016(0.01%)#3,910 |
| 19. | 52246 | 49 | 4,003(1.22%)#19 | 616,016(0.01%)#3,937 |
| 20. | 52411 | 49 | 4,003(1.22%)#20 | 616,016(0.01%)#3,966 |
| 21. | 52241 | 47 | 4,003(1.17%)#21 | 616,016(0.01%)#4,079 |
| 22. | 52002 | 47 | 4,003(1.17%)#22 | 616,016(0.01%)#4,085 |
| 23. | 52314 | 47 | 4,003(1.17%)#23 | 616,016(0.01%)#4,114 |
| 24. | 50317 | 46 | 4,003(1.15%)#24 | 616,016(0.01%)#4,132 |
| 25. | 52245 | 45 | 4,003(1.12%)#25 | 616,016(0.01%)#4,216 |
| 26. | 50322 | 44 | 4,003(1.10%)#26 | 616,016(0.01%)#4,276 |
| 27. | 52772 | 44 | 4,003(1.10%)#27 | 616,016(0.01%)#4,329 |
| 28. | 52732 | 39 | 4,003(0.97%)#28 | 616,016(0.01%)#4,725 |
| 29. | 50158 | 37 | 4,003(0.92%)#29 | 616,016(0.01%)#4,891 |
| 30. | 50702 | 37 | 4,003(0.92%)#30 | 616,016(0.01%)#4,906 |
| 31. | 50315 | 34 | 4,003(0.85%)#31 | 616,016(0.01%)#5,160 |
| 32. | 50236 | 34 | 4,003(0.85%)#32 | 616,016(0.01%)#5,241 |
| 33. | 52569 | 34 | 4,003(0.85%)#33 | 616,016(0.01%)#5,244 |
| 34. | 52404 | 33 | 4,003(0.82%)#34 | 616,016(0.01%)#5,259 |
| 35. | 52722 | 33 | 4,003(0.82%)#35 | 616,016(0.01%)#5,263 |
| 36. | 52003 | 33 | 4,003(0.82%)#36 | 616,016(0.01%)#5,303 |
| 37. | 52761 | 31 | 4,003(0.77%)#37 | 616,016(0.01%)#5,481 |
| 38. | 50266 | 30 | 4,003(0.75%)#38 | 616,016(0.00%)#5,587 |
| 39. | 50401 | 30 | 4,003(0.75%)#39 | 616,016(0.00%)#5,600 |
| 40. | 50219 | 28 | 4,003(0.70%)#40 | 616,016(0.00%)#5,887 |
| 41. | 50258 | 28 | 4,003(0.70%)#41 | 616,016(0.00%)#5,949 |
| 42. | 52601 | 27 | 4,003(0.67%)#42 | 616,016(0.00%)#5,990 |
| 43. | 50321 | 27 | 4,003(0.67%)#43 | 616,016(0.00%)#6,058 |
| 44. | 50013 | 27 | 4,003(0.67%)#44 | 616,016(0.00%)#6,075 |
| 45. | 52039 | 26 | 4,003(0.65%)#45 | 616,016(0.00%)#6,229 |
| 46. | 52240 | 24 | 4,003(0.60%)#46 | 616,016(0.00%)#6,406 |
| 47. | 50327 | 24 | 4,003(0.60%)#47 | 616,016(0.00%)#6,468 |
| 48. | 52140 | 24 | 4,003(0.60%)#48 | 616,016(0.00%)#6,528 |
| 49. | 50310 | 23 | 4,003(0.57%)#49 | 616,016(0.00%)#6,553 |
| 50. | 50009 | 23 | 4,003(0.57%)#50 | 616,016(0.00%)#6,580 |
| 51. | 52802 | 23 | 4,003(0.57%)#51 | 616,016(0.00%)#6,628 |
| 52. | 52807 | 22 | 4,003(0.55%)#52 | 616,016(0.00%)#6,765 |
| 53. | 52753 | 22 | 4,003(0.55%)#53 | 616,016(0.00%)#6,806 |
| 54. | 50630 | 22 | 4,003(0.55%)#54 | 616,016(0.00%)#6,836 |
| 55. | 50023 | 21 | 4,003(0.52%)#55 | 616,016(0.00%)#6,858 |
| 56. | 51041 | 21 | 4,003(0.52%)#56 | 616,016(0.00%)#6,953 |
| 57. | 51237 | 20 | 4,003(0.50%)#57 | 616,016(0.00%)#7,125 |
| 58. | 51466 | 20 | 4,003(0.50%)#58 | 616,016(0.00%)#7,129 |
| 59. | 52804 | 19 | 4,003(0.47%)#59 | 616,016(0.00%)#7,185 |
| 60. | 50211 | 19 | 4,003(0.47%)#60 | 616,016(0.00%)#7,238 |
| 61. | 51601 | 19 | 4,003(0.47%)#61 | 616,016(0.00%)#7,298 |
| 62. | 51243 | 19 | 4,003(0.47%)#62 | 616,016(0.00%)#7,349 |
| 63. | 51534 | 18 | 4,003(0.45%)#63 | 616,016(0.00%)#7,474 |
| 64. | 50109 | 18 | 4,003(0.45%)#64 | 616,016(0.00%)#7,527 |
| 65. | 52064 | 18 | 4,003(0.45%)#65 | 616,016(0.00%)#7,554 |
| 66. | 50124 | 17 | 4,003(0.42%)#66 | 616,016(0.00%)#7,727 |
| 67. | 50701 | 16 | 4,003(0.40%)#67 | 616,016(0.00%)#7,806 |
| 68. | 52233 | 16 | 4,003(0.40%)#68 | 616,016(0.00%)#7,903 |
| 69. | 52361 | 16 | 4,003(0.40%)#69 | 616,016(0.00%)#7,927 |
| 70. | 51106 | 15 | 4,003(0.37%)#70 | 616,016(0.00%)#8,014 |
| 71. | 50311 | 15 | 4,003(0.37%)#71 | 616,016(0.00%)#8,060 |
| 72. | 50126 | 15 | 4,003(0.37%)#72 | 616,016(0.00%)#8,110 |
| 73. | 50436 | 15 | 4,003(0.37%)#73 | 616,016(0.00%)#8,115 |
| 74. | 52043 | 15 | 4,003(0.37%)#74 | 616,016(0.00%)#8,163 |
| 75. | 50268 | 15 | 4,003(0.37%)#75 | 616,016(0.00%)#8,182 |
| 76. | 51401 | 13 | 4,003(0.32%)#76 | 616,016(0.00%)#8,513 |
| 77. | 50604 | 13 | 4,003(0.32%)#77 | 616,016(0.00%)#8,625 |
| 78. | 50002 | 13 | 4,003(0.32%)#78 | 616,016(0.00%)#8,630 |
| 79. | 52726 | 12 | 4,003(0.30%)#79 | 616,016(0.00%)#8,812 |
| 80. | 52227 | 12 | 4,003(0.30%)#80 | 616,016(0.00%)#8,849 |
| 81. | 50115 | 12 | 4,003(0.30%)#81 | 616,016(0.00%)#8,852 |
| 82. | 50665 | 12 | 4,003(0.30%)#82 | 616,016(0.00%)#8,853 |
| 83. | 52659 | 12 | 4,003(0.30%)#83 | 616,016(0.00%)#8,885 |
| 84. | 51461 | 12 | 4,003(0.30%)#84 | 616,016(0.00%)#8,890 |
| 85. | 52405 | 11 | 4,003(0.27%)#85 | 616,016(0.00%)#8,955 |
| 86. | 50220 | 11 | 4,003(0.27%)#86 | 616,016(0.00%)#9,020 |
| 87. | 50316 | 10 | 4,003(0.25%)#87 | 616,016(0.00%)#9,265 |
| 88. | 50112 | 10 | 4,003(0.25%)#88 | 616,016(0.00%)#9,298 |
| 89. | 51537 | 10 | 4,003(0.25%)#89 | 616,016(0.00%)#9,342 |
| 90. | 52340 | 10 | 4,003(0.25%)#90 | 616,016(0.00%)#9,378 |
| 91. | 52301 | 10 | 4,003(0.25%)#91 | 616,016(0.00%)#9,406 |
| 92. | 52338 | 10 | 4,003(0.25%)#92 | 616,016(0.00%)#9,407 |
| 93. | 52162 | 10 | 4,003(0.25%)#93 | 616,016(0.00%)#9,413 |
| 94. | 50466 | 10 | 4,003(0.25%)#94 | 616,016(0.00%)#9,469 |
| 95. | 52352 | 10 | 4,003(0.25%)#95 | 616,016(0.00%)#9,484 |
| 96. | 51575 | 10 | 4,003(0.25%)#96 | 616,016(0.00%)#9,490 |
| 97. | 51436 | 10 | 4,003(0.25%)#97 | 616,016(0.00%)#9,513 |
| 98. | 51503 | 9 | 4,003(0.22%)#98 | 616,016(0.00%)#9,563 |
| 99. | 52577 | 9 | 4,003(0.22%)#99 | 616,016(0.00%)#9,645 |
| 100. | 51250 | 9 | 4,003(0.22%)#100 | 616,016(0.00%)#9,688 |
Common Questions
What are the Top 10 Zip Codes with the Largest Austrian Community in Iowa?
Top 10 Zip Codes with the Largest Austrian Community in Iowa are:
What zip code has the Largest Austrian Community in Iowa?
50313 has the Largest Austrian Community in Iowa with 246.
What is the Total Austrian Population in the State of Iowa?
Total Austrian Population in Iowa is 4,003.
What is the Total Austrian Population in the United States?
Total Austrian Population in the United States is 616,016.