Zip Codes with the Highest Percentage of Population Employed in Arts, Media & Entertainment in Iowa
RELATED REPORTS & OPTIONS
Arts, Media & Entertainment
Iowa
Compare Zip Codes
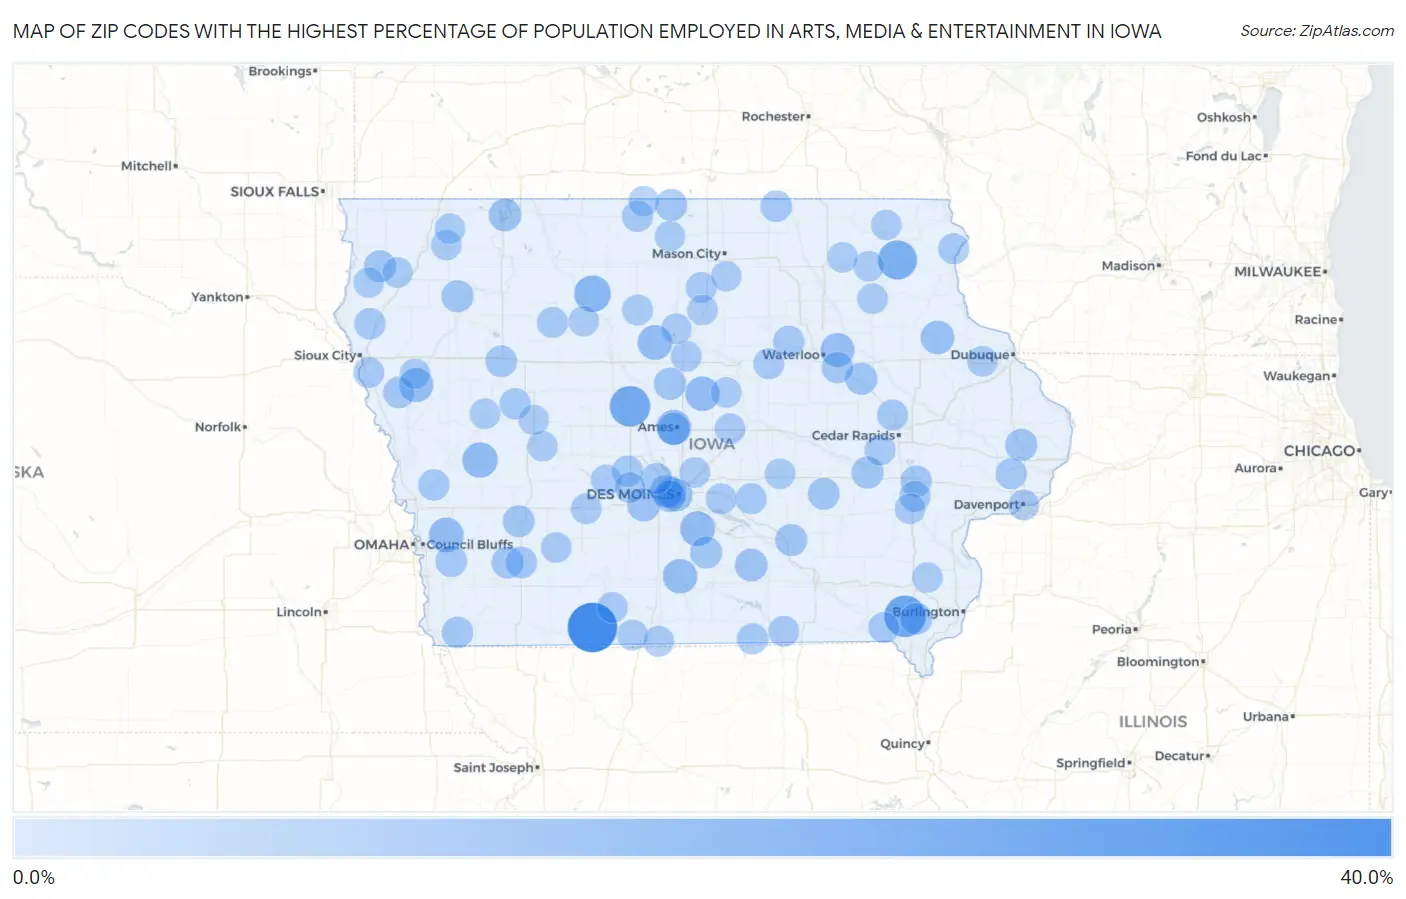
Map of Zip Codes with the Highest Percentage of Population Employed in Arts, Media & Entertainment in Iowa
0.0%
40.0%
Zip Codes with the Highest Percentage of Population Employed in Arts, Media & Entertainment in Iowa
| Zip Code | % Employed | vs State | vs National | |
| 1. | 50835 | 31.6% | 1.5%(+30.1)#1 | 2.1%(+29.5)#38 |
| 2. | 52631 | 19.2% | 1.5%(+17.7)#2 | 2.1%(+17.2)#106 |
| 3. | 50223 | 17.8% | 1.5%(+16.3)#3 | 2.1%(+15.7)#121 |
| 4. | 52133 | 15.6% | 1.5%(+14.1)#4 | 2.1%(+13.6)#154 |
| 5. | 50570 | 11.9% | 1.5%(+10.4)#5 | 2.1%(+9.88)#262 |
| 6. | 51527 | 9.9% | 1.5%(+8.36)#6 | 2.1%(+7.80)#383 |
| 7. | 50012 | 9.6% | 1.5%(+8.08)#7 | 2.1%(+7.52)#405 |
| 8. | 50001 | 9.4% | 1.5%(+7.86)#8 | 2.1%(+7.30)#422 |
| 9. | 50599 | 9.2% | 1.5%(+7.72)#9 | 2.1%(+7.17)#434 |
| 10. | 51548 | 9.1% | 1.5%(+7.62)#10 | 2.1%(+7.07)#441 |
| 11. | 50102 | 8.8% | 1.5%(+7.27)#11 | 2.1%(+6.71)#469 |
| 12. | 50275 | 8.6% | 1.5%(+7.11)#12 | 2.1%(+6.55)#479 |
| 13. | 51044 | 8.3% | 1.5%(+6.83)#13 | 2.1%(+6.27)#511 |
| 14. | 50623 | 7.8% | 1.5%(+6.31)#14 | 2.1%(+5.75)#576 |
| 15. | 52050 | 7.4% | 1.5%(+5.90)#15 | 2.1%(+5.35)#665 |
| 16. | 50038 | 6.3% | 1.5%(+4.80)#16 | 2.1%(+4.25)#927 |
| 17. | 50309 | 6.1% | 1.5%(+4.62)#17 | 2.1%(+4.06)#994 |
| 18. | 51355 | 6.0% | 1.5%(+4.47)#18 | 2.1%(+3.92)#1,038 |
| 19. | 50150 | 5.9% | 1.5%(+4.44)#19 | 2.1%(+3.89)#1,054 |
| 20. | 50324 | 5.9% | 1.5%(+4.41)#20 | 2.1%(+3.86)#1,071 |
| 21. | 50013 | 5.6% | 1.5%(+4.09)#21 | 2.1%(+3.54)#1,198 |
| 22. | 50130 | 5.4% | 1.5%(+3.92)#22 | 2.1%(+3.36)#1,297 |
| 23. | 52210 | 5.4% | 1.5%(+3.91)#23 | 2.1%(+3.36)#1,299 |
| 24. | 52774 | 5.3% | 1.5%(+3.83)#24 | 2.1%(+3.27)#1,333 |
| 25. | 52595 | 5.3% | 1.5%(+3.82)#25 | 2.1%(+3.26)#1,338 |
| 26. | 52334 | 5.2% | 1.5%(+3.72)#26 | 2.1%(+3.16)#1,388 |
| 27. | 51029 | 5.2% | 1.5%(+3.69)#27 | 2.1%(+3.13)#1,403 |
| 28. | 50139 | 5.1% | 1.5%(+3.57)#28 | 2.1%(+3.02)#1,460 |
| 29. | 51250 | 5.0% | 1.5%(+3.45)#29 | 2.1%(+2.89)#1,528 |
| 30. | 50473 | 4.9% | 1.5%(+3.40)#30 | 2.1%(+2.84)#1,560 |
| 31. | 52657 | 4.9% | 1.5%(+3.37)#31 | 2.1%(+2.82)#1,569 |
| 32. | 52222 | 4.8% | 1.5%(+3.30)#32 | 2.1%(+2.74)#1,613 |
| 33. | 51532 | 4.8% | 1.5%(+3.30)#33 | 2.1%(+2.74)#1,614 |
| 34. | 50022 | 4.8% | 1.5%(+3.25)#34 | 2.1%(+2.70)#1,653 |
| 35. | 50311 | 4.6% | 1.5%(+3.12)#35 | 2.1%(+2.56)#1,755 |
| 36. | 50535 | 4.5% | 1.5%(+2.99)#36 | 2.1%(+2.44)#1,852 |
| 37. | 50847 | 4.3% | 1.5%(+2.84)#37 | 2.1%(+2.29)#1,987 |
| 38. | 50312 | 4.3% | 1.5%(+2.84)#38 | 2.1%(+2.28)#1,992 |
| 39. | 51650 | 4.3% | 1.5%(+2.80)#39 | 2.1%(+2.25)#2,027 |
| 40. | 51571 | 4.3% | 1.5%(+2.79)#40 | 2.1%(+2.24)#2,040 |
| 41. | 50476 | 4.3% | 1.5%(+2.79)#41 | 2.1%(+2.24)#2,043 |
| 42. | 50634 | 4.3% | 1.5%(+2.78)#42 | 2.1%(+2.22)#2,058 |
| 43. | 51026 | 4.3% | 1.5%(+2.76)#43 | 2.1%(+2.21)#2,072 |
| 44. | 50111 | 4.2% | 1.5%(+2.67)#44 | 2.1%(+2.11)#2,163 |
| 45. | 52245 | 4.1% | 1.5%(+2.61)#45 | 2.1%(+2.06)#2,232 |
| 46. | 51038 | 4.0% | 1.5%(+2.51)#46 | 2.1%(+1.96)#2,348 |
| 47. | 51546 | 4.0% | 1.5%(+2.48)#47 | 2.1%(+1.92)#2,380 |
| 48. | 50660 | 3.9% | 1.5%(+2.38)#48 | 2.1%(+1.83)#2,512 |
| 49. | 51436 | 3.8% | 1.5%(+2.27)#49 | 2.1%(+1.72)#2,658 |
| 50. | 52746 | 3.8% | 1.5%(+2.27)#50 | 2.1%(+1.72)#2,661 |
| 51. | 50424 | 3.7% | 1.5%(+2.23)#51 | 2.1%(+1.67)#2,718 |
| 52. | 52549 | 3.7% | 1.5%(+2.18)#52 | 2.1%(+1.63)#2,784 |
| 53. | 50574 | 3.7% | 1.5%(+2.15)#53 | 2.1%(+1.59)#2,826 |
| 54. | 50232 | 3.6% | 1.5%(+2.14)#54 | 2.1%(+1.58)#2,840 |
| 55. | 52341 | 3.6% | 1.5%(+2.07)#55 | 2.1%(+1.52)#2,943 |
| 56. | 52146 | 3.6% | 1.5%(+2.06)#56 | 2.1%(+1.51)#2,956 |
| 57. | 50167 | 3.6% | 1.5%(+2.06)#57 | 2.1%(+1.51)#2,959 |
| 58. | 52235 | 3.6% | 1.5%(+2.04)#58 | 2.1%(+1.49)#2,992 |
| 59. | 50146 | 3.5% | 1.5%(+1.99)#59 | 2.1%(+1.44)#3,067 |
| 60. | 52351 | 3.5% | 1.5%(+1.98)#60 | 2.1%(+1.43)#3,082 |
| 61. | 50479 | 3.5% | 1.5%(+1.98)#61 | 2.1%(+1.43)#3,085 |
| 62. | 51054 | 3.5% | 1.5%(+1.97)#62 | 2.1%(+1.42)#3,098 |
| 63. | 50542 | 3.4% | 1.5%(+1.90)#63 | 2.1%(+1.35)#3,216 |
| 64. | 50642 | 3.4% | 1.5%(+1.85)#64 | 2.1%(+1.29)#3,335 |
| 65. | 50140 | 3.3% | 1.5%(+1.84)#65 | 2.1%(+1.29)#3,346 |
| 66. | 52620 | 3.3% | 1.5%(+1.82)#66 | 2.1%(+1.26)#3,387 |
| 67. | 52572 | 3.3% | 1.5%(+1.81)#67 | 2.1%(+1.25)#3,402 |
| 68. | 50863 | 3.2% | 1.5%(+1.72)#68 | 2.1%(+1.16)#3,559 |
| 69. | 50065 | 3.2% | 1.5%(+1.71)#69 | 2.1%(+1.15)#3,585 |
| 70. | 50271 | 3.2% | 1.5%(+1.68)#70 | 2.1%(+1.12)#3,655 |
| 71. | 50228 | 3.2% | 1.5%(+1.66)#71 | 2.1%(+1.11)#3,693 |
| 72. | 52801 | 3.1% | 1.5%(+1.63)#72 | 2.1%(+1.08)#3,764 |
| 73. | 50247 | 3.1% | 1.5%(+1.62)#73 | 2.1%(+1.06)#3,784 |
| 74. | 50164 | 3.1% | 1.5%(+1.62)#74 | 2.1%(+1.06)#3,785 |
| 75. | 52327 | 3.1% | 1.5%(+1.56)#75 | 2.1%(+1.01)#3,925 |
| 76. | 52164 | 3.0% | 1.5%(+1.52)#76 | 2.1%(+0.969)#4,013 |
| 77. | 50003 | 3.0% | 1.5%(+1.51)#77 | 2.1%(+0.957)#4,038 |
| 78. | 50837 | 3.0% | 1.5%(+1.47)#78 | 2.1%(+0.915)#4,147 |
| 79. | 52045 | 3.0% | 1.5%(+1.45)#79 | 2.1%(+0.896)#4,189 |
| 80. | 51248 | 3.0% | 1.5%(+1.45)#80 | 2.1%(+0.896)#4,191 |
| 81. | 51041 | 2.9% | 1.5%(+1.42)#81 | 2.1%(+0.871)#4,256 |
| 82. | 50206 | 2.9% | 1.5%(+1.36)#82 | 2.1%(+0.808)#4,429 |
| 83. | 50112 | 2.9% | 1.5%(+1.36)#83 | 2.1%(+0.806)#4,435 |
| 84. | 50465 | 2.9% | 1.5%(+1.35)#84 | 2.1%(+0.796)#4,456 |
| 85. | 52166 | 2.9% | 1.5%(+1.35)#85 | 2.1%(+0.796)#4,457 |
| 86. | 50101 | 2.9% | 1.5%(+1.35)#86 | 2.1%(+0.796)#4,459 |
| 87. | 51441 | 2.8% | 1.5%(+1.33)#87 | 2.1%(+0.780)#4,498 |
| 88. | 52101 | 2.8% | 1.5%(+1.28)#88 | 2.1%(+0.722)#4,663 |
| 89. | 50469 | 2.8% | 1.5%(+1.27)#89 | 2.1%(+0.713)#4,684 |
| 90. | 50035 | 2.8% | 1.5%(+1.27)#90 | 2.1%(+0.711)#4,694 |
| 91. | 50452 | 2.8% | 1.5%(+1.27)#91 | 2.1%(+0.711)#4,696 |
| 92. | 51350 | 2.8% | 1.5%(+1.26)#92 | 2.1%(+0.704)#4,716 |
| 93. | 51004 | 2.8% | 1.5%(+1.25)#93 | 2.1%(+0.693)#4,750 |
| 94. | 50436 | 2.7% | 1.5%(+1.21)#94 | 2.1%(+0.652)#4,870 |
| 95. | 52154 | 2.7% | 1.5%(+1.20)#95 | 2.1%(+0.649)#4,875 |
| 96. | 51027 | 2.7% | 1.5%(+1.20)#96 | 2.1%(+0.645)#4,882 |
| 97. | 50541 | 2.7% | 1.5%(+1.20)#97 | 2.1%(+0.642)#4,897 |
| 98. | 51440 | 2.7% | 1.5%(+1.20)#98 | 2.1%(+0.642)#4,899 |
| 99. | 52644 | 2.7% | 1.5%(+1.16)#99 | 2.1%(+0.606)#5,013 |
| 100. | 51401 | 2.7% | 1.5%(+1.15)#100 | 2.1%(+0.601)#5,027 |
Common Questions
What are the Top 10 Zip Codes with the Highest Percentage of Population Employed in Arts, Media & Entertainment in Iowa?
Top 10 Zip Codes with the Highest Percentage of Population Employed in Arts, Media & Entertainment in Iowa are:
What zip code has the Highest Percentage of Population Employed in Arts, Media & Entertainment in Iowa?
50835 has the Highest Percentage of Population Employed in Arts, Media & Entertainment in Iowa with 31.6%.
What is the Percentage of Population Employed in Arts, Media & Entertainment in the State of Iowa?
Percentage of Population Employed in Arts, Media & Entertainment in Iowa is 1.5%.
What is the Percentage of Population Employed in Arts, Media & Entertainment in the United States?
Percentage of Population Employed in Arts, Media & Entertainment in the United States is 2.1%.