Zip Codes with the Highest Percentage of Not-for-profit Organizations in Iowa
RELATED REPORTS & OPTIONS
Not-for-profit Organizations
Iowa
Compare Zip Codes
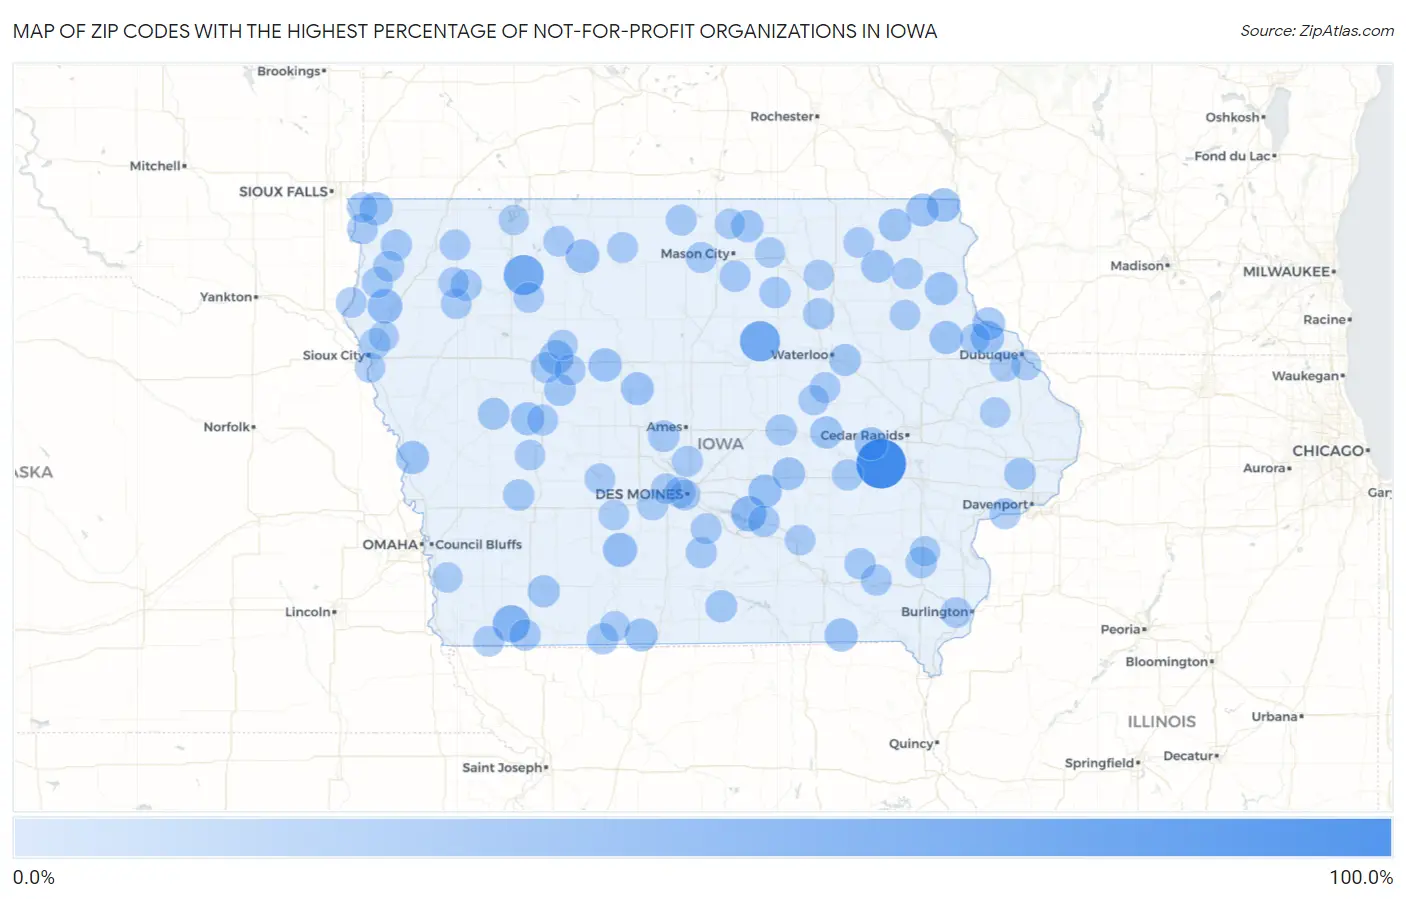
Map of Zip Codes with the Highest Percentage of Not-for-profit Organizations in Iowa
0.0%
100.0%
Zip Codes with the Highest Percentage of Not-for-profit Organizations in Iowa
| Zip Code | % Employed in Not-for-profit | vs State | vs National | |
| 1. | 52307 | 81.2% | 8.8%(+72.5)#1 | 8.4%(+72.8)#45 |
| 2. | 50608 | 47.6% | 8.8%(+38.9)#2 | 8.4%(+39.2)#159 |
| 3. | 51341 | 47.1% | 8.8%(+38.3)#3 | 8.4%(+38.6)#170 |
| 4. | 51656 | 36.4% | 8.8%(+27.6)#4 | 8.4%(+27.9)#296 |
| 5. | 50214 | 29.9% | 8.8%(+21.2)#5 | 8.4%(+21.5)#450 |
| 6. | 51008 | 27.5% | 8.8%(+18.8)#6 | 8.4%(+19.1)#546 |
| 7. | 50551 | 26.7% | 8.8%(+17.9)#7 | 8.4%(+18.2)#593 |
| 8. | 50155 | 25.7% | 8.8%(+16.9)#8 | 8.4%(+17.2)#649 |
| 9. | 50528 | 24.3% | 8.8%(+15.6)#9 | 8.4%(+15.9)#748 |
| 10. | 52160 | 23.8% | 8.8%(+15.1)#10 | 8.4%(+15.4)#796 |
| 11. | 50137 | 23.2% | 8.8%(+14.5)#11 | 8.4%(+14.8)#854 |
| 12. | 52053 | 23.1% | 8.8%(+14.4)#12 | 8.4%(+14.7)#862 |
| 13. | 51545 | 22.8% | 8.8%(+14.0)#13 | 8.4%(+14.3)#905 |
| 14. | 50566 | 22.7% | 8.8%(+14.0)#14 | 8.4%(+14.3)#917 |
| 15. | 51242 | 22.6% | 8.8%(+13.9)#15 | 8.4%(+14.2)#930 |
| 16. | 52584 | 22.6% | 8.8%(+13.8)#16 | 8.4%(+14.2)#934 |
| 17. | 52050 | 22.2% | 8.8%(+13.5)#17 | 8.4%(+13.8)#979 |
| 18. | 51430 | 22.0% | 8.8%(+13.3)#18 | 8.4%(+13.6)#1,004 |
| 19. | 52072 | 22.0% | 8.8%(+13.3)#19 | 8.4%(+13.6)#1,006 |
| 20. | 52354 | 21.7% | 8.8%(+13.0)#20 | 8.4%(+13.3)#1,040 |
| 21. | 50140 | 21.7% | 8.8%(+12.9)#21 | 8.4%(+13.2)#1,054 |
| 22. | 50530 | 21.7% | 8.8%(+12.9)#22 | 8.4%(+13.2)#1,057 |
| 23. | 52166 | 21.4% | 8.8%(+12.7)#23 | 8.4%(+13.0)#1,084 |
| 24. | 52066 | 21.2% | 8.8%(+12.5)#24 | 8.4%(+12.8)#1,117 |
| 25. | 52140 | 21.1% | 8.8%(+12.4)#25 | 8.4%(+12.7)#1,125 |
| 26. | 50112 | 20.9% | 8.8%(+12.2)#26 | 8.4%(+12.5)#1,160 |
| 27. | 52101 | 20.4% | 8.8%(+11.6)#27 | 8.4%(+12.0)#1,225 |
| 28. | 52348 | 19.4% | 8.8%(+10.7)#28 | 8.4%(+11.0)#1,399 |
| 29. | 50440 | 19.2% | 8.8%(+10.5)#29 | 8.4%(+10.8)#1,435 |
| 30. | 50857 | 18.9% | 8.8%(+10.2)#30 | 8.4%(+10.5)#1,507 |
| 31. | 50667 | 18.3% | 8.8%(+9.52)#31 | 8.4%(+9.84)#1,634 |
| 32. | 51449 | 18.2% | 8.8%(+9.44)#32 | 8.4%(+9.76)#1,658 |
| 33. | 50165 | 18.2% | 8.8%(+9.43)#33 | 8.4%(+9.74)#1,670 |
| 34. | 51441 | 17.6% | 8.8%(+8.86)#34 | 8.4%(+9.17)#1,828 |
| 35. | 52746 | 17.4% | 8.8%(+8.67)#35 | 8.4%(+8.99)#1,886 |
| 36. | 52647 | 16.7% | 8.8%(+7.91)#36 | 8.4%(+8.22)#2,158 |
| 37. | 50219 | 16.5% | 8.8%(+7.79)#37 | 8.4%(+8.10)#2,208 |
| 38. | 50152 | 16.5% | 8.8%(+7.71)#38 | 8.4%(+8.03)#2,247 |
| 39. | 51651 | 16.4% | 8.8%(+7.68)#39 | 8.4%(+7.99)#2,261 |
| 40. | 51531 | 16.4% | 8.8%(+7.68)#40 | 8.4%(+7.99)#2,262 |
| 41. | 50860 | 16.4% | 8.8%(+7.61)#41 | 8.4%(+7.92)#2,295 |
| 42. | 50636 | 16.3% | 8.8%(+7.58)#42 | 8.4%(+7.90)#2,298 |
| 43. | 50469 | 16.3% | 8.8%(+7.58)#43 | 8.4%(+7.89)#2,303 |
| 44. | 50677 | 16.2% | 8.8%(+7.42)#44 | 8.4%(+7.73)#2,373 |
| 45. | 51239 | 16.1% | 8.8%(+7.32)#45 | 8.4%(+7.63)#2,417 |
| 46. | 52580 | 15.9% | 8.8%(+7.19)#46 | 8.4%(+7.50)#2,467 |
| 47. | 50145 | 15.9% | 8.8%(+7.15)#47 | 8.4%(+7.46)#2,482 |
| 48. | 52135 | 15.8% | 8.8%(+7.09)#48 | 8.4%(+7.40)#2,508 |
| 49. | 51009 | 15.8% | 8.8%(+7.03)#49 | 8.4%(+7.35)#2,542 |
| 50. | 51027 | 15.6% | 8.8%(+6.80)#50 | 8.4%(+7.11)#2,653 |
| 51. | 52251 | 15.5% | 8.8%(+6.77)#51 | 8.4%(+7.09)#2,666 |
| 52. | 50142 | 15.4% | 8.8%(+6.67)#52 | 8.4%(+6.98)#2,715 |
| 53. | 52556 | 15.4% | 8.8%(+6.64)#53 | 8.4%(+6.95)#2,722 |
| 54. | 50453 | 15.3% | 8.8%(+6.50)#54 | 8.4%(+6.82)#2,794 |
| 55. | 51401 | 15.2% | 8.8%(+6.46)#55 | 8.4%(+6.77)#2,815 |
| 56. | 51250 | 15.1% | 8.8%(+6.38)#56 | 8.4%(+6.69)#2,862 |
| 57. | 50561 | 15.1% | 8.8%(+6.37)#57 | 8.4%(+6.68)#2,867 |
| 58. | 50311 | 15.0% | 8.8%(+6.26)#58 | 8.4%(+6.57)#2,930 |
| 59. | 50482 | 15.0% | 8.8%(+6.23)#59 | 8.4%(+6.54)#2,950 |
| 60. | 52759 | 14.9% | 8.8%(+6.11)#60 | 8.4%(+6.42)#3,022 |
| 61. | 51342 | 14.5% | 8.8%(+5.79)#61 | 8.4%(+6.10)#3,204 |
| 62. | 51248 | 14.5% | 8.8%(+5.75)#62 | 8.4%(+6.06)#3,229 |
| 63. | 50001 | 14.5% | 8.8%(+5.74)#63 | 8.4%(+6.06)#3,235 |
| 64. | 51108 | 14.5% | 8.8%(+5.73)#64 | 8.4%(+6.04)#3,241 |
| 65. | 51240 | 14.5% | 8.8%(+5.72)#65 | 8.4%(+6.03)#3,253 |
| 66. | 50579 | 14.4% | 8.8%(+5.67)#66 | 8.4%(+5.98)#3,291 |
| 67. | 50038 | 14.4% | 8.8%(+5.66)#67 | 8.4%(+5.97)#3,298 |
| 68. | 52068 | 14.4% | 8.8%(+5.61)#68 | 8.4%(+5.92)#3,334 |
| 69. | 50007 | 14.3% | 8.8%(+5.58)#69 | 8.4%(+5.89)#3,347 |
| 70. | 52638 | 14.2% | 8.8%(+5.47)#70 | 8.4%(+5.78)#3,428 |
| 71. | 50606 | 14.1% | 8.8%(+5.34)#71 | 8.4%(+5.65)#3,506 |
| 72. | 52595 | 14.1% | 8.8%(+5.31)#72 | 8.4%(+5.62)#3,530 |
| 73. | 51037 | 14.1% | 8.8%(+5.31)#73 | 8.4%(+5.62)#3,539 |
| 74. | 51647 | 14.0% | 8.8%(+5.28)#74 | 8.4%(+5.59)#3,564 |
| 75. | 50565 | 13.9% | 8.8%(+5.16)#75 | 8.4%(+5.47)#3,660 |
| 76. | 50612 | 13.9% | 8.8%(+5.15)#76 | 8.4%(+5.46)#3,667 |
| 77. | 50309 | 13.9% | 8.8%(+5.14)#77 | 8.4%(+5.45)#3,673 |
| 78. | 50522 | 13.9% | 8.8%(+5.14)#78 | 8.4%(+5.45)#3,674 |
| 79. | 50325 | 13.9% | 8.8%(+5.14)#79 | 8.4%(+5.45)#3,677 |
| 80. | 50216 | 13.8% | 8.8%(+5.00)#80 | 8.4%(+5.31)#3,797 |
| 81. | 51111 | 13.6% | 8.8%(+4.80)#81 | 8.4%(+5.11)#3,960 |
| 82. | 52163 | 13.5% | 8.8%(+4.74)#82 | 8.4%(+5.05)#4,009 |
| 83. | 51046 | 13.4% | 8.8%(+4.65)#83 | 8.4%(+4.97)#4,102 |
| 84. | 51001 | 13.4% | 8.8%(+4.65)#84 | 8.4%(+4.96)#4,111 |
| 85. | 50070 | 13.4% | 8.8%(+4.63)#85 | 8.4%(+4.94)#4,128 |
| 86. | 50110 | 13.3% | 8.8%(+4.58)#86 | 8.4%(+4.89)#4,189 |
| 87. | 50675 | 13.3% | 8.8%(+4.57)#87 | 8.4%(+4.88)#4,194 |
| 88. | 50645 | 13.2% | 8.8%(+4.46)#88 | 8.4%(+4.78)#4,293 |
| 89. | 50575 | 13.1% | 8.8%(+4.37)#89 | 8.4%(+4.68)#4,393 |
| 90. | 52003 | 13.1% | 8.8%(+4.35)#90 | 8.4%(+4.66)#4,414 |
| 91. | 52309 | 13.0% | 8.8%(+4.25)#91 | 8.4%(+4.56)#4,502 |
| 92. | 52056 | 13.0% | 8.8%(+4.24)#92 | 8.4%(+4.56)#4,508 |
| 93. | 51241 | 12.9% | 8.8%(+4.16)#93 | 8.4%(+4.47)#4,579 |
| 94. | 51331 | 12.9% | 8.8%(+4.13)#94 | 8.4%(+4.45)#4,607 |
| 95. | 50854 | 12.9% | 8.8%(+4.12)#95 | 8.4%(+4.43)#4,622 |
| 96. | 51024 | 12.7% | 8.8%(+3.98)#96 | 8.4%(+4.29)#4,791 |
| 97. | 50471 | 12.7% | 8.8%(+3.97)#97 | 8.4%(+4.28)#4,811 |
| 98. | 51534 | 12.6% | 8.8%(+3.88)#98 | 8.4%(+4.19)#4,902 |
| 99. | 52621 | 12.6% | 8.8%(+3.85)#99 | 8.4%(+4.16)#4,933 |
| 100. | 50448 | 12.6% | 8.8%(+3.83)#100 | 8.4%(+4.14)#4,951 |
Common Questions
What are the Top 10 Zip Codes with the Highest Percentage of Not-for-profit Organizations in Iowa?
Top 10 Zip Codes with the Highest Percentage of Not-for-profit Organizations in Iowa are:
What zip code has the Highest Percentage of Not-for-profit Organizations in Iowa?
52307 has the Highest Percentage of Not-for-profit Organizations in Iowa with 81.2%.
What is the Percentage of Not-for-profit Organizations in the State of Iowa?
Percentage of Not-for-profit Organizations in Iowa is 8.8%.
What is the Percentage of Not-for-profit Organizations in the United States?
Percentage of Not-for-profit Organizations in the United States is 8.4%.