Zip Codes with the Highest Percentage of Households Heated by Fuel Oil / Kerosene in Iowa
RELATED REPORTS & OPTIONS
Fuel Oil Heating
Iowa
Compare Zip Codes
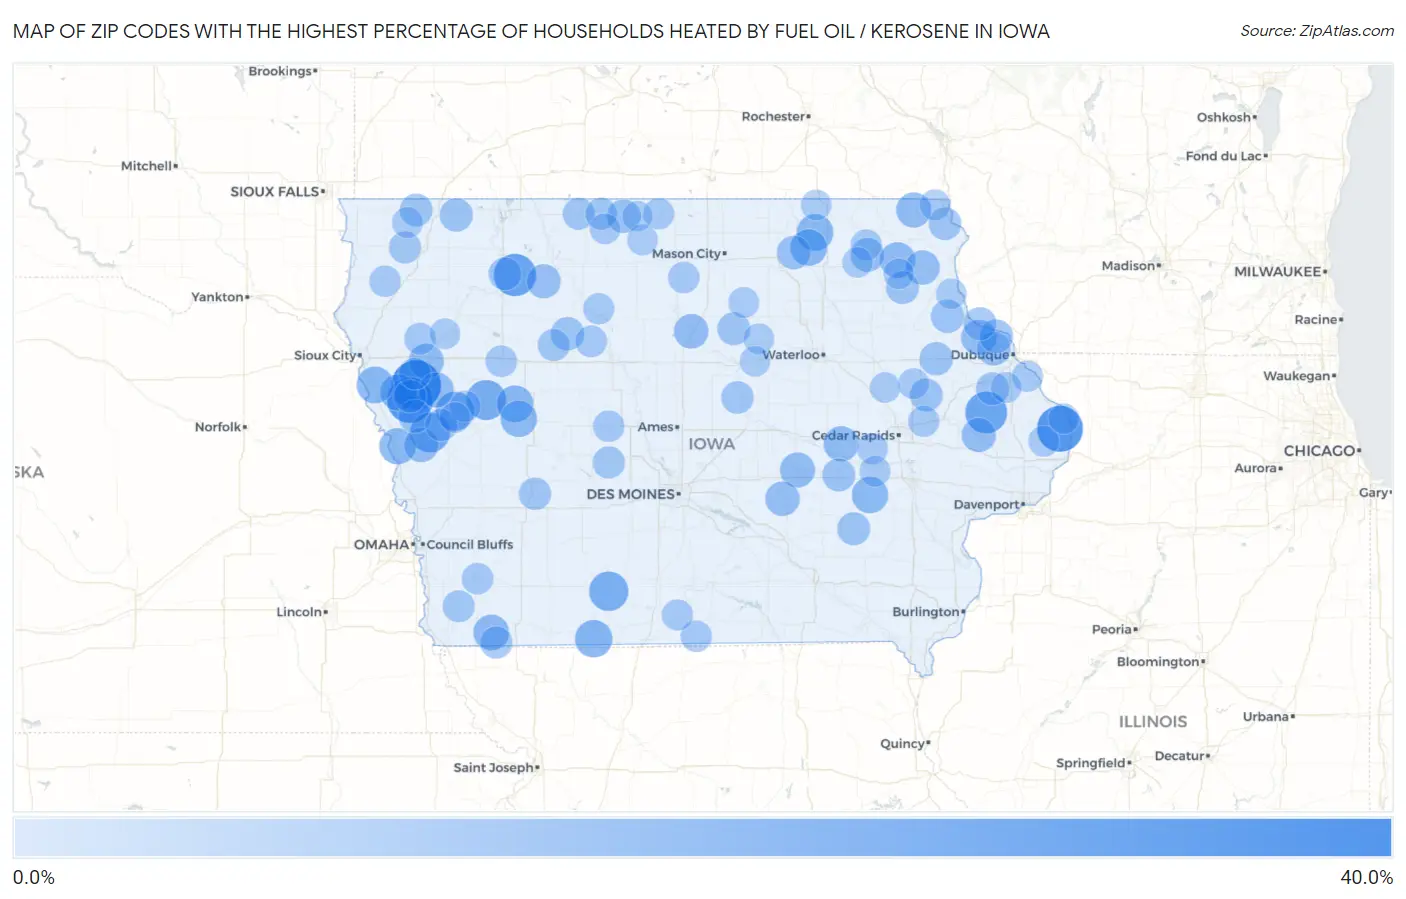
Map of Zip Codes with the Highest Percentage of Households Heated by Fuel Oil / Kerosene in Iowa
0.0%
40.0%
Zip Codes with the Highest Percentage of Households Heated by Fuel Oil / Kerosene in Iowa
| Zip Code | Fuel Oil Heating | vs State | vs National | |
| 1. | 51044 | 32.6% | 0.40%(+32.2)#1 | 4.2%(+28.4)#3,131 |
| 2. | 52771 | 27.0% | 0.40%(+26.6)#2 | 4.2%(+22.8)#3,593 |
| 3. | 51051 | 26.9% | 0.40%(+26.5)#3 | 4.2%(+22.7)#3,601 |
| 4. | 51341 | 21.4% | 0.40%(+21.0)#4 | 4.2%(+17.2)#4,138 |
| 5. | 52309 | 20.6% | 0.40%(+20.2)#5 | 4.2%(+16.4)#4,223 |
| 6. | 51572 | 17.9% | 0.40%(+17.5)#6 | 4.2%(+13.7)#4,539 |
| 7. | 51448 | 17.6% | 0.40%(+17.2)#7 | 4.2%(+13.4)#4,576 |
| 8. | 50831 | 16.7% | 0.40%(+16.3)#8 | 4.2%(+12.5)#4,730 |
| 9. | 51460 | 15.8% | 0.40%(+15.4)#9 | 4.2%(+11.6)#4,874 |
| 10. | 50860 | 13.8% | 0.40%(+13.4)#10 | 4.2%(+9.60)#5,222 |
| 11. | 51026 | 12.8% | 0.40%(+12.4)#11 | 4.2%(+8.60)#5,394 |
| 12. | 51052 | 12.8% | 0.40%(+12.4)#12 | 4.2%(+8.60)#5,395 |
| 13. | 50628 | 12.7% | 0.40%(+12.3)#13 | 4.2%(+8.50)#5,416 |
| 14. | 51436 | 12.7% | 0.40%(+12.3)#14 | 4.2%(+8.50)#5,417 |
| 15. | 50603 | 12.4% | 0.40%(+12.0)#15 | 4.2%(+8.20)#5,501 |
| 16. | 51430 | 12.3% | 0.40%(+11.9)#16 | 4.2%(+8.10)#5,511 |
| 17. | 52325 | 12.2% | 0.40%(+11.8)#17 | 4.2%(+8.00)#5,536 |
| 18. | 51523 | 12.0% | 0.40%(+11.6)#18 | 4.2%(+7.80)#5,585 |
| 19. | 51636 | 11.2% | 0.40%(+10.8)#19 | 4.2%(+7.00)#5,778 |
| 20. | 52133 | 11.1% | 0.40%(+10.7)#20 | 4.2%(+6.90)#5,804 |
| 21. | 52053 | 10.5% | 0.40%(+10.1)#21 | 4.2%(+6.30)#5,947 |
| 22. | 51016 | 10.4% | 0.40%(+10.00)#22 | 4.2%(+6.20)#5,973 |
| 23. | 52257 | 10.4% | 0.40%(+10.00)#23 | 4.2%(+6.20)#5,984 |
| 24. | 50157 | 10.2% | 0.40%(+9.80)#24 | 4.2%(+6.00)#6,025 |
| 25. | 51019 | 10.2% | 0.40%(+9.80)#25 | 4.2%(+6.00)#6,027 |
| 26. | 52140 | 10.2% | 0.40%(+9.80)#26 | 4.2%(+6.00)#6,028 |
| 27. | 50071 | 9.5% | 0.40%(+9.10)#27 | 4.2%(+5.30)#6,218 |
| 28. | 51558 | 9.3% | 0.40%(+8.90)#28 | 4.2%(+5.10)#6,278 |
| 29. | 52156 | 9.3% | 0.40%(+8.90)#29 | 4.2%(+5.10)#6,279 |
| 30. | 50242 | 9.2% | 0.40%(+8.80)#30 | 4.2%(+5.00)#6,311 |
| 31. | 52323 | 8.9% | 0.40%(+8.50)#31 | 4.2%(+4.70)#6,393 |
| 32. | 50527 | 8.7% | 0.40%(+8.30)#32 | 4.2%(+4.50)#6,476 |
| 33. | 52144 | 8.2% | 0.40%(+7.80)#33 | 4.2%(+4.00)#6,646 |
| 34. | 52039 | 8.1% | 0.40%(+7.70)#34 | 4.2%(+3.90)#6,684 |
| 35. | 52073 | 8.0% | 0.40%(+7.60)#35 | 4.2%(+3.80)#6,713 |
| 36. | 50620 | 8.0% | 0.40%(+7.60)#36 | 4.2%(+3.80)#6,732 |
| 37. | 50451 | 7.7% | 0.40%(+7.30)#37 | 4.2%(+3.50)#6,850 |
| 38. | 50571 | 7.6% | 0.40%(+7.20)#38 | 4.2%(+3.40)#6,899 |
| 39. | 52036 | 7.6% | 0.40%(+7.20)#39 | 4.2%(+3.40)#6,903 |
| 40. | 51354 | 7.5% | 0.40%(+7.10)#40 | 4.2%(+3.30)#6,934 |
| 41. | 51010 | 7.5% | 0.40%(+7.10)#41 | 4.2%(+3.30)#6,942 |
| 42. | 52048 | 7.4% | 0.40%(+7.00)#42 | 4.2%(+3.20)#6,979 |
| 43. | 52251 | 7.1% | 0.40%(+6.70)#43 | 4.2%(+2.90)#7,088 |
| 44. | 52231 | 7.1% | 0.40%(+6.70)#44 | 4.2%(+2.90)#7,092 |
| 45. | 52219 | 7.1% | 0.40%(+6.70)#45 | 4.2%(+2.90)#7,101 |
| 46. | 52032 | 7.0% | 0.40%(+6.60)#46 | 4.2%(+2.80)#7,128 |
| 47. | 52141 | 7.0% | 0.40%(+6.60)#47 | 4.2%(+2.80)#7,129 |
| 48. | 52066 | 7.0% | 0.40%(+6.60)#48 | 4.2%(+2.80)#7,142 |
| 49. | 50633 | 6.9% | 0.40%(+6.50)#49 | 4.2%(+2.70)#7,175 |
| 50. | 51343 | 6.8% | 0.40%(+6.40)#50 | 4.2%(+2.60)#7,214 |
| 51. | 51243 | 6.7% | 0.40%(+6.30)#51 | 4.2%(+2.50)#7,264 |
| 52. | 51056 | 6.7% | 0.40%(+6.30)#52 | 4.2%(+2.50)#7,265 |
| 53. | 52151 | 6.5% | 0.40%(+6.10)#53 | 4.2%(+2.30)#7,345 |
| 54. | 50258 | 6.3% | 0.40%(+5.90)#54 | 4.2%(+2.10)#7,453 |
| 55. | 50076 | 6.1% | 0.40%(+5.70)#55 | 4.2%(+1.90)#7,550 |
| 56. | 51060 | 6.0% | 0.40%(+5.60)#56 | 4.2%(+1.80)#7,596 |
| 57. | 51630 | 6.0% | 0.40%(+5.60)#57 | 4.2%(+1.80)#7,602 |
| 58. | 50066 | 5.8% | 0.40%(+5.40)#58 | 4.2%(+1.60)#7,703 |
| 59. | 51234 | 5.7% | 0.40%(+5.30)#59 | 4.2%(+1.50)#7,755 |
| 60. | 50575 | 5.6% | 0.40%(+5.20)#60 | 4.2%(+1.40)#7,811 |
| 61. | 50514 | 5.5% | 0.40%(+5.10)#61 | 4.2%(+1.30)#7,864 |
| 62. | 51004 | 5.4% | 0.40%(+5.00)#62 | 4.2%(+1.20)#7,922 |
| 63. | 50590 | 5.3% | 0.40%(+4.90)#63 | 4.2%(+1.10)#7,976 |
| 64. | 51649 | 5.3% | 0.40%(+4.90)#64 | 4.2%(+1.10)#7,987 |
| 65. | 51048 | 5.2% | 0.40%(+4.80)#65 | 4.2%(+1.00)#8,043 |
| 66. | 50524 | 5.2% | 0.40%(+4.80)#66 | 4.2%(+1.00)#8,044 |
| 67. | 50535 | 4.8% | 0.40%(+4.40)#67 | 4.2%(+0.600)#8,270 |
| 68. | 50449 | 4.8% | 0.40%(+4.40)#68 | 4.2%(+0.600)#8,271 |
| 69. | 51533 | 4.8% | 0.40%(+4.40)#69 | 4.2%(+0.600)#8,273 |
| 70. | 50107 | 4.7% | 0.40%(+4.30)#70 | 4.2%(+0.500)#8,341 |
| 71. | 50052 | 4.7% | 0.40%(+4.30)#71 | 4.2%(+0.500)#8,354 |
| 72. | 51036 | 4.6% | 0.40%(+4.20)#72 | 4.2%(+0.400)#8,419 |
| 73. | 51461 | 4.4% | 0.40%(+4.00)#73 | 4.2%(+0.200)#8,534 |
| 74. | 50478 | 4.3% | 0.40%(+3.90)#74 | 4.2%(+0.100)#8,608 |
| 75. | 50582 | 4.3% | 0.40%(+3.90)#75 | 4.2%(+0.100)#8,622 |
| 76. | 52336 | 4.2% | 0.40%(+3.80)#76 | 4.2%(=0.000)#8,666 |
| 77. | 52168 | 4.2% | 0.40%(+3.80)#77 | 4.2%(=0.000)#8,694 |
| 78. | 50103 | 4.1% | 0.40%(+3.70)#78 | 4.2%(-0.100)#8,776 |
| 79. | 52071 | 4.1% | 0.40%(+3.70)#79 | 4.2%(-0.100)#8,783 |
| 80. | 52318 | 4.0% | 0.40%(+3.60)#80 | 4.2%(-0.200)#8,837 |
| 81. | 51237 | 3.9% | 0.40%(+3.50)#81 | 4.2%(-0.300)#8,886 |
| 82. | 52160 | 3.9% | 0.40%(+3.50)#82 | 4.2%(-0.300)#8,903 |
| 83. | 52750 | 3.9% | 0.40%(+3.50)#83 | 4.2%(-0.300)#8,914 |
| 84. | 52218 | 3.8% | 0.40%(+3.40)#84 | 4.2%(-0.400)#8,987 |
| 85. | 52236 | 3.8% | 0.40%(+3.40)#85 | 4.2%(-0.400)#9,006 |
| 86. | 50484 | 3.8% | 0.40%(+3.40)#86 | 4.2%(-0.400)#9,012 |
| 87. | 50605 | 3.8% | 0.40%(+3.40)#87 | 4.2%(-0.400)#9,017 |
| 88. | 51439 | 3.7% | 0.40%(+3.30)#88 | 4.2%(-0.500)#9,087 |
| 89. | 52079 | 3.7% | 0.40%(+3.30)#89 | 4.2%(-0.500)#9,090 |
| 90. | 50604 | 3.5% | 0.40%(+3.10)#90 | 4.2%(-0.700)#9,256 |
| 91. | 52049 | 3.5% | 0.40%(+3.10)#91 | 4.2%(-0.700)#9,265 |
| 92. | 50517 | 3.5% | 0.40%(+3.10)#92 | 4.2%(-0.700)#9,273 |
| 93. | 52134 | 3.5% | 0.40%(+3.10)#93 | 4.2%(-0.700)#9,283 |
| 94. | 50680 | 3.4% | 0.40%(+3.00)#94 | 4.2%(-0.800)#9,362 |
| 95. | 52135 | 3.4% | 0.40%(+3.00)#95 | 4.2%(-0.800)#9,374 |
| 96. | 51049 | 3.4% | 0.40%(+3.00)#96 | 4.2%(-0.800)#9,379 |
| 97. | 52352 | 3.3% | 0.40%(+2.90)#97 | 4.2%(-0.900)#9,442 |
| 98. | 50424 | 3.3% | 0.40%(+2.90)#98 | 4.2%(-0.900)#9,449 |
| 99. | 52070 | 3.2% | 0.40%(+2.80)#99 | 4.2%(-1.00)#9,542 |
| 100. | 52171 | 3.2% | 0.40%(+2.80)#100 | 4.2%(-1.00)#9,545 |
Common Questions
What are the Top 10 Zip Codes with the Highest Percentage of Households Heated by Fuel Oil / Kerosene in Iowa?
Top 10 Zip Codes with the Highest Percentage of Households Heated by Fuel Oil / Kerosene in Iowa are:
What zip code has the Highest Percentage of Households Heated by Fuel Oil / Kerosene in Iowa?
51044 has the Highest Percentage of Households Heated by Fuel Oil / Kerosene in Iowa with 32.6%.
What is the Percentage of Households Heated by Fuel Oil / Kerosene in the State of Iowa?
Percentage of Households Heated by Fuel Oil / Kerosene in Iowa is 0.40%.
What is the Percentage of Households Heated by Fuel Oil / Kerosene in the United States?
Percentage of Households Heated by Fuel Oil / Kerosene in the United States is 4.2%.