Zip Codes with the Highest Percentage of Population with a Degree in Literature and Languages in Iowa
RELATED REPORTS & OPTIONS
Literature and Languages
Iowa
Compare Zip Codes
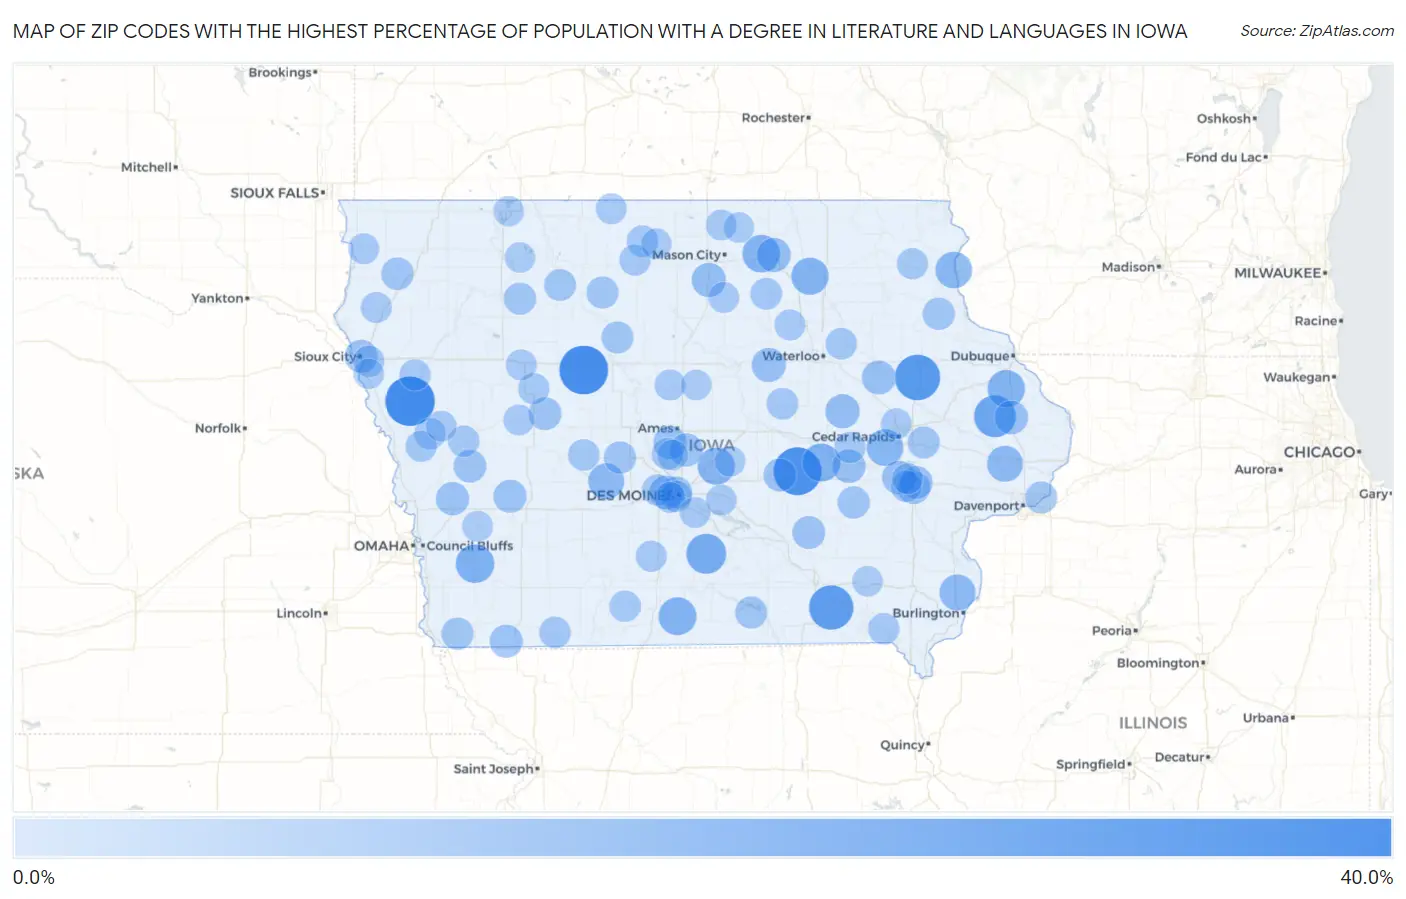
Map of Zip Codes with the Highest Percentage of Population with a Degree in Literature and Languages in Iowa
0.0%
40.0%
Zip Codes with the Highest Percentage of Population with a Degree in Literature and Languages in Iowa
| Zip Code | % Graduates | vs State | vs National | |
| 1. | 51051 | 33.3% | 3.4%(+29.9)#1 | 4.4%(+28.9)#170 |
| 2. | 50586 | 32.1% | 3.4%(+28.7)#2 | 4.4%(+27.7)#183 |
| 3. | 50157 | 30.9% | 3.4%(+27.4)#3 | 4.4%(+26.4)#194 |
| 4. | 52330 | 27.3% | 3.4%(+23.9)#4 | 4.4%(+22.9)#247 |
| 5. | 52560 | 25.8% | 3.4%(+22.3)#5 | 4.4%(+21.3)#286 |
| 6. | 52207 | 22.2% | 3.4%(+18.8)#6 | 4.4%(+17.8)#389 |
| 7. | 50139 | 19.4% | 3.4%(+15.9)#7 | 4.4%(+15.0)#506 |
| 8. | 51541 | 17.3% | 3.4%(+13.9)#8 | 4.4%(+12.9)#613 |
| 9. | 52232 | 16.7% | 3.4%(+13.2)#9 | 4.4%(+12.3)#654 |
| 10. | 50103 | 16.3% | 3.4%(+12.8)#10 | 4.4%(+11.9)#689 |
| 11. | 50471 | 16.1% | 3.4%(+12.7)#11 | 4.4%(+11.7)#706 |
| 12. | 52079 | 15.9% | 3.4%(+12.5)#12 | 4.4%(+11.5)#728 |
| 13. | 50645 | 15.5% | 3.4%(+12.1)#13 | 4.4%(+11.1)#772 |
| 14. | 50168 | 15.4% | 3.4%(+12.0)#14 | 4.4%(+11.0)#778 |
| 15. | 52228 | 14.8% | 3.4%(+11.3)#15 | 4.4%(+10.4)#837 |
| 16. | 52158 | 14.6% | 3.4%(+11.1)#16 | 4.4%(+10.2)#867 |
| 17. | 52650 | 13.8% | 3.4%(+10.3)#17 | 4.4%(+9.38)#943 |
| 18. | 52729 | 13.7% | 3.4%(+10.2)#18 | 4.4%(+9.27)#952 |
| 19. | 50146 | 13.6% | 3.4%(+10.2)#19 | 4.4%(+9.23)#960 |
| 20. | 52229 | 11.1% | 3.4%(+7.66)#20 | 4.4%(+6.70)#1,430 |
| 21. | 50435 | 11.1% | 3.4%(+7.66)#21 | 4.4%(+6.70)#1,434 |
| 22. | 50477 | 11.1% | 3.4%(+7.66)#22 | 4.4%(+6.70)#1,446 |
| 23. | 50642 | 11.0% | 3.4%(+7.53)#23 | 4.4%(+6.57)#1,485 |
| 24. | 50324 | 10.6% | 3.4%(+7.16)#24 | 4.4%(+6.20)#1,596 |
| 25. | 52329 | 10.5% | 3.4%(+7.08)#25 | 4.4%(+6.12)#1,623 |
| 26. | 52060 | 10.3% | 3.4%(+6.89)#26 | 4.4%(+5.93)#1,701 |
| 27. | 52301 | 10.3% | 3.4%(+6.83)#27 | 4.4%(+5.87)#1,718 |
| 28. | 52340 | 10.1% | 3.4%(+6.63)#28 | 4.4%(+5.67)#1,786 |
| 29. | 50134 | 9.9% | 3.4%(+6.41)#29 | 4.4%(+5.45)#1,889 |
| 30. | 51563 | 9.9% | 3.4%(+6.41)#30 | 4.4%(+5.45)#1,890 |
| 31. | 50046 | 9.8% | 3.4%(+6.35)#31 | 4.4%(+5.39)#1,915 |
| 32. | 51531 | 9.6% | 3.4%(+6.13)#32 | 4.4%(+5.17)#2,004 |
| 33. | 51637 | 9.5% | 3.4%(+6.07)#33 | 4.4%(+5.11)#2,034 |
| 34. | 52240 | 9.5% | 3.4%(+6.01)#34 | 4.4%(+5.05)#2,064 |
| 35. | 51101 | 9.4% | 3.4%(+5.97)#35 | 4.4%(+5.01)#2,075 |
| 36. | 50112 | 9.4% | 3.4%(+5.95)#36 | 4.4%(+4.99)#2,087 |
| 37. | 52245 | 9.3% | 3.4%(+5.84)#37 | 4.4%(+4.88)#2,154 |
| 38. | 52586 | 9.3% | 3.4%(+5.81)#38 | 4.4%(+4.85)#2,173 |
| 39. | 51530 | 9.1% | 3.4%(+5.64)#39 | 4.4%(+4.68)#2,269 |
| 40. | 51452 | 9.1% | 3.4%(+5.64)#40 | 4.4%(+4.68)#2,281 |
| 41. | 51041 | 8.8% | 3.4%(+5.35)#41 | 4.4%(+4.39)#2,422 |
| 42. | 50220 | 8.5% | 3.4%(+5.05)#42 | 4.4%(+4.09)#2,613 |
| 43. | 52316 | 8.5% | 3.4%(+5.04)#43 | 4.4%(+4.08)#2,623 |
| 44. | 50565 | 8.3% | 3.4%(+4.88)#44 | 4.4%(+3.92)#2,731 |
| 45. | 52044 | 8.3% | 3.4%(+4.88)#45 | 4.4%(+3.92)#2,733 |
| 46. | 51650 | 8.3% | 3.4%(+4.88)#46 | 4.4%(+3.92)#2,734 |
| 47. | 52314 | 8.2% | 3.4%(+4.70)#47 | 4.4%(+3.74)#2,859 |
| 48. | 52574 | 8.1% | 3.4%(+4.66)#48 | 4.4%(+3.70)#2,894 |
| 49. | 50519 | 8.1% | 3.4%(+4.64)#49 | 4.4%(+3.68)#2,913 |
| 50. | 52767 | 8.1% | 3.4%(+4.64)#50 | 4.4%(+3.68)#2,914 |
| 51. | 50314 | 8.1% | 3.4%(+4.60)#51 | 4.4%(+3.64)#2,943 |
| 52. | 50516 | 8.0% | 3.4%(+4.55)#52 | 4.4%(+3.59)#2,980 |
| 53. | 50562 | 7.9% | 3.4%(+4.45)#53 | 4.4%(+3.49)#3,070 |
| 54. | 50636 | 7.6% | 3.4%(+4.20)#54 | 4.4%(+3.24)#3,309 |
| 55. | 50635 | 7.6% | 3.4%(+4.15)#55 | 4.4%(+3.19)#3,352 |
| 56. | 50833 | 7.5% | 3.4%(+4.09)#56 | 4.4%(+3.13)#3,403 |
| 57. | 50026 | 7.5% | 3.4%(+4.01)#57 | 4.4%(+3.05)#3,485 |
| 58. | 50243 | 7.4% | 3.4%(+3.96)#58 | 4.4%(+3.00)#3,547 |
| 59. | 50484 | 7.4% | 3.4%(+3.96)#59 | 4.4%(+3.00)#3,548 |
| 60. | 50626 | 7.3% | 3.4%(+3.88)#60 | 4.4%(+2.92)#3,630 |
| 61. | 52246 | 7.2% | 3.4%(+3.75)#61 | 4.4%(+2.79)#3,757 |
| 62. | 50309 | 7.2% | 3.4%(+3.73)#62 | 4.4%(+2.77)#3,775 |
| 63. | 51572 | 7.1% | 3.4%(+3.69)#63 | 4.4%(+2.73)#3,820 |
| 64. | 50074 | 7.1% | 3.4%(+3.69)#64 | 4.4%(+2.73)#3,826 |
| 65. | 50325 | 7.1% | 3.4%(+3.66)#65 | 4.4%(+2.70)#3,860 |
| 66. | 50483 | 7.1% | 3.4%(+3.65)#66 | 4.4%(+2.69)#3,874 |
| 67. | 51004 | 7.1% | 3.4%(+3.64)#67 | 4.4%(+2.68)#3,889 |
| 68. | 52620 | 7.1% | 3.4%(+3.61)#68 | 4.4%(+2.65)#3,933 |
| 69. | 51106 | 7.1% | 3.4%(+3.61)#69 | 4.4%(+2.65)#3,938 |
| 70. | 52209 | 7.0% | 3.4%(+3.59)#70 | 4.4%(+2.63)#3,952 |
| 71. | 51528 | 7.0% | 3.4%(+3.59)#71 | 4.4%(+2.63)#3,953 |
| 72. | 51558 | 7.0% | 3.4%(+3.58)#72 | 4.4%(+2.62)#3,967 |
| 73. | 51433 | 7.0% | 3.4%(+3.57)#73 | 4.4%(+2.61)#3,977 |
| 74. | 52162 | 6.8% | 3.4%(+3.34)#74 | 4.4%(+2.38)#4,247 |
| 75. | 50257 | 6.7% | 3.4%(+3.29)#75 | 4.4%(+2.33)#4,315 |
| 76. | 51008 | 6.7% | 3.4%(+3.22)#76 | 4.4%(+2.26)#4,412 |
| 77. | 51247 | 6.6% | 3.4%(+3.12)#77 | 4.4%(+2.16)#4,546 |
| 78. | 50670 | 6.5% | 3.4%(+3.08)#78 | 4.4%(+2.12)#4,602 |
| 79. | 50583 | 6.5% | 3.4%(+3.05)#79 | 4.4%(+2.09)#4,640 |
| 80. | 50475 | 6.5% | 3.4%(+3.04)#80 | 4.4%(+2.08)#4,658 |
| 81. | 50312 | 6.5% | 3.4%(+3.04)#81 | 4.4%(+2.07)#4,664 |
| 82. | 52241 | 6.5% | 3.4%(+3.02)#82 | 4.4%(+2.06)#4,693 |
| 83. | 50244 | 6.5% | 3.4%(+3.01)#83 | 4.4%(+2.05)#4,702 |
| 84. | 50556 | 6.5% | 3.4%(+3.00)#84 | 4.4%(+2.04)#4,721 |
| 85. | 50130 | 6.4% | 3.4%(+2.99)#85 | 4.4%(+2.03)#4,729 |
| 86. | 50047 | 6.4% | 3.4%(+2.94)#86 | 4.4%(+1.98)#4,819 |
| 87. | 51060 | 6.3% | 3.4%(+2.90)#87 | 4.4%(+1.94)#4,859 |
| 88. | 50448 | 6.3% | 3.4%(+2.88)#88 | 4.4%(+1.92)#4,892 |
| 89. | 50228 | 6.3% | 3.4%(+2.81)#89 | 4.4%(+1.85)#4,994 |
| 90. | 51430 | 6.2% | 3.4%(+2.80)#90 | 4.4%(+1.84)#5,009 |
| 91. | 50432 | 6.2% | 3.4%(+2.80)#91 | 4.4%(+1.84)#5,022 |
| 92. | 52233 | 6.2% | 3.4%(+2.74)#92 | 4.4%(+1.78)#5,108 |
| 93. | 51536 | 6.2% | 3.4%(+2.70)#93 | 4.4%(+1.74)#5,169 |
| 94. | 50440 | 6.2% | 3.4%(+2.70)#94 | 4.4%(+1.74)#5,170 |
| 95. | 52556 | 6.1% | 3.4%(+2.68)#95 | 4.4%(+1.71)#5,223 |
| 96. | 50028 | 6.1% | 3.4%(+2.62)#96 | 4.4%(+1.66)#5,314 |
| 97. | 50230 | 5.9% | 3.4%(+2.48)#97 | 4.4%(+1.52)#5,532 |
| 98. | 51054 | 5.9% | 3.4%(+2.46)#98 | 4.4%(+1.50)#5,584 |
| 99. | 51360 | 5.9% | 3.4%(+2.44)#99 | 4.4%(+1.48)#5,609 |
| 100. | 51333 | 5.9% | 3.4%(+2.43)#100 | 4.4%(+1.47)#5,636 |
Common Questions
What are the Top 10 Zip Codes with the Highest Percentage of Population with a Degree in Literature and Languages in Iowa?
Top 10 Zip Codes with the Highest Percentage of Population with a Degree in Literature and Languages in Iowa are:
What zip code has the Highest Percentage of Population with a Degree in Literature and Languages in Iowa?
51051 has the Highest Percentage of Population with a Degree in Literature and Languages in Iowa with 33.3%.
What is the Percentage of Population with a Degree in Literature and Languages in the State of Iowa?
Percentage of Population with a Degree in Literature and Languages in Iowa is 3.4%.
What is the Percentage of Population with a Degree in Literature and Languages in the United States?
Percentage of Population with a Degree in Literature and Languages in the United States is 4.4%.