Zip Codes with the Highest Percentage of Population with a Degree in Liberal Arts and History in Iowa
RELATED REPORTS & OPTIONS
Liberal Arts and History
Iowa
Compare Zip Codes
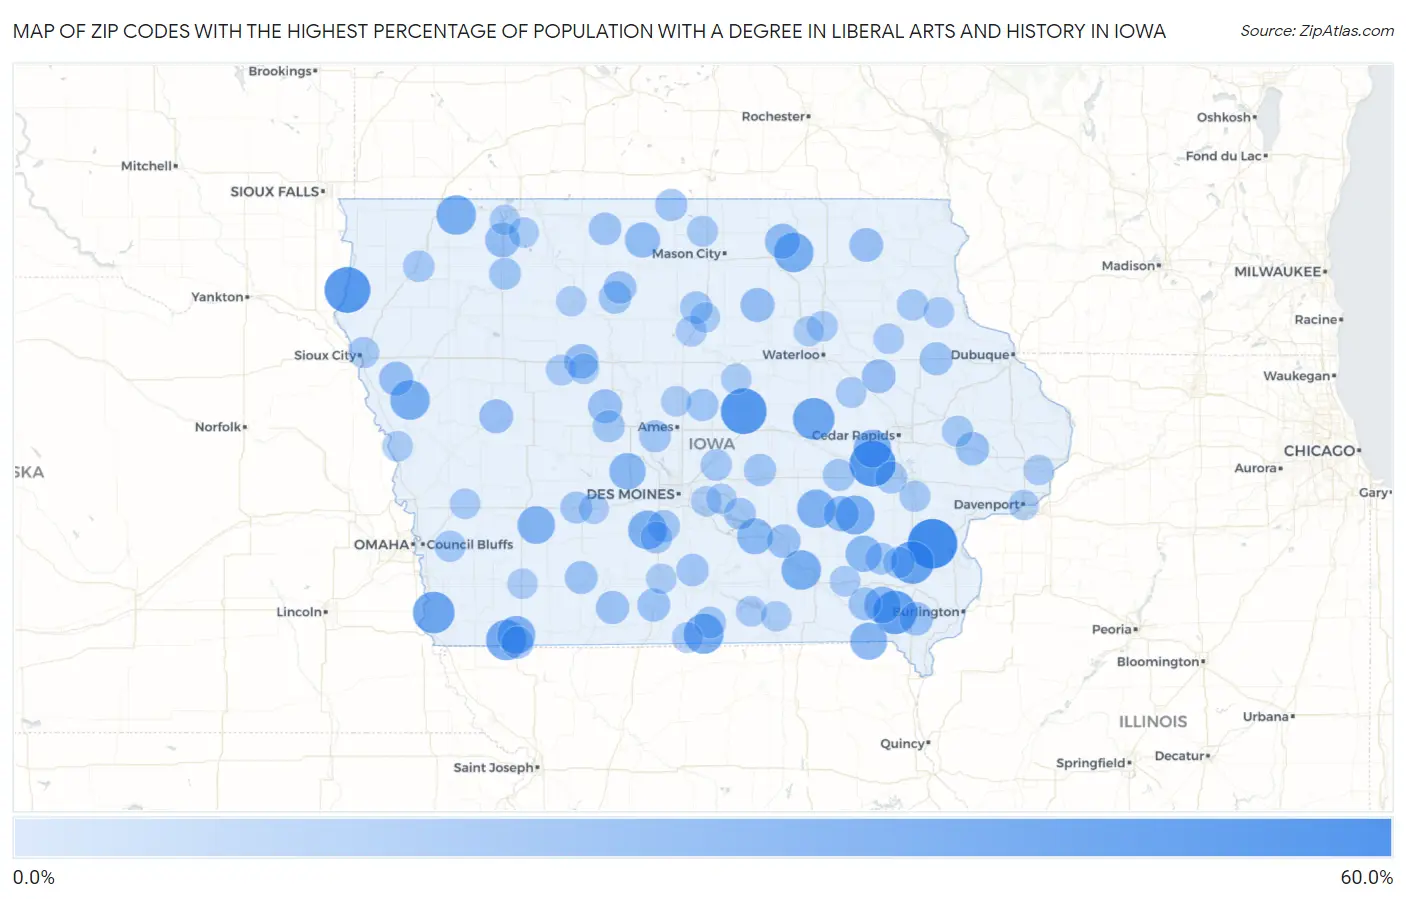
Map of Zip Codes with the Highest Percentage of Population with a Degree in Liberal Arts and History in Iowa
0.0%
60.0%
Zip Codes with the Highest Percentage of Population with a Degree in Liberal Arts and History in Iowa
| Zip Code | % Graduates | vs State | vs National | |
| 1. | 52737 | 60.0% | 4.5%(+55.5)#1 | 4.9%(+55.1)#102 |
| 2. | 50005 | 50.0% | 4.5%(+45.5)#2 | 4.9%(+45.1)#147 |
| 3. | 51011 | 50.0% | 4.5%(+45.5)#3 | 4.9%(+45.1)#166 |
| 4. | 52307 | 50.0% | 4.5%(+45.5)#4 | 4.9%(+45.1)#172 |
| 5. | 52630 | 43.8% | 4.5%(+39.2)#5 | 4.9%(+38.9)#212 |
| 6. | 52647 | 41.7% | 4.5%(+37.2)#6 | 4.9%(+36.8)#235 |
| 7. | 52217 | 39.1% | 4.5%(+34.6)#7 | 4.9%(+34.2)#261 |
| 8. | 51654 | 39.1% | 4.5%(+34.6)#8 | 4.9%(+34.2)#262 |
| 9. | 51637 | 35.7% | 4.5%(+31.2)#9 | 4.9%(+30.8)#305 |
| 10. | 50008 | 34.5% | 4.5%(+30.0)#10 | 4.9%(+29.7)#324 |
| 11. | 51354 | 33.3% | 4.5%(+28.8)#11 | 4.9%(+28.5)#339 |
| 12. | 52548 | 33.3% | 4.5%(+28.8)#12 | 4.9%(+28.5)#358 |
| 13. | 51051 | 33.3% | 4.5%(+28.8)#13 | 4.9%(+28.5)#359 |
| 14. | 50620 | 33.3% | 4.5%(+28.8)#14 | 4.9%(+28.5)#360 |
| 15. | 52335 | 32.5% | 4.5%(+28.0)#15 | 4.9%(+27.6)#369 |
| 16. | 50218 | 31.2% | 4.5%(+26.7)#16 | 4.9%(+26.4)#397 |
| 17. | 50104 | 30.0% | 4.5%(+25.5)#17 | 4.9%(+25.1)#421 |
| 18. | 51651 | 29.4% | 4.5%(+24.9)#18 | 4.9%(+24.5)#432 |
| 19. | 52318 | 29.2% | 4.5%(+24.7)#19 | 4.9%(+24.3)#438 |
| 20. | 50274 | 28.6% | 4.5%(+24.1)#20 | 4.9%(+23.7)#451 |
| 21. | 52573 | 26.9% | 4.5%(+22.4)#21 | 4.9%(+22.1)#504 |
| 22. | 52651 | 26.1% | 4.5%(+21.6)#22 | 4.9%(+21.2)#535 |
| 23. | 50167 | 25.5% | 4.5%(+21.0)#23 | 4.9%(+20.6)#554 |
| 24. | 52585 | 25.2% | 4.5%(+20.7)#24 | 4.9%(+20.3)#564 |
| 25. | 50119 | 24.4% | 4.5%(+19.9)#25 | 4.9%(+19.6)#612 |
| 26. | 50484 | 22.2% | 4.5%(+17.7)#26 | 4.9%(+17.4)#722 |
| 27. | 52355 | 22.2% | 4.5%(+17.7)#27 | 4.9%(+17.4)#723 |
| 28. | 50460 | 22.0% | 4.5%(+17.5)#28 | 4.9%(+17.1)#739 |
| 29. | 51340 | 20.7% | 4.5%(+16.2)#29 | 4.9%(+15.8)#818 |
| 30. | 50552 | 20.0% | 4.5%(+15.5)#30 | 4.9%(+15.1)#870 |
| 31. | 51015 | 20.0% | 4.5%(+15.5)#31 | 4.9%(+15.1)#871 |
| 32. | 50611 | 19.4% | 4.5%(+14.8)#32 | 4.9%(+14.5)#912 |
| 33. | 51465 | 19.0% | 4.5%(+14.5)#33 | 4.9%(+14.1)#935 |
| 34. | 50217 | 19.0% | 4.5%(+14.5)#34 | 4.9%(+14.1)#937 |
| 35. | 52329 | 18.8% | 4.5%(+14.3)#35 | 4.9%(+13.9)#952 |
| 36. | 52168 | 18.8% | 4.5%(+14.2)#36 | 4.9%(+13.9)#955 |
| 37. | 52534 | 18.2% | 4.5%(+13.7)#37 | 4.9%(+13.3)#1,010 |
| 38. | 52657 | 18.2% | 4.5%(+13.7)#38 | 4.9%(+13.3)#1,019 |
| 39. | 52216 | 17.4% | 4.5%(+12.9)#39 | 4.9%(+12.5)#1,090 |
| 40. | 50863 | 17.3% | 4.5%(+12.8)#40 | 4.9%(+12.4)#1,104 |
| 41. | 50262 | 16.7% | 4.5%(+12.2)#41 | 4.9%(+11.8)#1,171 |
| 42. | 52036 | 16.7% | 4.5%(+12.2)#42 | 4.9%(+11.8)#1,173 |
| 43. | 50842 | 16.7% | 4.5%(+12.2)#43 | 4.9%(+11.8)#1,178 |
| 44. | 52535 | 16.1% | 4.5%(+11.6)#44 | 4.9%(+11.2)#1,245 |
| 45. | 50517 | 15.4% | 4.5%(+10.9)#45 | 4.9%(+10.5)#1,343 |
| 46. | 50558 | 15.4% | 4.5%(+10.9)#46 | 4.9%(+10.5)#1,345 |
| 47. | 50560 | 15.4% | 4.5%(+10.9)#47 | 4.9%(+10.5)#1,346 |
| 48. | 51631 | 15.4% | 4.5%(+10.9)#48 | 4.9%(+10.5)#1,352 |
| 49. | 50151 | 15.2% | 4.5%(+10.7)#49 | 4.9%(+10.3)#1,386 |
| 50. | 50135 | 15.1% | 4.5%(+10.6)#50 | 4.9%(+10.2)#1,403 |
| 51. | 50420 | 14.9% | 4.5%(+10.3)#51 | 4.9%(+9.98)#1,449 |
| 52. | 50160 | 14.8% | 4.5%(+10.3)#52 | 4.9%(+9.94)#1,459 |
| 53. | 50154 | 14.5% | 4.5%(+10.0)#53 | 4.9%(+9.67)#1,515 |
| 54. | 50473 | 14.5% | 4.5%(+9.98)#54 | 4.9%(+9.62)#1,526 |
| 55. | 52322 | 14.3% | 4.5%(+9.80)#55 | 4.9%(+9.44)#1,553 |
| 56. | 52251 | 14.3% | 4.5%(+9.77)#56 | 4.9%(+9.41)#1,572 |
| 57. | 50152 | 14.3% | 4.5%(+9.77)#57 | 4.9%(+9.41)#1,585 |
| 58. | 50107 | 14.1% | 4.5%(+9.57)#58 | 4.9%(+9.21)#1,619 |
| 59. | 50240 | 13.9% | 4.5%(+9.36)#59 | 4.9%(+9.00)#1,663 |
| 60. | 50048 | 13.7% | 4.5%(+9.16)#60 | 4.9%(+8.80)#1,714 |
| 61. | 51343 | 13.6% | 4.5%(+9.12)#61 | 4.9%(+8.76)#1,731 |
| 62. | 50060 | 13.6% | 4.5%(+9.06)#62 | 4.9%(+8.70)#1,747 |
| 63. | 52540 | 13.5% | 4.5%(+9.02)#63 | 4.9%(+8.66)#1,757 |
| 64. | 50214 | 13.5% | 4.5%(+8.95)#64 | 4.9%(+8.59)#1,778 |
| 65. | 50168 | 13.0% | 4.5%(+8.45)#65 | 4.9%(+8.09)#1,916 |
| 66. | 51238 | 12.6% | 4.5%(+8.05)#66 | 4.9%(+7.69)#2,022 |
| 67. | 51575 | 12.6% | 4.5%(+8.05)#67 | 4.9%(+7.69)#2,024 |
| 68. | 52654 | 12.5% | 4.5%(+8.03)#68 | 4.9%(+7.67)#2,027 |
| 69. | 52077 | 12.2% | 4.5%(+7.68)#69 | 4.9%(+7.32)#2,141 |
| 70. | 52320 | 12.0% | 4.5%(+7.49)#70 | 4.9%(+7.13)#2,207 |
| 71. | 51105 | 11.7% | 4.5%(+7.20)#71 | 4.9%(+6.85)#2,294 |
| 72. | 52235 | 11.7% | 4.5%(+7.20)#72 | 4.9%(+6.84)#2,295 |
| 73. | 50444 | 11.5% | 4.5%(+7.03)#73 | 4.9%(+6.67)#2,349 |
| 74. | 50147 | 11.1% | 4.5%(+6.60)#74 | 4.9%(+6.24)#2,515 |
| 75. | 50579 | 11.1% | 4.5%(+6.55)#75 | 4.9%(+6.19)#2,532 |
| 76. | 52574 | 10.8% | 4.5%(+6.30)#76 | 4.9%(+5.94)#2,643 |
| 77. | 52533 | 10.7% | 4.5%(+6.23)#77 | 4.9%(+5.87)#2,666 |
| 78. | 50586 | 10.7% | 4.5%(+6.20)#78 | 4.9%(+5.84)#2,689 |
| 79. | 50071 | 10.7% | 4.5%(+6.17)#79 | 4.9%(+5.81)#2,706 |
| 80. | 50607 | 10.6% | 4.5%(+6.09)#80 | 4.9%(+5.73)#2,762 |
| 81. | 52313 | 10.5% | 4.5%(+6.01)#81 | 4.9%(+5.65)#2,804 |
| 82. | 50622 | 10.5% | 4.5%(+6.00)#82 | 4.9%(+5.64)#2,814 |
| 83. | 52044 | 10.4% | 4.5%(+5.90)#83 | 4.9%(+5.54)#2,857 |
| 84. | 51570 | 10.4% | 4.5%(+5.89)#84 | 4.9%(+5.53)#2,864 |
| 85. | 51523 | 10.3% | 4.5%(+5.83)#85 | 4.9%(+5.47)#2,896 |
| 86. | 52593 | 10.3% | 4.5%(+5.83)#86 | 4.9%(+5.47)#2,898 |
| 87. | 50627 | 10.3% | 4.5%(+5.83)#87 | 4.9%(+5.47)#2,900 |
| 88. | 50237 | 10.3% | 4.5%(+5.80)#88 | 4.9%(+5.44)#2,922 |
| 89. | 51331 | 10.3% | 4.5%(+5.80)#89 | 4.9%(+5.44)#2,925 |
| 90. | 50248 | 10.2% | 4.5%(+5.69)#90 | 4.9%(+5.33)#2,994 |
| 91. | 50864 | 10.2% | 4.5%(+5.64)#91 | 4.9%(+5.28)#3,025 |
| 92. | 51364 | 10.1% | 4.5%(+5.60)#92 | 4.9%(+5.24)#3,053 |
| 93. | 52758 | 10.0% | 4.5%(+5.49)#93 | 4.9%(+5.13)#3,120 |
| 94. | 50431 | 10.0% | 4.5%(+5.49)#94 | 4.9%(+5.13)#3,123 |
| 95. | 50228 | 10.0% | 4.5%(+5.45)#95 | 4.9%(+5.09)#3,139 |
| 96. | 50213 | 9.9% | 4.5%(+5.42)#96 | 4.9%(+5.06)#3,145 |
| 97. | 52801 | 9.9% | 4.5%(+5.39)#97 | 4.9%(+5.03)#3,164 |
| 98. | 50581 | 9.9% | 4.5%(+5.35)#98 | 4.9%(+4.99)#3,188 |
| 99. | 50250 | 9.8% | 4.5%(+5.33)#99 | 4.9%(+4.97)#3,202 |
| 100. | 50647 | 9.8% | 4.5%(+5.31)#100 | 4.9%(+4.95)#3,223 |
Common Questions
What are the Top 10 Zip Codes with the Highest Percentage of Population with a Degree in Liberal Arts and History in Iowa?
Top 10 Zip Codes with the Highest Percentage of Population with a Degree in Liberal Arts and History in Iowa are:
What zip code has the Highest Percentage of Population with a Degree in Liberal Arts and History in Iowa?
52737 has the Highest Percentage of Population with a Degree in Liberal Arts and History in Iowa with 60.0%.
What is the Percentage of Population with a Degree in Liberal Arts and History in the State of Iowa?
Percentage of Population with a Degree in Liberal Arts and History in Iowa is 4.5%.
What is the Percentage of Population with a Degree in Liberal Arts and History in the United States?
Percentage of Population with a Degree in Liberal Arts and History in the United States is 4.9%.