Zip Codes with the Largest Sudanese Community in Iowa

RELATED REPORTS & OPTIONS

Sudanese
Population
Families and Households
Female Fertility
Female Fertility (Unmarried)
Race (Community Size)
Race (Percentage)
Ancestry (Community Size)
AfghanAfricanAlaska NativeAlaskan AthabascanAlbanianAleutAlsatianAmericanApacheArabArapahoArgentineanArmenianAssyrian / Chaldean / SyriacAustralianAustrianBahamianBangladeshiBarbadianBasqueBelgianBelizeanBermudanBhutaneseBlackfeetBolivianBrazilianBritishBritish West IndianBulgarianBurmeseCajunCambodianCanadianCape VerdeanCarpatho RusynCelticCentral AmericanCentral American IndianCherokeeCheyenneChickasawChileanChineseChippewaChoctawColombianColvilleComancheCosta RicanCreeCreekCroatianCrowCubanCypriotCzechCzechoslovakianDanishDelawareDominicanDutchDutch West IndianEastern EuropeanEcuadorianEgyptianEnglishEstonianEthiopianEuropeanFijianFilipinoFinnishFrenchFrench American IndianFrench CanadianGermanGerman RussianGhanaianGreekGuamanian / ChamorroGuatemalanGuyaneseHaitianHmongHonduranHopiHoumaHungarianIcelanderIndian (Asian)IndonesianInupiatIranianIraqiIrishIroquoisIsraeliItalianJamaicanJapaneseJordanianKenyanKiowaKoreanLaotianLatvianLebaneseLiberianLithuanianLumbeeLuxembourgerMacedonianMalaysianMalteseMarshalleseMenomineeMexicanMexican American IndianMongolianMoroccanNative HawaiianNavajoNepaleseNew ZealanderNicaraguanNigerianNorthern EuropeanNorwegianOkinawanOsageOttawaPaiutePakistaniPalestinianPanamanianParaguayanPennsylvania GermanPeruvianPimaPolishPortuguesePotawatomiPuebloPuerto RicanPuget Sound SalishRomanianRussianSalvadoranSamoanScandinavianScotch-IrishScottishSeminoleSenegaleseSerbianShoshoneSierra LeoneanSiouxSlavicSlovakSloveneSomaliSouth AfricanSouth AmericanSouth American IndianSoviet UnionSpaniardSpanishSpanish AmericanSpanish American IndianSri LankanSubsaharan AfricanSudaneseSwedishSwissSyrianTaiwaneseThaiTlingit-HaidaTohono O'OdhamTonganTrinidadian and TobagonianTsimshianTurkishU.S. Virgin IslanderUgandanUkrainianUruguayanUteVenezuelanVietnameseWelshWest IndianYakamaYaquiYugoslavianYumanYup'ikZimbabwean
Ancestry (Percentage)
AfghanAfricanAlaska NativeAlaskan AthabascanAlbanianAleutAlsatianAmericanApacheArabArapahoArgentineanArmenianAssyrian / Chaldean / SyriacAustralianAustrianBahamianBangladeshiBarbadianBasqueBelgianBelizeanBermudanBhutaneseBlackfeetBolivianBrazilianBritishBritish West IndianBulgarianBurmeseCajunCambodianCanadianCape VerdeanCarpatho RusynCelticCentral AmericanCentral American IndianCherokeeCheyenneChickasawChileanChineseChippewaChoctawColombianColvilleComancheCosta RicanCreeCreekCroatianCrowCubanCypriotCzechCzechoslovakianDanishDelawareDominicanDutchDutch West IndianEastern EuropeanEcuadorianEgyptianEnglishEstonianEthiopianEuropeanFijianFilipinoFinnishFrenchFrench American IndianFrench CanadianGermanGerman RussianGhanaianGreekGuamanian / ChamorroGuatemalanGuyaneseHaitianHmongHonduranHopiHoumaHungarianIcelanderIndian (Asian)IndonesianInupiatIranianIraqiIrishIroquoisIsraeliItalianJamaicanJapaneseJordanianKenyanKiowaKoreanLaotianLatvianLebaneseLiberianLithuanianLumbeeLuxembourgerMacedonianMalaysianMalteseMarshalleseMenomineeMexicanMexican American IndianMongolianMoroccanNative HawaiianNavajoNepaleseNew ZealanderNicaraguanNigerianNorthern EuropeanNorwegianOkinawanOsageOttawaPaiutePakistaniPalestinianPanamanianParaguayanPennsylvania GermanPeruvianPimaPolishPortuguesePotawatomiPuebloPuerto RicanPuget Sound SalishRomanianRussianSalvadoranSamoanScandinavianScotch-IrishScottishSeminoleSenegaleseSerbianShoshoneSierra LeoneanSiouxSlavicSlovakSloveneSomaliSouth AfricanSouth AmericanSouth American IndianSoviet UnionSpaniardSpanishSpanish AmericanSpanish American IndianSri LankanSubsaharan AfricanSudaneseSwedishSwissSyrianTaiwaneseThaiTlingit-HaidaTohono O'OdhamTonganTrinidadian and TobagonianTsimshianTurkishU.S. Virgin IslanderUgandanUkrainianUruguayanUteVenezuelanVietnameseWelshWest IndianYakamaYaquiYugoslavianYumanYup'ikZimbabwean
Immigrant Origin (Total)
AfghanistanAfricaAlbaniaArgentinaArmeniaAsiaAustraliaAustriaAzoresBahamasBangladeshBarbadosBelarusBelgiumBelizeBoliviaBosnia and HerzegovinaBrazilBulgariaBurma / MyanmarCabo VerdeCambodiaCameroonCanadaCaribbeanCentral AmericaChileChinaColombiaCongoCosta RicaCroatiaCubaCzechoslovakiaDenmarkDominicaDominican RepublicEastern AfricaEastern AsiaEastern EuropeEcuadorEgyptEl SalvadorEnglandEritreaEthiopiaEuropeFijiFranceGermanyGhanaGreeceGrenadaGuatemalaGuyanaHaitiHondurasHong KongHungaryIndiaIndonesiaIranIraqIrelandIsraelItalyJamaicaJapanJordanKazakhstanKenyaKoreaKuwaitLaosLatin AmericaLatviaLebanonLiberiaLithuaniaMalaysiaMexicoMicronesiaMiddle AfricaMoldovaMoroccoNepalNetherlandsNicaraguaNigeriaNorth MacedoniaNorthern AfricaNorthern EuropeNorwayOceaniaPakistanPanamaPeruPhilippinesPolandPortugalRomaniaRussiaSaudi ArabiaScotlandSenegalSerbiaSierra LeoneSingaporeSomaliaSouth AfricaSouth AmericaSouth Central AsiaSouth Eastern AsiaSouthern EuropeSpainSri LankaSt. Vincent and the GrenadinesSudanSwedenSwitzerlandSyriaTaiwanThailandTrinidad and TobagoTurkeyUgandaUkraineUruguayUzbekistanVenezuelaVietnamWest IndiesWestern AfricaWestern AsiaWestern EuropeYemenZaireZimbabwe
Immigrant Origin (Percentage)
AfghanistanAfricaAlbaniaArgentinaArmeniaAsiaAustraliaAustriaAzoresBahamasBangladeshBarbadosBelarusBelgiumBelizeBoliviaBosnia and HerzegovinaBrazilBulgariaBurma / MyanmarCabo VerdeCambodiaCameroonCanadaCaribbeanCentral AmericaChileChinaColombiaCongoCosta RicaCroatiaCubaCzechoslovakiaDenmarkDominicaDominican RepublicEastern AfricaEastern AsiaEastern EuropeEcuadorEgyptEl SalvadorEnglandEritreaEthiopiaEuropeFijiFranceGermanyGhanaGreeceGrenadaGuatemalaGuyanaHaitiHondurasHong KongHungaryIndiaIndonesiaIranIraqIrelandIsraelItalyJamaicaJapanJordanKazakhstanKenyaKoreaKuwaitLaosLatin AmericaLatviaLebanonLiberiaLithuaniaMalaysiaMexicoMicronesiaMiddle AfricaMoldovaMoroccoNepalNetherlandsNicaraguaNigeriaNorth MacedoniaNorthern AfricaNorthern EuropeNorwayOceaniaPakistanPanamaPeruPhilippinesPolandPortugalRomaniaRussiaSaudi ArabiaScotlandSenegalSerbiaSierra LeoneSingaporeSomaliaSouth AfricaSouth AmericaSouth Central AsiaSouth Eastern AsiaSouthern EuropeSpainSri LankaSt. Vincent and the GrenadinesSudanSwedenSwitzerlandSyriaTaiwanThailandTrinidad and TobagoTurkeyUgandaUkraineUruguayUzbekistanVenezuelaVietnamWest IndiesWestern AfricaWestern AsiaWestern EuropeYemenZaireZimbabwe
Income
Income (Families)
Income (Households)
Poverty
Poverty (Families)
Unemployment
Employment Occupations
Employment Industries
Employer Class
Commute Time
Commute Means
School Enrollment
Education by Degree Field
Occupancy
Finances
Physical Characteristics
Iowa
Compare Zip Codes
Comparison Subject

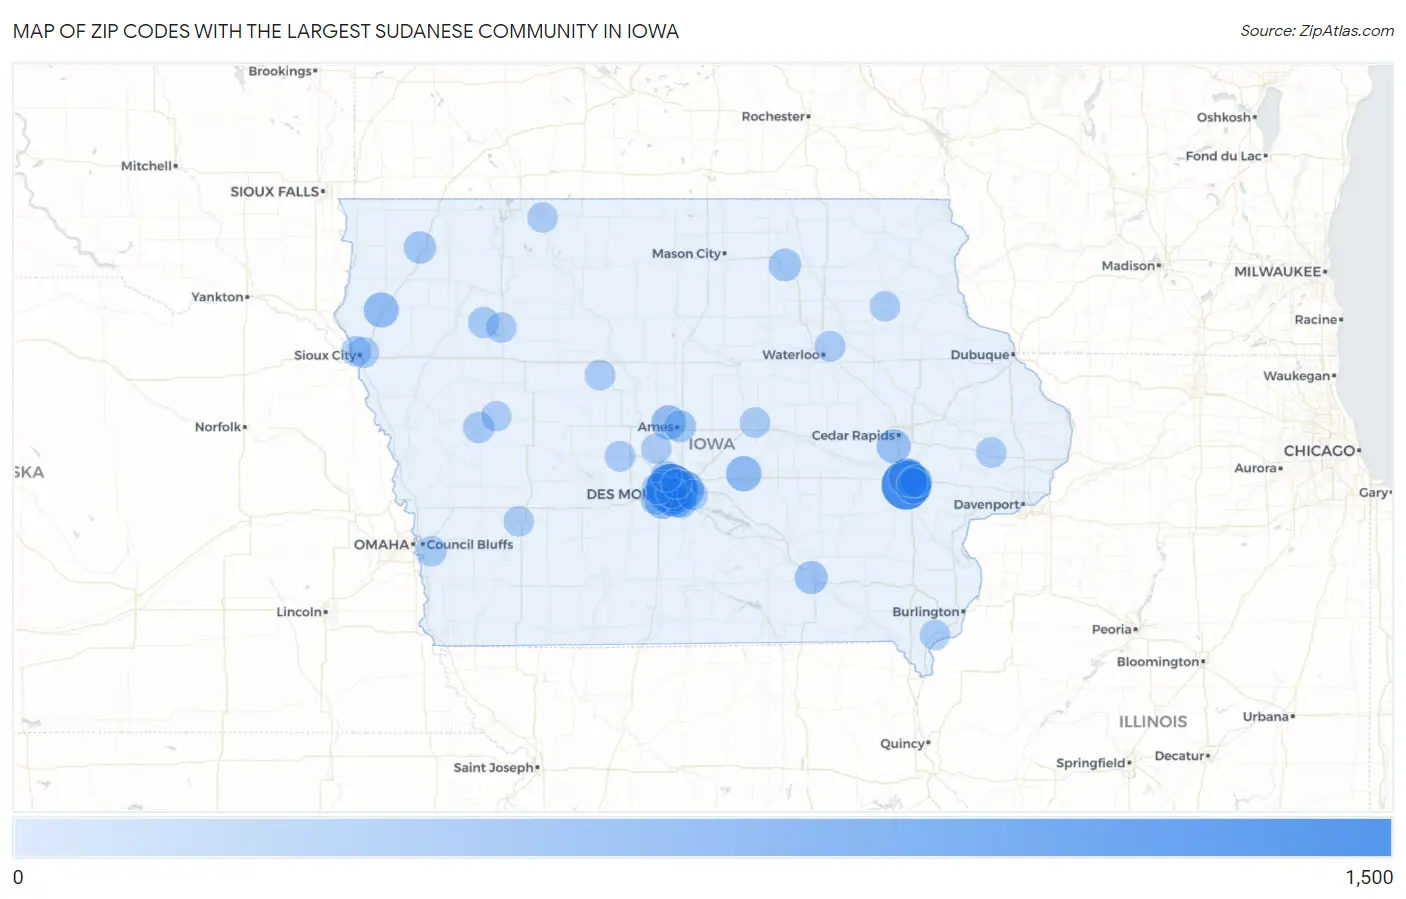
Map of Zip Codes with the Largest Sudanese Community in Iowa

0
1,500
Zip Codes with the Largest Sudanese Community in Iowa Map

Zip Codes with the Largest Sudanese Community in Iowa

Zip Code Sudanese vs State vs National
1.503101,0296,802(15.13%)#172,799(1.41%)#3
2.522461,0126,802(14.88%)#272,799(1.39%)#4
3.503147076,802(10.39%)#372,799(0.97%)#9
4.503174106,802(6.03%)#472,799(0.56%)#31
5.522414076,802(5.98%)#572,799(0.56%)#32
6.502082646,802(3.88%)#672,799(0.36%)#56
7.502652536,802(3.72%)#772,799(0.35%)#60
8.522402466,802(3.62%)#872,799(0.34%)#62
9.510312446,802(3.59%)#972,799(0.34%)#63
10.503222336,802(3.43%)#1072,799(0.32%)#70
11.503152296,802(3.37%)#1172,799(0.31%)#72
12.500142256,802(3.31%)#1272,799(0.31%)#74
13.524041916,802(2.81%)#1372,799(0.26%)#100
14.525011366,802(2.00%)#1472,799(0.19%)#147
15.503211326,802(1.94%)#1572,799(0.18%)#157
16.503091166,802(1.71%)#1672,799(0.16%)#182
17.506161136,802(1.66%)#1772,799(0.16%)#185
18.512011016,802(1.48%)#1872,799(0.14%)#204
19.52245956,802(1.40%)#1972,799(0.13%)#215
20.50266936,802(1.37%)#2072,799(0.13%)#221
21.50010866,802(1.26%)#2172,799(0.12%)#231
22.50320586,802(0.85%)#2272,799(0.08%)#324
23.50325546,802(0.79%)#2372,799(0.07%)#338
24.51442506,802(0.74%)#2472,799(0.07%)#357
25.50311496,802(0.72%)#2572,799(0.07%)#359
26.51002466,802(0.68%)#2672,799(0.06%)#370
27.51105296,802(0.43%)#2772,799(0.04%)#484
28.50131276,802(0.40%)#2872,799(0.04%)#504
29.50327246,802(0.35%)#2972,799(0.03%)#538
30.50220236,802(0.34%)#3072,799(0.03%)#551
31.50703216,802(0.31%)#3172,799(0.03%)#569
32.51503126,802(0.18%)#3272,799(0.02%)#685
33.50588126,802(0.18%)#3372,799(0.02%)#698
34.50523116,802(0.16%)#3472,799(0.02%)#714
35.5015896,802(0.13%)#3572,799(0.01%)#750
36.5224296,802(0.13%)#3672,799(0.01%)#756
37.5277796,802(0.13%)#3772,799(0.01%)#758
38.5262786,802(0.12%)#3872,799(0.01%)#769
39.5031376,802(0.10%)#3972,799(0.01%)#798
40.5002276,802(0.10%)#4072,799(0.01%)#803
41.5015676,802(0.10%)#4172,799(0.01%)#804
42.5110346,802(0.06%)#4272,799(0.01%)#858
43.5214226,802(0.03%)#4372,799(0.00%)#898
44.5133416,802(0.01%)#4472,799(0.00%)#914
45.5146516,802(0.01%)#4572,799(0.00%)#929

Common Questions

What are the Top 10 Zip Codes with the Largest Sudanese Community in Iowa?
Top 10 Zip Codes with the Largest Sudanese Community in Iowa are:
#1
1,029
#2
1,012
#3
707
#4
410
#5
407
#6
264
#7
253
#8
246
#9
244
#10
233
What zip code has the Largest Sudanese Community in Iowa?
50310 has the Largest Sudanese Community in Iowa with 1,029.
What is the Total Sudanese Population in the State of Iowa?
Total Sudanese Population in Iowa is 6,802.
What is the Total Sudanese Population in the United States?
Total Sudanese Population in the United States is 72,799.