Zip Codes with the Highest Percentage of Population Employed in Community & Social Service in Iowa
RELATED REPORTS & OPTIONS
Community & Social Service
Iowa
Compare Zip Codes
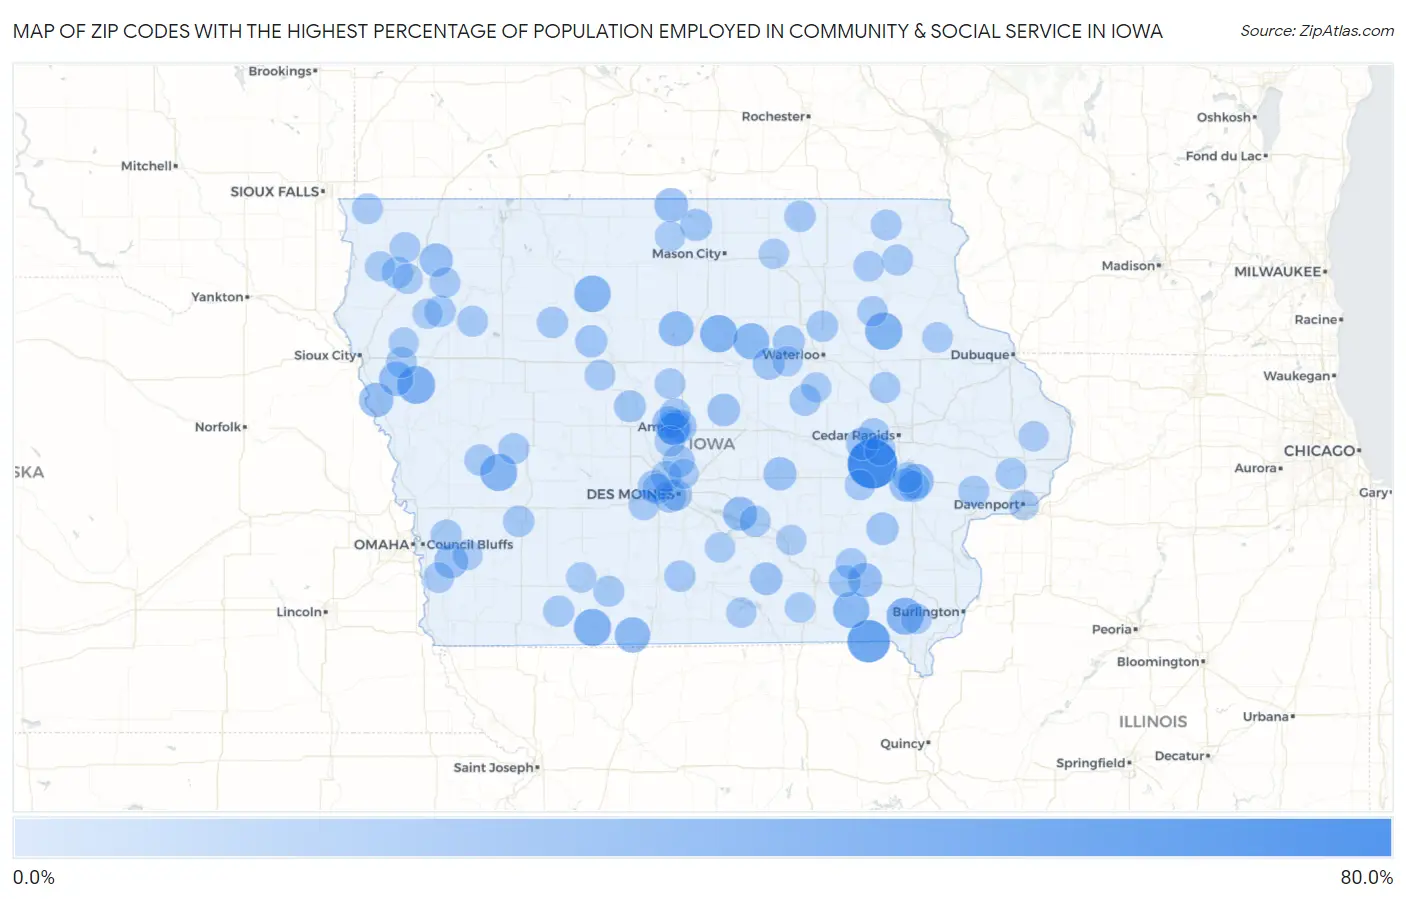
Map of Zip Codes with the Highest Percentage of Population Employed in Community & Social Service in Iowa
0.0%
80.0%
Zip Codes with the Highest Percentage of Population Employed in Community & Social Service in Iowa
| Zip Code | % Employed | vs State | vs National | |
| 1. | 52307 | 64.6% | 10.3%(+54.3)#1 | 11.2%(+53.4)#70 |
| 2. | 52573 | 45.6% | 10.3%(+35.2)#2 | 11.2%(+34.4)#213 |
| 3. | 51044 | 33.3% | 10.3%(+23.0)#3 | 11.2%(+22.1)#436 |
| 4. | 50671 | 31.8% | 10.3%(+21.5)#4 | 11.2%(+20.6)#493 |
| 5. | 50041 | 31.7% | 10.3%(+21.4)#5 | 11.2%(+20.5)#502 |
| 6. | 50835 | 31.6% | 10.3%(+21.2)#6 | 11.2%(+20.4)#511 |
| 7. | 51447 | 31.0% | 10.3%(+20.7)#7 | 11.2%(+19.8)#534 |
| 8. | 52631 | 30.8% | 10.3%(+20.4)#8 | 11.2%(+19.6)#552 |
| 9. | 50570 | 29.9% | 10.3%(+19.5)#9 | 11.2%(+18.6)#595 |
| 10. | 52551 | 29.0% | 10.3%(+18.7)#10 | 11.2%(+17.8)#631 |
| 11. | 50608 | 28.6% | 10.3%(+18.2)#11 | 11.2%(+17.4)#663 |
| 12. | 50140 | 26.9% | 10.3%(+16.6)#12 | 11.2%(+15.7)#782 |
| 13. | 50012 | 26.3% | 10.3%(+15.9)#13 | 11.2%(+15.1)#840 |
| 14. | 50101 | 25.7% | 10.3%(+15.4)#14 | 11.2%(+14.5)#896 |
| 15. | 52245 | 25.6% | 10.3%(+15.2)#15 | 11.2%(+14.4)#911 |
| 16. | 51055 | 24.1% | 10.3%(+13.8)#16 | 11.2%(+12.9)#1,088 |
| 17. | 51015 | 24.0% | 10.3%(+13.7)#17 | 11.2%(+12.8)#1,110 |
| 18. | 52557 | 23.4% | 10.3%(+13.0)#18 | 11.2%(+12.2)#1,221 |
| 19. | 50214 | 23.4% | 10.3%(+13.0)#19 | 11.2%(+12.1)#1,222 |
| 20. | 51571 | 23.1% | 10.3%(+12.8)#20 | 11.2%(+11.9)#1,259 |
| 21. | 50473 | 22.5% | 10.3%(+12.2)#21 | 11.2%(+11.3)#1,354 |
| 22. | 52246 | 21.5% | 10.3%(+11.2)#22 | 11.2%(+10.3)#1,588 |
| 23. | 51231 | 21.5% | 10.3%(+11.2)#23 | 11.2%(+10.3)#1,595 |
| 24. | 50112 | 21.2% | 10.3%(+10.9)#24 | 11.2%(+10.0)#1,653 |
| 25. | 50010 | 20.9% | 10.3%(+10.6)#25 | 11.2%(+9.71)#1,732 |
| 26. | 50312 | 20.1% | 10.3%(+9.74)#26 | 11.2%(+8.86)#1,991 |
| 27. | 50239 | 19.7% | 10.3%(+9.39)#27 | 11.2%(+8.50)#2,120 |
| 28. | 52531 | 19.7% | 10.3%(+9.34)#28 | 11.2%(+8.45)#2,139 |
| 29. | 52354 | 19.6% | 10.3%(+9.23)#29 | 11.2%(+8.35)#2,179 |
| 30. | 50014 | 19.4% | 10.3%(+9.09)#30 | 11.2%(+8.21)#2,230 |
| 31. | 50013 | 19.2% | 10.3%(+8.87)#31 | 11.2%(+7.99)#2,306 |
| 32. | 52359 | 19.0% | 10.3%(+8.68)#32 | 11.2%(+7.80)#2,394 |
| 33. | 50524 | 18.7% | 10.3%(+8.40)#33 | 11.2%(+7.51)#2,503 |
| 34. | 50007 | 18.4% | 10.3%(+8.11)#34 | 11.2%(+7.23)#2,617 |
| 35. | 50446 | 18.4% | 10.3%(+8.06)#35 | 11.2%(+7.18)#2,641 |
| 36. | 52533 | 18.2% | 10.3%(+7.85)#36 | 11.2%(+6.97)#2,727 |
| 37. | 50642 | 17.8% | 10.3%(+7.45)#37 | 11.2%(+6.57)#2,923 |
| 38. | 50223 | 17.8% | 10.3%(+7.43)#38 | 11.2%(+6.54)#2,941 |
| 39. | 50660 | 17.7% | 10.3%(+7.34)#39 | 11.2%(+6.45)#2,988 |
| 40. | 50323 | 17.3% | 10.3%(+6.97)#40 | 11.2%(+6.08)#3,187 |
| 41. | 52240 | 17.0% | 10.3%(+6.62)#41 | 11.2%(+5.74)#3,410 |
| 42. | 51014 | 16.8% | 10.3%(+6.50)#42 | 11.2%(+5.61)#3,492 |
| 43. | 51041 | 16.6% | 10.3%(+6.25)#43 | 11.2%(+5.37)#3,646 |
| 44. | 50309 | 16.5% | 10.3%(+6.19)#44 | 11.2%(+5.31)#3,683 |
| 45. | 50022 | 16.5% | 10.3%(+6.18)#45 | 11.2%(+5.30)#3,687 |
| 46. | 50622 | 16.5% | 10.3%(+6.16)#46 | 11.2%(+5.28)#3,696 |
| 47. | 50466 | 16.5% | 10.3%(+6.14)#47 | 11.2%(+5.26)#3,714 |
| 48. | 50675 | 16.4% | 10.3%(+6.12)#48 | 11.2%(+5.24)#3,736 |
| 49. | 50574 | 16.3% | 10.3%(+5.98)#49 | 11.2%(+5.09)#3,835 |
| 50. | 50275 | 16.3% | 10.3%(+5.94)#50 | 11.2%(+5.05)#3,862 |
| 51. | 51527 | 16.1% | 10.3%(+5.81)#51 | 11.2%(+4.93)#3,963 |
| 52. | 50862 | 16.1% | 10.3%(+5.74)#52 | 11.2%(+4.86)#4,022 |
| 53. | 52580 | 16.0% | 10.3%(+5.70)#53 | 11.2%(+4.81)#4,055 |
| 54. | 52746 | 16.0% | 10.3%(+5.68)#54 | 11.2%(+4.79)#4,065 |
| 55. | 52206 | 15.9% | 10.3%(+5.56)#55 | 11.2%(+4.67)#4,158 |
| 56. | 50219 | 15.8% | 10.3%(+5.49)#56 | 11.2%(+4.60)#4,223 |
| 57. | 51455 | 15.8% | 10.3%(+5.43)#57 | 11.2%(+4.55)#4,286 |
| 58. | 51548 | 15.7% | 10.3%(+5.32)#58 | 11.2%(+4.44)#4,376 |
| 59. | 52133 | 15.6% | 10.3%(+5.30)#59 | 11.2%(+4.42)#4,392 |
| 60. | 52351 | 15.5% | 10.3%(+5.21)#60 | 11.2%(+4.33)#4,460 |
| 61. | 51039 | 15.5% | 10.3%(+5.20)#61 | 11.2%(+4.32)#4,466 |
| 62. | 51005 | 15.5% | 10.3%(+5.18)#62 | 11.2%(+4.30)#4,488 |
| 63. | 50831 | 15.4% | 10.3%(+5.05)#63 | 11.2%(+4.17)#4,627 |
| 64. | 52352 | 15.4% | 10.3%(+5.04)#64 | 11.2%(+4.15)#4,644 |
| 65. | 52778 | 15.3% | 10.3%(+5.01)#65 | 11.2%(+4.12)#4,673 |
| 66. | 50105 | 15.3% | 10.3%(+4.99)#66 | 11.2%(+4.10)#4,688 |
| 67. | 50131 | 15.1% | 10.3%(+4.78)#67 | 11.2%(+3.90)#4,860 |
| 68. | 51242 | 15.1% | 10.3%(+4.72)#68 | 11.2%(+3.84)#4,916 |
| 69. | 52101 | 15.0% | 10.3%(+4.72)#69 | 11.2%(+3.84)#4,923 |
| 70. | 50523 | 14.9% | 10.3%(+4.56)#70 | 11.2%(+3.67)#5,070 |
| 71. | 50134 | 14.8% | 10.3%(+4.43)#71 | 11.2%(+3.55)#5,193 |
| 72. | 51234 | 14.8% | 10.3%(+4.43)#72 | 11.2%(+3.55)#5,194 |
| 73. | 50325 | 14.7% | 10.3%(+4.41)#73 | 11.2%(+3.53)#5,218 |
| 74. | 51046 | 14.7% | 10.3%(+4.34)#74 | 11.2%(+3.46)#5,286 |
| 75. | 51534 | 14.7% | 10.3%(+4.34)#75 | 11.2%(+3.45)#5,295 |
| 76. | 52657 | 14.6% | 10.3%(+4.30)#76 | 11.2%(+3.42)#5,327 |
| 77. | 50130 | 14.6% | 10.3%(+4.29)#77 | 11.2%(+3.41)#5,338 |
| 78. | 52361 | 14.5% | 10.3%(+4.14)#78 | 11.2%(+3.25)#5,503 |
| 79. | 50038 | 14.4% | 10.3%(+4.08)#79 | 11.2%(+3.20)#5,572 |
| 80. | 52050 | 14.4% | 10.3%(+4.07)#80 | 11.2%(+3.19)#5,586 |
| 81. | 50655 | 14.3% | 10.3%(+3.96)#81 | 11.2%(+3.07)#5,712 |
| 82. | 52166 | 14.3% | 10.3%(+3.96)#82 | 11.2%(+3.07)#5,729 |
| 83. | 51003 | 14.2% | 10.3%(+3.90)#83 | 11.2%(+3.01)#5,799 |
| 84. | 52595 | 14.1% | 10.3%(+3.74)#84 | 11.2%(+2.85)#6,009 |
| 85. | 50612 | 13.9% | 10.3%(+3.58)#85 | 11.2%(+2.69)#6,207 |
| 86. | 52241 | 13.9% | 10.3%(+3.55)#86 | 11.2%(+2.66)#6,234 |
| 87. | 51250 | 13.9% | 10.3%(+3.52)#87 | 11.2%(+2.64)#6,267 |
| 88. | 50624 | 13.8% | 10.3%(+3.52)#88 | 11.2%(+2.63)#6,274 |
| 89. | 52581 | 13.8% | 10.3%(+3.49)#89 | 11.2%(+2.61)#6,312 |
| 90. | 52552 | 13.8% | 10.3%(+3.46)#90 | 11.2%(+2.58)#6,346 |
| 91. | 50062 | 13.8% | 10.3%(+3.46)#91 | 11.2%(+2.58)#6,347 |
| 92. | 50842 | 13.8% | 10.3%(+3.46)#92 | 11.2%(+2.58)#6,358 |
| 93. | 51028 | 13.8% | 10.3%(+3.43)#93 | 11.2%(+2.55)#6,403 |
| 94. | 51035 | 13.7% | 10.3%(+3.41)#94 | 11.2%(+2.53)#6,427 |
| 95. | 51549 | 13.7% | 10.3%(+3.41)#95 | 11.2%(+2.53)#6,428 |
| 96. | 52801 | 13.7% | 10.3%(+3.40)#96 | 11.2%(+2.51)#6,446 |
| 97. | 50021 | 13.7% | 10.3%(+3.34)#97 | 11.2%(+2.46)#6,513 |
| 98. | 52731 | 13.6% | 10.3%(+3.32)#98 | 11.2%(+2.43)#6,548 |
| 99. | 50435 | 13.6% | 10.3%(+3.29)#99 | 11.2%(+2.41)#6,578 |
| 100. | 50436 | 13.6% | 10.3%(+3.26)#100 | 11.2%(+2.38)#6,620 |
Common Questions
What are the Top 10 Zip Codes with the Highest Percentage of Population Employed in Community & Social Service in Iowa?
Top 10 Zip Codes with the Highest Percentage of Population Employed in Community & Social Service in Iowa are:
What zip code has the Highest Percentage of Population Employed in Community & Social Service in Iowa?
52307 has the Highest Percentage of Population Employed in Community & Social Service in Iowa with 64.6%.
What is the Percentage of Population Employed in Community & Social Service in the State of Iowa?
Percentage of Population Employed in Community & Social Service in Iowa is 10.3%.
What is the Percentage of Population Employed in Community & Social Service in the United States?
Percentage of Population Employed in Community & Social Service in the United States is 11.2%.