Zip Codes with the Largest Greek Community in Iowa
RELATED REPORTS & OPTIONS
Greek
Iowa
Compare Zip Codes
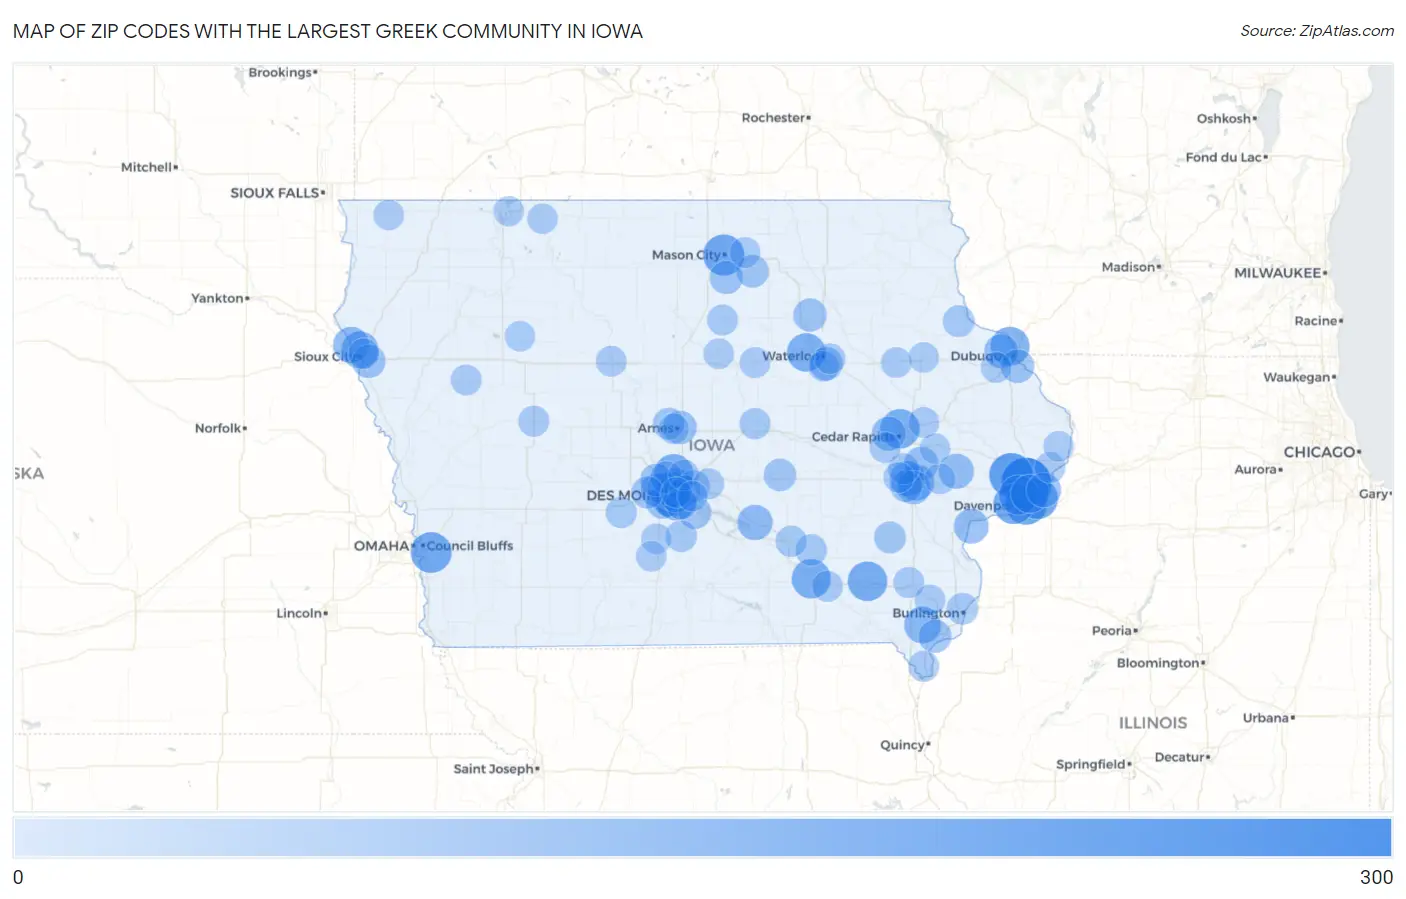
Map of Zip Codes with the Largest Greek Community in Iowa
0
300
Zip Codes with the Largest Greek Community in Iowa
| Zip Code | Greek | vs State | vs National | |
| 1. | 52748 | 271 | 5,736(4.72%)#1 | 1,230,319(0.02%)#1,021 |
| 2. | 52746 | 194 | 5,736(3.38%)#2 | 1,230,319(0.02%)#1,783 |
| 3. | 52803 | 166 | 5,736(2.89%)#3 | 1,230,319(0.01%)#2,218 |
| 4. | 50401 | 156 | 5,736(2.72%)#4 | 1,230,319(0.01%)#2,389 |
| 5. | 51503 | 150 | 5,736(2.62%)#5 | 1,230,319(0.01%)#2,516 |
| 6. | 52722 | 149 | 5,736(2.60%)#6 | 1,230,319(0.01%)#2,529 |
| 7. | 52804 | 147 | 5,736(2.56%)#7 | 1,230,319(0.01%)#2,577 |
| 8. | 52806 | 136 | 5,736(2.37%)#8 | 1,230,319(0.01%)#2,784 |
| 9. | 52556 | 134 | 5,736(2.34%)#9 | 1,230,319(0.01%)#2,847 |
| 10. | 52402 | 131 | 5,736(2.28%)#10 | 1,230,319(0.01%)#2,886 |
| 11. | 50023 | 129 | 5,736(2.25%)#11 | 1,230,319(0.01%)#2,928 |
| 12. | 52501 | 128 | 5,736(2.23%)#12 | 1,230,319(0.01%)#2,955 |
| 13. | 52001 | 126 | 5,736(2.20%)#13 | 1,230,319(0.01%)#2,998 |
| 14. | 50613 | 121 | 5,736(2.11%)#14 | 1,230,319(0.01%)#3,138 |
| 15. | 50315 | 120 | 5,736(2.09%)#15 | 1,230,319(0.01%)#3,173 |
| 16. | 52807 | 118 | 5,736(2.06%)#16 | 1,230,319(0.01%)#3,245 |
| 17. | 50312 | 104 | 5,736(1.81%)#17 | 1,230,319(0.01%)#3,681 |
| 18. | 51104 | 99 | 5,736(1.73%)#18 | 1,230,319(0.01%)#3,844 |
| 19. | 50310 | 96 | 5,736(1.67%)#19 | 1,230,319(0.01%)#3,933 |
| 20. | 52656 | 96 | 5,736(1.67%)#20 | 1,230,319(0.01%)#3,972 |
| 21. | 51109 | 89 | 5,736(1.55%)#21 | 1,230,319(0.01%)#4,207 |
| 22. | 52245 | 87 | 5,736(1.52%)#22 | 1,230,319(0.01%)#4,260 |
| 23. | 50219 | 76 | 5,736(1.32%)#23 | 1,230,319(0.01%)#4,724 |
| 24. | 52772 | 74 | 5,736(1.29%)#24 | 1,230,319(0.01%)#4,812 |
| 25. | 52241 | 73 | 5,736(1.27%)#25 | 1,230,319(0.01%)#4,844 |
| 26. | 52761 | 68 | 5,736(1.19%)#26 | 1,230,319(0.01%)#5,089 |
| 27. | 52753 | 67 | 5,736(1.17%)#27 | 1,230,319(0.01%)#5,168 |
| 28. | 52405 | 61 | 5,736(1.06%)#28 | 1,230,319(0.00%)#5,467 |
| 29. | 50313 | 60 | 5,736(1.05%)#29 | 1,230,319(0.00%)#5,548 |
| 30. | 52002 | 60 | 5,736(1.05%)#30 | 1,230,319(0.00%)#5,549 |
| 31. | 52333 | 59 | 5,736(1.03%)#31 | 1,230,319(0.00%)#5,626 |
| 32. | 52240 | 54 | 5,736(0.94%)#32 | 1,230,319(0.00%)#5,887 |
| 33. | 50325 | 54 | 5,736(0.94%)#33 | 1,230,319(0.00%)#5,905 |
| 34. | 50010 | 52 | 5,736(0.91%)#34 | 1,230,319(0.00%)#5,991 |
| 35. | 52003 | 52 | 5,736(0.91%)#35 | 1,230,319(0.00%)#6,019 |
| 36. | 51106 | 51 | 5,736(0.89%)#36 | 1,230,319(0.00%)#6,066 |
| 37. | 50702 | 50 | 5,736(0.87%)#37 | 1,230,319(0.00%)#6,145 |
| 38. | 50677 | 49 | 5,736(0.85%)#38 | 1,230,319(0.00%)#6,230 |
| 39. | 50321 | 49 | 5,736(0.85%)#39 | 1,230,319(0.00%)#6,236 |
| 40. | 52627 | 47 | 5,736(0.82%)#40 | 1,230,319(0.00%)#6,374 |
| 41. | 50469 | 47 | 5,736(0.82%)#41 | 1,230,319(0.00%)#6,407 |
| 42. | 50311 | 42 | 5,736(0.73%)#42 | 1,230,319(0.00%)#6,735 |
| 43. | 50322 | 41 | 5,736(0.71%)#43 | 1,230,319(0.00%)#6,788 |
| 44. | 50047 | 41 | 5,736(0.71%)#44 | 1,230,319(0.00%)#6,829 |
| 45. | 50265 | 40 | 5,736(0.70%)#45 | 1,230,319(0.00%)#6,846 |
| 46. | 50468 | 40 | 5,736(0.70%)#46 | 1,230,319(0.00%)#6,907 |
| 47. | 50111 | 39 | 5,736(0.68%)#47 | 1,230,319(0.00%)#6,946 |
| 48. | 50112 | 38 | 5,736(0.66%)#48 | 1,230,319(0.00%)#7,039 |
| 49. | 50309 | 37 | 5,736(0.65%)#49 | 1,230,319(0.00%)#7,125 |
| 50. | 50131 | 36 | 5,736(0.63%)#50 | 1,230,319(0.00%)#7,182 |
| 51. | 50263 | 35 | 5,736(0.61%)#51 | 1,230,319(0.00%)#7,266 |
| 52. | 50009 | 35 | 5,736(0.61%)#52 | 1,230,319(0.00%)#7,273 |
| 53. | 50317 | 31 | 5,736(0.54%)#53 | 1,230,319(0.00%)#7,583 |
| 54. | 50014 | 31 | 5,736(0.54%)#54 | 1,230,319(0.00%)#7,588 |
| 55. | 52246 | 30 | 5,736(0.52%)#55 | 1,230,319(0.00%)#7,725 |
| 56. | 52353 | 30 | 5,736(0.52%)#56 | 1,230,319(0.00%)#7,753 |
| 57. | 52052 | 28 | 5,736(0.49%)#57 | 1,230,319(0.00%)#7,971 |
| 58. | 52601 | 27 | 5,736(0.47%)#58 | 1,230,319(0.00%)#8,006 |
| 59. | 50125 | 25 | 5,736(0.44%)#59 | 1,230,319(0.00%)#8,255 |
| 60. | 50320 | 24 | 5,736(0.42%)#60 | 1,230,319(0.00%)#8,363 |
| 61. | 52561 | 24 | 5,736(0.42%)#61 | 1,230,319(0.00%)#8,459 |
| 62. | 52595 | 22 | 5,736(0.38%)#62 | 1,230,319(0.00%)#8,712 |
| 63. | 52317 | 21 | 5,736(0.37%)#63 | 1,230,319(0.00%)#8,757 |
| 64. | 50072 | 21 | 5,736(0.37%)#64 | 1,230,319(0.00%)#8,831 |
| 65. | 50158 | 20 | 5,736(0.35%)#65 | 1,230,319(0.00%)#8,881 |
| 66. | 52641 | 18 | 5,736(0.31%)#66 | 1,230,319(0.00%)#9,240 |
| 67. | 50441 | 18 | 5,736(0.31%)#67 | 1,230,319(0.00%)#9,286 |
| 68. | 51401 | 17 | 5,736(0.30%)#68 | 1,230,319(0.00%)#9,396 |
| 69. | 52632 | 17 | 5,736(0.30%)#69 | 1,230,319(0.00%)#9,399 |
| 70. | 52358 | 17 | 5,736(0.30%)#70 | 1,230,319(0.00%)#9,450 |
| 71. | 52530 | 17 | 5,736(0.30%)#71 | 1,230,319(0.00%)#9,496 |
| 72. | 50021 | 16 | 5,736(0.28%)#72 | 1,230,319(0.00%)#9,526 |
| 73. | 51105 | 16 | 5,736(0.28%)#73 | 1,230,319(0.00%)#9,565 |
| 74. | 50169 | 16 | 5,736(0.28%)#74 | 1,230,319(0.00%)#9,629 |
| 75. | 51445 | 16 | 5,736(0.28%)#75 | 1,230,319(0.00%)#9,637 |
| 76. | 50458 | 16 | 5,736(0.28%)#76 | 1,230,319(0.00%)#9,641 |
| 77. | 50701 | 15 | 5,736(0.26%)#77 | 1,230,319(0.00%)#9,679 |
| 78. | 50501 | 15 | 5,736(0.26%)#78 | 1,230,319(0.00%)#9,680 |
| 79. | 52730 | 15 | 5,736(0.26%)#79 | 1,230,319(0.00%)#9,779 |
| 80. | 52068 | 15 | 5,736(0.26%)#80 | 1,230,319(0.00%)#9,782 |
| 81. | 52228 | 15 | 5,736(0.26%)#81 | 1,230,319(0.00%)#9,795 |
| 82. | 52340 | 14 | 5,736(0.24%)#82 | 1,230,319(0.00%)#9,958 |
| 83. | 52336 | 14 | 5,736(0.24%)#83 | 1,230,319(0.00%)#9,995 |
| 84. | 50680 | 14 | 5,736(0.24%)#84 | 1,230,319(0.00%)#10,017 |
| 85. | 50707 | 13 | 5,736(0.23%)#85 | 1,230,319(0.00%)#10,119 |
| 86. | 52645 | 13 | 5,736(0.23%)#86 | 1,230,319(0.00%)#10,155 |
| 87. | 50012 | 13 | 5,736(0.23%)#87 | 1,230,319(0.00%)#10,184 |
| 88. | 50682 | 13 | 5,736(0.23%)#88 | 1,230,319(0.00%)#10,193 |
| 89. | 50314 | 12 | 5,736(0.21%)#89 | 1,230,319(0.00%)#10,287 |
| 90. | 50126 | 12 | 5,736(0.21%)#90 | 1,230,319(0.00%)#10,328 |
| 91. | 52253 | 12 | 5,736(0.21%)#91 | 1,230,319(0.00%)#10,382 |
| 92. | 50240 | 12 | 5,736(0.21%)#92 | 1,230,319(0.00%)#10,392 |
| 93. | 52732 | 11 | 5,736(0.19%)#93 | 1,230,319(0.00%)#10,460 |
| 94. | 51334 | 11 | 5,736(0.19%)#94 | 1,230,319(0.00%)#10,533 |
| 95. | 51246 | 11 | 5,736(0.19%)#95 | 1,230,319(0.00%)#10,578 |
| 96. | 50568 | 11 | 5,736(0.19%)#96 | 1,230,319(0.00%)#10,637 |
| 97. | 50257 | 11 | 5,736(0.19%)#97 | 1,230,319(0.00%)#10,644 |
| 98. | 50327 | 10 | 5,736(0.17%)#98 | 1,230,319(0.00%)#10,753 |
| 99. | 51360 | 10 | 5,736(0.17%)#99 | 1,230,319(0.00%)#10,776 |
| 100. | 52057 | 10 | 5,736(0.17%)#100 | 1,230,319(0.00%)#10,780 |
Common Questions
What are the Top 10 Zip Codes with the Largest Greek Community in Iowa?
Top 10 Zip Codes with the Largest Greek Community in Iowa are:
What zip code has the Largest Greek Community in Iowa?
52748 has the Largest Greek Community in Iowa with 271.
What is the Total Greek Population in the State of Iowa?
Total Greek Population in Iowa is 5,736.
What is the Total Greek Population in the United States?
Total Greek Population in the United States is 1,230,319.