Zip Codes with the Largest Burmese Community in Iowa
RELATED REPORTS & OPTIONS
Burmese
Iowa
Compare Zip Codes
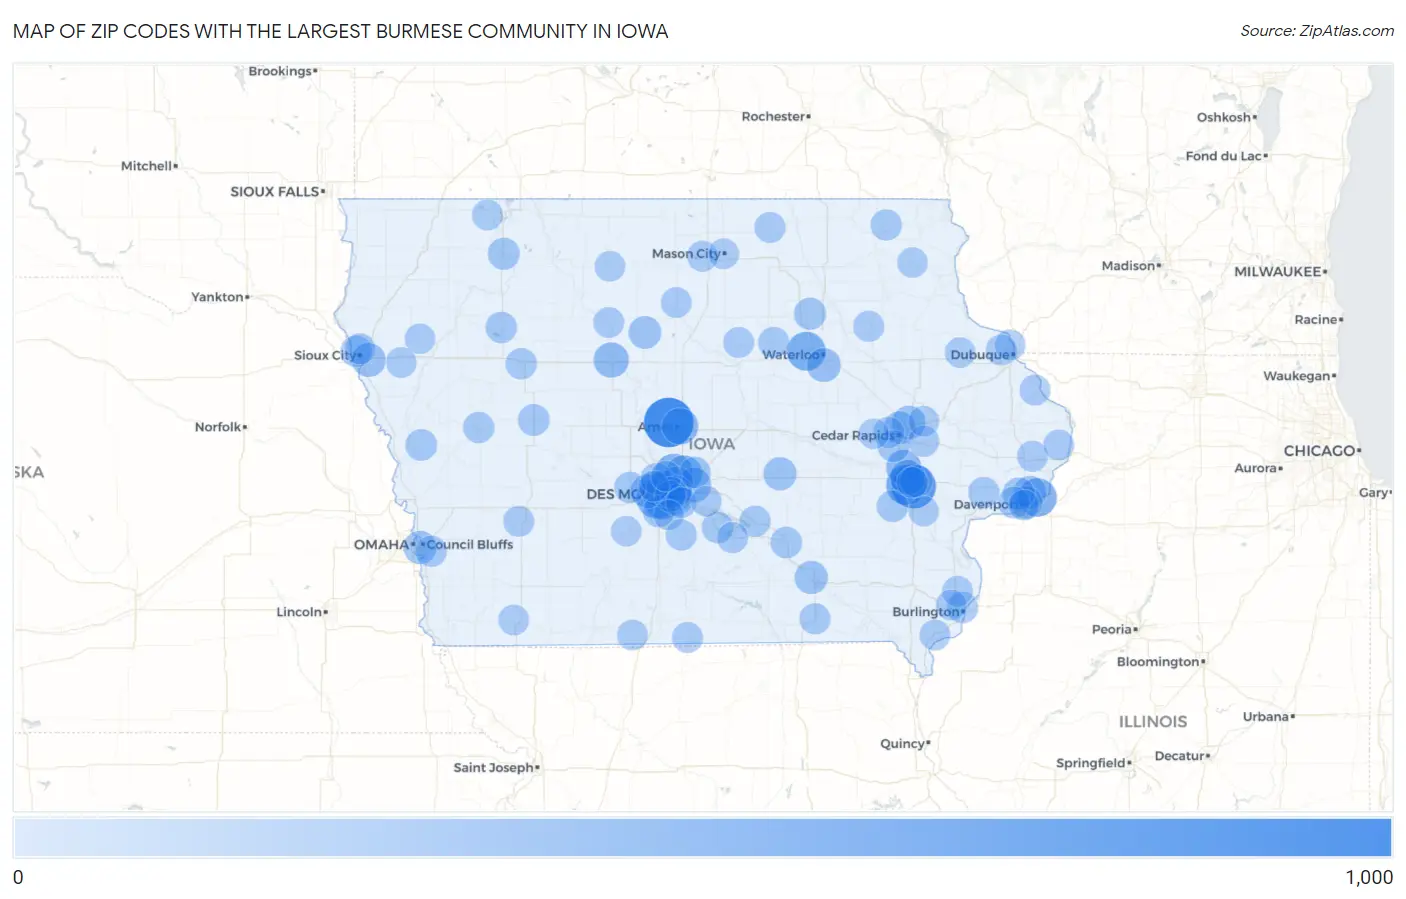
Map of Zip Codes with the Largest Burmese Community in Iowa
0
1,000
Zip Codes with the Largest Burmese Community in Iowa
| Zip Code | Burmese | vs State | vs National | |
| 1. | 50014 | 816 | 10,712(7.62%)#1 | 1,977,441(0.04%)#434 |
| 2. | 52240 | 598 | 10,712(5.58%)#2 | 1,977,441(0.03%)#687 |
| 3. | 52246 | 420 | 10,712(3.92%)#3 | 1,977,441(0.02%)#1,067 |
| 4. | 50266 | 386 | 10,712(3.60%)#4 | 1,977,441(0.02%)#1,166 |
| 5. | 50613 | 363 | 10,712(3.39%)#5 | 1,977,441(0.02%)#1,253 |
| 6. | 52722 | 348 | 10,712(3.25%)#6 | 1,977,441(0.02%)#1,318 |
| 7. | 50023 | 309 | 10,712(2.88%)#7 | 1,977,441(0.02%)#1,509 |
| 8. | 50021 | 277 | 10,712(2.59%)#8 | 1,977,441(0.01%)#1,693 |
| 9. | 50265 | 273 | 10,712(2.55%)#9 | 1,977,441(0.01%)#1,712 |
| 10. | 50010 | 267 | 10,712(2.49%)#10 | 1,977,441(0.01%)#1,756 |
| 11. | 52317 | 217 | 10,712(2.03%)#11 | 1,977,441(0.01%)#2,142 |
| 12. | 50325 | 216 | 10,712(2.02%)#12 | 1,977,441(0.01%)#2,150 |
| 13. | 50501 | 215 | 10,712(2.01%)#13 | 1,977,441(0.01%)#2,157 |
| 14. | 52241 | 215 | 10,712(2.01%)#14 | 1,977,441(0.01%)#2,163 |
| 15. | 50009 | 195 | 10,712(1.82%)#15 | 1,977,441(0.01%)#2,370 |
| 16. | 50313 | 189 | 10,712(1.76%)#16 | 1,977,441(0.01%)#2,425 |
| 17. | 50322 | 174 | 10,712(1.62%)#17 | 1,977,441(0.01%)#2,605 |
| 18. | 50701 | 158 | 10,712(1.47%)#18 | 1,977,441(0.01%)#2,845 |
| 19. | 51106 | 157 | 10,712(1.47%)#19 | 1,977,441(0.01%)#2,862 |
| 20. | 50263 | 155 | 10,712(1.45%)#20 | 1,977,441(0.01%)#2,894 |
| 21. | 52302 | 143 | 10,712(1.33%)#21 | 1,977,441(0.01%)#3,063 |
| 22. | 50112 | 133 | 10,712(1.24%)#22 | 1,977,441(0.01%)#3,258 |
| 23. | 52807 | 132 | 10,712(1.23%)#23 | 1,977,441(0.01%)#3,268 |
| 24. | 52501 | 131 | 10,712(1.22%)#24 | 1,977,441(0.01%)#3,284 |
| 25. | 51501 | 130 | 10,712(1.21%)#25 | 1,977,441(0.01%)#3,304 |
| 26. | 50533 | 107 | 10,712(1.00%)#26 | 1,977,441(0.01%)#3,799 |
| 27. | 52803 | 105 | 10,712(0.98%)#27 | 1,977,441(0.01%)#3,844 |
| 28. | 52402 | 103 | 10,712(0.96%)#28 | 1,977,441(0.01%)#3,885 |
| 29. | 52245 | 100 | 10,712(0.93%)#29 | 1,977,441(0.01%)#3,976 |
| 30. | 52806 | 96 | 10,712(0.90%)#30 | 1,977,441(0.00%)#4,080 |
| 31. | 50677 | 84 | 10,712(0.78%)#31 | 1,977,441(0.00%)#4,418 |
| 32. | 51301 | 79 | 10,712(0.74%)#32 | 1,977,441(0.00%)#4,566 |
| 33. | 52404 | 78 | 10,712(0.73%)#33 | 1,977,441(0.00%)#4,578 |
| 34. | 50309 | 77 | 10,712(0.72%)#34 | 1,977,441(0.00%)#4,644 |
| 35. | 50061 | 76 | 10,712(0.71%)#35 | 1,977,441(0.00%)#4,686 |
| 36. | 52804 | 72 | 10,712(0.67%)#36 | 1,977,441(0.00%)#4,820 |
| 37. | 51558 | 68 | 10,712(0.63%)#37 | 1,977,441(0.00%)#4,993 |
| 38. | 51103 | 67 | 10,712(0.63%)#38 | 1,977,441(0.00%)#5,013 |
| 39. | 52577 | 67 | 10,712(0.63%)#39 | 1,977,441(0.00%)#5,016 |
| 40. | 51401 | 67 | 10,712(0.63%)#40 | 1,977,441(0.00%)#5,018 |
| 41. | 50315 | 66 | 10,712(0.62%)#41 | 1,977,441(0.00%)#5,040 |
| 42. | 50314 | 66 | 10,712(0.62%)#42 | 1,977,441(0.00%)#5,068 |
| 43. | 52247 | 64 | 10,712(0.60%)#43 | 1,977,441(0.00%)#5,166 |
| 44. | 50035 | 61 | 10,712(0.57%)#44 | 1,977,441(0.00%)#5,271 |
| 45. | 52601 | 60 | 10,712(0.56%)#45 | 1,977,441(0.00%)#5,290 |
| 46. | 50003 | 60 | 10,712(0.56%)#46 | 1,977,441(0.00%)#5,308 |
| 47. | 50111 | 59 | 10,712(0.55%)#47 | 1,977,441(0.00%)#5,343 |
| 48. | 50588 | 57 | 10,712(0.53%)#48 | 1,977,441(0.00%)#5,443 |
| 49. | 50225 | 56 | 10,712(0.52%)#49 | 1,977,441(0.00%)#5,498 |
| 50. | 50311 | 55 | 10,712(0.51%)#50 | 1,977,441(0.00%)#5,537 |
| 51. | 50583 | 54 | 10,712(0.50%)#51 | 1,977,441(0.00%)#5,599 |
| 52. | 51442 | 53 | 10,712(0.49%)#52 | 1,977,441(0.00%)#5,636 |
| 53. | 52405 | 52 | 10,712(0.49%)#53 | 1,977,441(0.00%)#5,668 |
| 54. | 50312 | 50 | 10,712(0.47%)#54 | 1,977,441(0.00%)#5,767 |
| 55. | 50219 | 47 | 10,712(0.44%)#55 | 1,977,441(0.00%)#5,937 |
| 56. | 51503 | 46 | 10,712(0.43%)#56 | 1,977,441(0.00%)#5,966 |
| 57. | 50138 | 46 | 10,712(0.43%)#57 | 1,977,441(0.00%)#5,997 |
| 58. | 52747 | 46 | 10,712(0.43%)#58 | 1,977,441(0.00%)#6,014 |
| 59. | 52101 | 45 | 10,712(0.42%)#59 | 1,977,441(0.00%)#6,048 |
| 60. | 52242 | 44 | 10,712(0.41%)#60 | 1,977,441(0.00%)#6,117 |
| 61. | 50125 | 43 | 10,712(0.40%)#61 | 1,977,441(0.00%)#6,145 |
| 62. | 52537 | 42 | 10,712(0.39%)#62 | 1,977,441(0.00%)#6,225 |
| 63. | 50665 | 41 | 10,712(0.38%)#63 | 1,977,441(0.00%)#6,313 |
| 64. | 50662 | 40 | 10,712(0.37%)#64 | 1,977,441(0.00%)#6,362 |
| 65. | 50323 | 38 | 10,712(0.35%)#65 | 1,977,441(0.00%)#6,440 |
| 66. | 52742 | 38 | 10,712(0.35%)#66 | 1,977,441(0.00%)#6,466 |
| 67. | 52314 | 38 | 10,712(0.35%)#67 | 1,977,441(0.00%)#6,471 |
| 68. | 50461 | 38 | 10,712(0.35%)#68 | 1,977,441(0.00%)#6,473 |
| 69. | 50428 | 37 | 10,712(0.35%)#69 | 1,977,441(0.00%)#6,530 |
| 70. | 51104 | 36 | 10,712(0.34%)#70 | 1,977,441(0.00%)#6,576 |
| 71. | 52002 | 35 | 10,712(0.33%)#71 | 1,977,441(0.00%)#6,649 |
| 72. | 50022 | 34 | 10,712(0.32%)#72 | 1,977,441(0.00%)#6,742 |
| 73. | 50601 | 34 | 10,712(0.32%)#73 | 1,977,441(0.00%)#6,760 |
| 74. | 50140 | 33 | 10,712(0.31%)#74 | 1,977,441(0.00%)#6,827 |
| 75. | 51347 | 33 | 10,712(0.31%)#75 | 1,977,441(0.00%)#6,833 |
| 76. | 50147 | 33 | 10,712(0.31%)#76 | 1,977,441(0.00%)#6,836 |
| 77. | 50131 | 31 | 10,712(0.29%)#77 | 1,977,441(0.00%)#6,949 |
| 78. | 52031 | 31 | 10,712(0.29%)#78 | 1,977,441(0.00%)#6,987 |
| 79. | 52001 | 30 | 10,712(0.28%)#79 | 1,977,441(0.00%)#7,014 |
| 80. | 52732 | 30 | 10,712(0.28%)#80 | 1,977,441(0.00%)#7,029 |
| 81. | 50548 | 30 | 10,712(0.28%)#81 | 1,977,441(0.00%)#7,066 |
| 82. | 52650 | 30 | 10,712(0.28%)#82 | 1,977,441(0.00%)#7,078 |
| 83. | 50320 | 29 | 10,712(0.27%)#83 | 1,977,441(0.00%)#7,111 |
| 84. | 50237 | 29 | 10,712(0.27%)#84 | 1,977,441(0.00%)#7,166 |
| 85. | 52627 | 28 | 10,712(0.26%)#85 | 1,977,441(0.00%)#7,234 |
| 86. | 51632 | 27 | 10,712(0.25%)#86 | 1,977,441(0.00%)#7,342 |
| 87. | 50421 | 27 | 10,712(0.25%)#87 | 1,977,441(0.00%)#7,362 |
| 88. | 52336 | 27 | 10,712(0.25%)#88 | 1,977,441(0.00%)#7,367 |
| 89. | 52655 | 26 | 10,712(0.24%)#89 | 1,977,441(0.00%)#7,432 |
| 90. | 51039 | 26 | 10,712(0.24%)#90 | 1,977,441(0.00%)#7,437 |
| 91. | 50401 | 25 | 10,712(0.23%)#91 | 1,977,441(0.00%)#7,469 |
| 92. | 52801 | 22 | 10,712(0.21%)#92 | 1,977,441(0.00%)#7,831 |
| 93. | 50273 | 21 | 10,712(0.20%)#93 | 1,977,441(0.00%)#7,891 |
| 94. | 50511 | 21 | 10,712(0.20%)#94 | 1,977,441(0.00%)#7,897 |
| 95. | 52040 | 21 | 10,712(0.20%)#95 | 1,977,441(0.00%)#7,900 |
| 96. | 52206 | 21 | 10,712(0.20%)#96 | 1,977,441(0.00%)#7,916 |
| 97. | 52755 | 18 | 10,712(0.17%)#97 | 1,977,441(0.00%)#8,312 |
| 98. | 51048 | 18 | 10,712(0.17%)#98 | 1,977,441(0.00%)#8,320 |
| 99. | 50211 | 17 | 10,712(0.16%)#99 | 1,977,441(0.00%)#8,369 |
| 100. | 52162 | 17 | 10,712(0.16%)#100 | 1,977,441(0.00%)#8,421 |
Common Questions
What are the Top 10 Zip Codes with the Largest Burmese Community in Iowa?
Top 10 Zip Codes with the Largest Burmese Community in Iowa are:
What zip code has the Largest Burmese Community in Iowa?
50014 has the Largest Burmese Community in Iowa with 816.
What is the Total Burmese Population in the State of Iowa?
Total Burmese Population in Iowa is 10,712.
What is the Total Burmese Population in the United States?
Total Burmese Population in the United States is 1,977,441.