Zip Codes with the Highest Percentage of Guamanian / Chamorro Population in Iowa
RELATED REPORTS & OPTIONS
Guamanian / Chamorro
Iowa
Compare Zip Codes
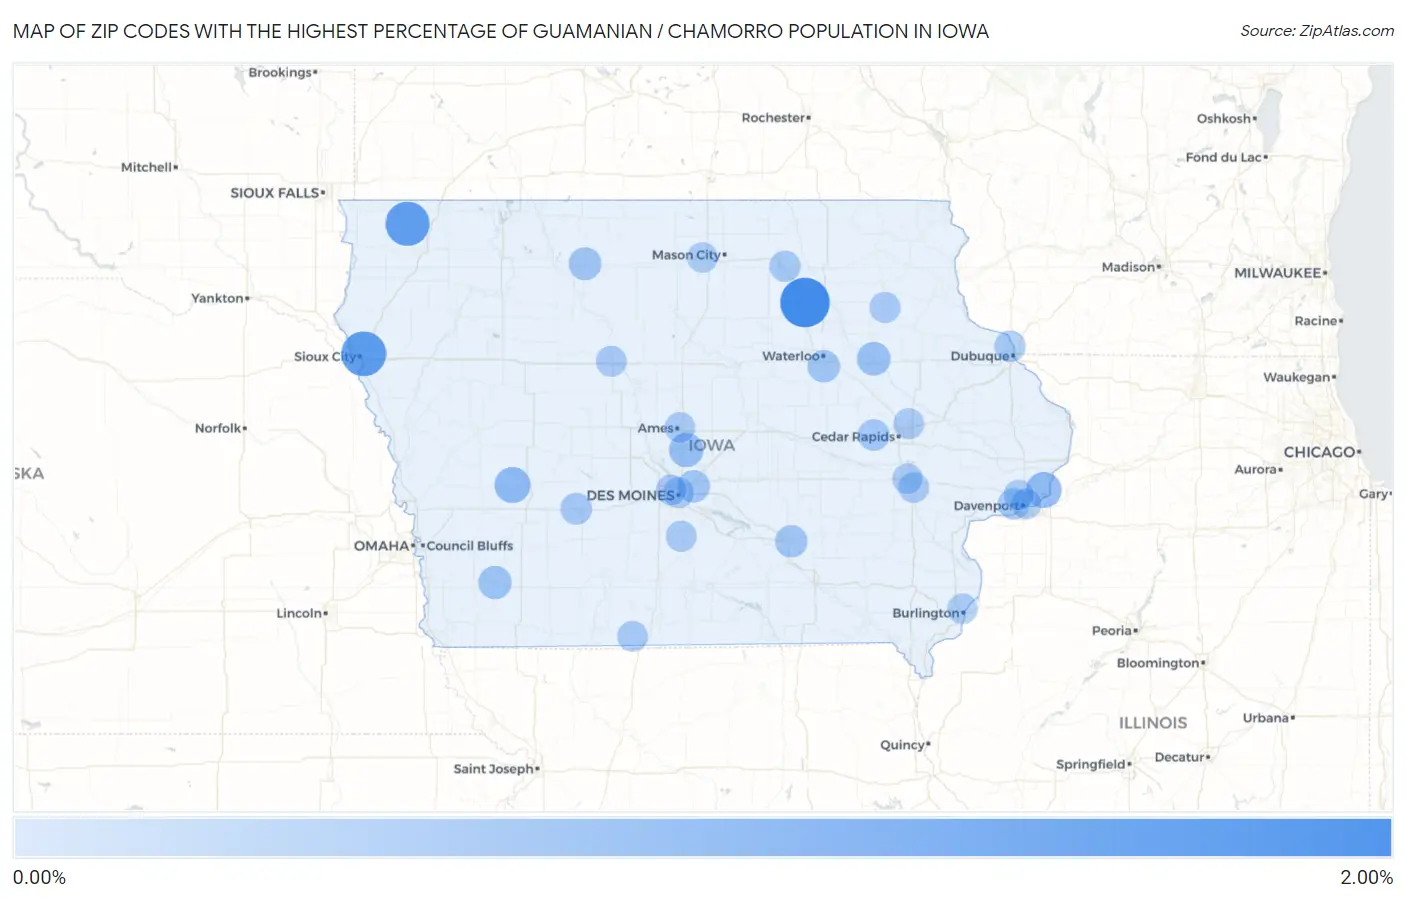
Map of Zip Codes with the Highest Percentage of Guamanian / Chamorro Population in Iowa
0.00%
2.00%
Zip Codes with the Highest Percentage of Guamanian / Chamorro Population in Iowa
| Zip Code | Guamanian / Chamorro | vs State | vs National | |
| 1. | 50666 | 1.81% | 0.017%(+1.79)#1 | 0.047%(+1.76)#63 |
| 2. | 51105 | 1.35% | 0.017%(+1.33)#2 | 0.047%(+1.30)#93 |
| 3. | 51237 | 1.29% | 0.017%(+1.28)#3 | 0.047%(+1.25)#100 |
| 4. | 51543 | 0.51% | 0.017%(+0.496)#4 | 0.047%(+0.466)#410 |
| 5. | 52753 | 0.49% | 0.017%(+0.474)#5 | 0.047%(+0.445)#429 |
| 6. | 50046 | 0.36% | 0.017%(+0.346)#6 | 0.047%(+0.317)#577 |
| 7. | 50644 | 0.30% | 0.017%(+0.282)#7 | 0.047%(+0.252)#704 |
| 8. | 51566 | 0.27% | 0.017%(+0.249)#8 | 0.047%(+0.220)#799 |
| 9. | 50598 | 0.23% | 0.017%(+0.208)#9 | 0.047%(+0.179)#932 |
| 10. | 50701 | 0.19% | 0.017%(+0.169)#10 | 0.047%(+0.139)#1,100 |
| 11. | 52595 | 0.19% | 0.017%(+0.169)#11 | 0.047%(+0.139)#1,102 |
| 12. | 50009 | 0.18% | 0.017%(+0.165)#12 | 0.047%(+0.136)#1,125 |
| 13. | 50048 | 0.13% | 0.017%(+0.112)#13 | 0.047%(+0.082)#1,426 |
| 14. | 52206 | 0.11% | 0.017%(+0.095)#14 | 0.047%(+0.066)#1,555 |
| 15. | 52804 | 0.11% | 0.017%(+0.095)#15 | 0.047%(+0.065)#1,562 |
| 16. | 52001 | 0.082% | 0.017%(+0.065)#16 | 0.047%(+0.035)#1,866 |
| 17. | 50616 | 0.073% | 0.017%(+0.056)#17 | 0.047%(+0.027)#1,954 |
| 18. | 52142 | 0.056% | 0.017%(+0.039)#18 | 0.047%(+0.009)#2,165 |
| 19. | 50125 | 0.054% | 0.017%(+0.037)#19 | 0.047%(+0.007)#2,185 |
| 20. | 50501 | 0.053% | 0.017%(+0.036)#20 | 0.047%(+0.006)#2,205 |
| 21. | 52302 | 0.049% | 0.017%(+0.032)#21 | 0.047%(+0.003)#2,263 |
| 22. | 50316 | 0.048% | 0.017%(+0.031)#22 | 0.047%(+0.002)#2,278 |
| 23. | 50310 | 0.041% | 0.017%(+0.024)#23 | 0.047%(-0.006)#2,402 |
| 24. | 50140 | 0.034% | 0.017%(+0.017)#24 | 0.047%(-0.013)#2,549 |
| 25. | 52803 | 0.032% | 0.017%(+0.015)#25 | 0.047%(-0.014)#2,571 |
| 26. | 50010 | 0.030% | 0.017%(+0.013)#26 | 0.047%(-0.017)#2,623 |
| 27. | 52240 | 0.022% | 0.017%(+0.005)#27 | 0.047%(-0.025)#2,796 |
| 28. | 50428 | 0.011% | 0.017%(-0.006)#28 | 0.047%(-0.036)#3,018 |
| 29. | 52241 | 0.0089% | 0.017%(-0.008)#29 | 0.047%(-0.038)#3,052 |
| 30. | 52601 | 0.0036% | 0.017%(-0.013)#30 | 0.047%(-0.043)#3,115 |
| 31. | 52806 | 0.0036% | 0.017%(-0.013)#31 | 0.047%(-0.043)#3,116 |
1
2Common Questions
What are the Top 10 Zip Codes with the Highest Percentage of Guamanian / Chamorro Population in Iowa?
Top 10 Zip Codes with the Highest Percentage of Guamanian / Chamorro Population in Iowa are:
What zip code has the Highest Percentage of Guamanian / Chamorro Population in Iowa?
50666 has the Highest Percentage of Guamanian / Chamorro Population in Iowa with 1.81%.
What is the Percentage of Guamanian / Chamorro Population in the State of Iowa?
Percentage of Guamanian / Chamorro Population in Iowa is 0.017%.
What is the Percentage of Guamanian / Chamorro Population in the United States?
Percentage of Guamanian / Chamorro Population in the United States is 0.047%.