Zip Codes with the Highest Percentage of Population Employed in Construction & Extraction in Iowa
RELATED REPORTS & OPTIONS
Construction & Extraction
Iowa
Compare Zip Codes
Map of Zip Codes with the Highest Percentage of Population Employed in Construction & Extraction in Iowa
10.0%
50.0%
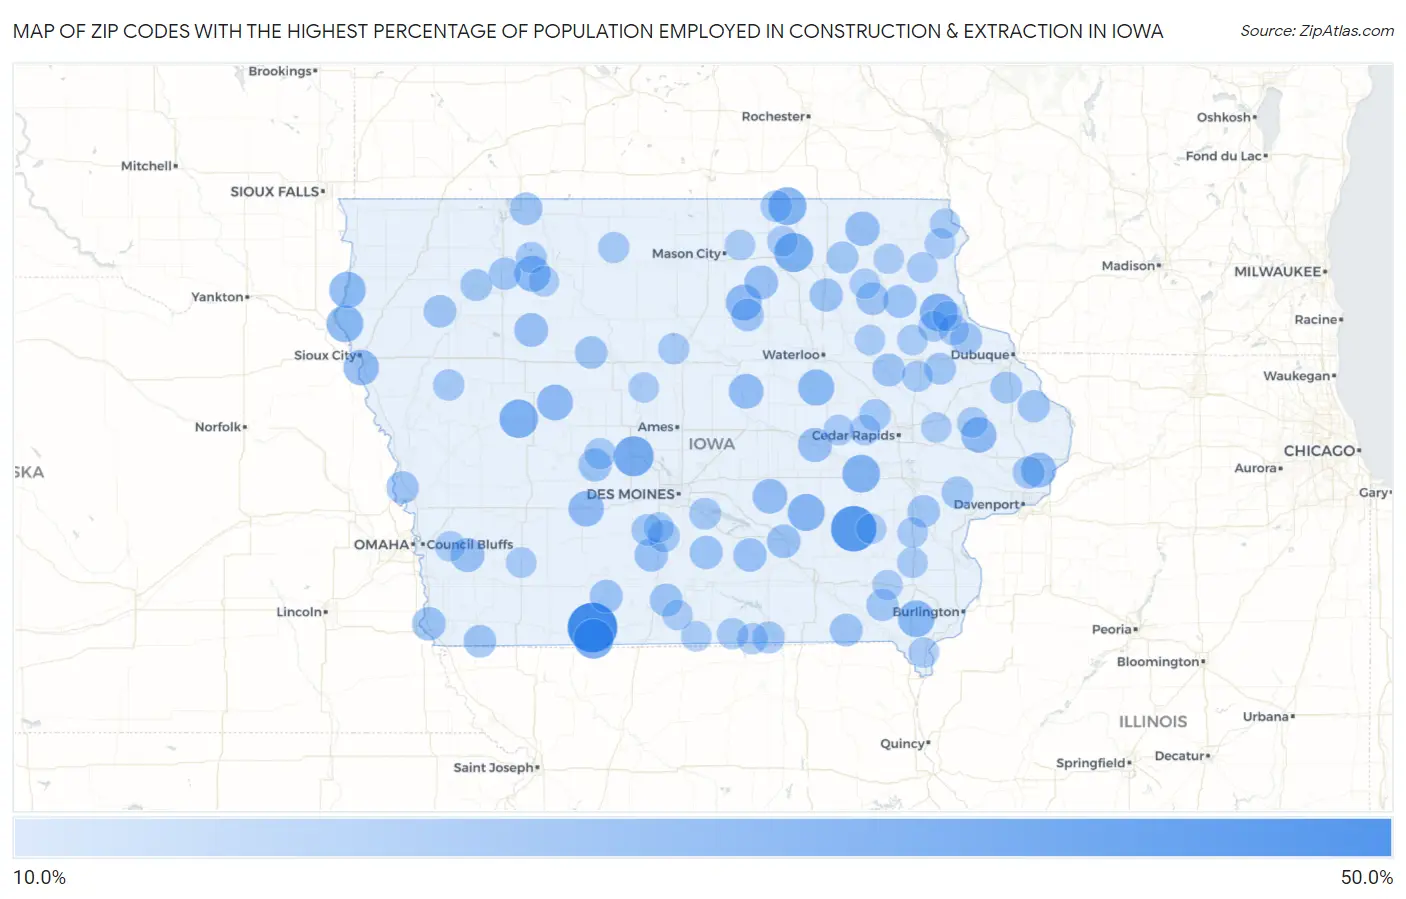
Zip Codes with the Highest Percentage of Population Employed in Construction & Extraction in Iowa
| Zip Code | % Employed | vs State | vs National | |
| 1. | 50835 | 42.1% | 5.0% (+37.1)#1 | 5.0% (+37.1)#190 |
| 2. | 52231 | 35.8% | 5.0% (+30.8)#2 | 5.0% (+30.8)#280 |
| 3. | 50039 | 27.1% | 5.0% (+22.1)#3 | 5.0% (+22.1)#507 |
| 4. | 50860 | 26.8% | 5.0% (+21.8)#4 | 5.0% (+21.8)#520 |
| 5. | 50620 | 25.7% | 5.0% (+20.8)#5 | 5.0% (+20.7)#560 |
| 6. | 51430 | 24.9% | 5.0% (+19.9)#6 | 5.0% (+19.9)#602 |
| 7. | 50455 | 23.8% | 5.0% (+18.9)#7 | 5.0% (+18.8)#659 |
| 8. | 52044 | 23.8% | 5.0% (+18.8)#8 | 5.0% (+18.8)#667 |
| 9. | 52220 | 23.7% | 5.0% (+18.7)#9 | 5.0% (+18.7)#674 |
| 10. | 50027 | 22.6% | 5.0% (+17.6)#10 | 5.0% (+17.6)#753 |
| 11. | 51062 | 22.1% | 5.0% (+17.2)#11 | 5.0% (+17.1)#786 |
| 12. | 52657 | 22.0% | 5.0% (+17.0)#12 | 5.0% (+17.0)#801 |
| 13. | 51011 | 21.6% | 5.0% (+16.7)#13 | 5.0% (+16.6)#830 |
| 14. | 50612 | 21.2% | 5.0% (+16.2)#14 | 5.0% (+16.2)#872 |
| 15. | 50515 | 20.9% | 5.0% (+16.0)#15 | 5.0% (+15.9)#901 |
| 16. | 50605 | 20.8% | 5.0% (+15.8)#16 | 5.0% (+15.8)#914 |
| 17. | 51451 | 20.7% | 5.0% (+15.7)#17 | 5.0% (+15.7)#919 |
| 18. | 51111 | 20.3% | 5.0% (+15.4)#18 | 5.0% (+15.3)#954 |
| 19. | 52323 | 20.2% | 5.0% (+15.2)#19 | 5.0% (+15.2)#977 |
| 20. | 50164 | 20.0% | 5.0% (+15.0)#20 | 5.0% (+15.0)#992 |
| 21. | 52758 | 19.4% | 5.0% (+14.4)#21 | 5.0% (+14.4)#1,078 |
| 22. | 50153 | 19.1% | 5.0% (+14.2)#22 | 5.0% (+14.1)#1,112 |
| 23. | 50269 | 19.1% | 5.0% (+14.2)#23 | 5.0% (+14.1)#1,116 |
| 24. | 52165 | 18.6% | 5.0% (+13.6)#24 | 5.0% (+13.6)#1,188 |
| 25. | 52215 | 18.0% | 5.0% (+13.1)#25 | 5.0% (+13.0)#1,292 |
| 26. | 51549 | 18.0% | 5.0% (+13.0)#26 | 5.0% (+13.0)#1,296 |
| 27. | 50593 | 17.6% | 5.0% (+12.7)#27 | 5.0% (+12.7)#1,361 |
| 28. | 50653 | 17.5% | 5.0% (+12.5)#28 | 5.0% (+12.5)#1,383 |
| 29. | 52534 | 17.3% | 5.0% (+12.4)#29 | 5.0% (+12.3)#1,414 |
| 30. | 51648 | 17.2% | 5.0% (+12.3)#30 | 5.0% (+12.2)#1,427 |
| 31. | 50116 | 17.1% | 5.0% (+12.1)#31 | 5.0% (+12.1)#1,447 |
| 32. | 50257 | 16.9% | 5.0% (+11.9)#32 | 5.0% (+11.9)#1,488 |
| 33. | 52169 | 16.9% | 5.0% (+11.9)#33 | 5.0% (+11.9)#1,496 |
| 34. | 50139 | 16.9% | 5.0% (+11.9)#34 | 5.0% (+11.9)#1,500 |
| 35. | 50631 | 16.8% | 5.0% (+11.8)#35 | 5.0% (+11.8)#1,513 |
| 36. | 50861 | 16.7% | 5.0% (+11.7)#36 | 5.0% (+11.7)#1,549 |
| 37. | 50277 | 16.5% | 5.0% (+11.6)#37 | 5.0% (+11.5)#1,589 |
| 38. | 50264 | 16.4% | 5.0% (+11.4)#38 | 5.0% (+11.4)#1,623 |
| 39. | 52326 | 16.3% | 5.0% (+11.3)#39 | 5.0% (+11.3)#1,640 |
| 40. | 52570 | 16.2% | 5.0% (+11.2)#40 | 5.0% (+11.2)#1,674 |
| 41. | 50625 | 16.0% | 5.0% (+11.0)#41 | 5.0% (+11.0)#1,714 |
| 42. | 52164 | 15.9% | 5.0% (+10.9)#42 | 5.0% (+10.9)#1,742 |
| 43. | 51556 | 15.9% | 5.0% (+10.9)#43 | 5.0% (+10.9)#1,751 |
| 44. | 51014 | 15.9% | 5.0% (+10.9)#44 | 5.0% (+10.9)#1,754 |
| 45. | 51647 | 15.8% | 5.0% (+10.8)#45 | 5.0% (+10.8)#1,767 |
| 46. | 51363 | 15.8% | 5.0% (+10.8)#46 | 5.0% (+10.8)#1,771 |
| 47. | 50518 | 15.8% | 5.0% (+10.8)#47 | 5.0% (+10.8)#1,779 |
| 48. | 52755 | 15.6% | 5.0% (+10.6)#48 | 5.0% (+10.6)#1,824 |
| 49. | 52756 | 15.3% | 5.0% (+10.4)#49 | 5.0% (+10.3)#1,894 |
| 50. | 51343 | 15.3% | 5.0% (+10.4)#50 | 5.0% (+10.3)#1,897 |
| 51. | 52075 | 15.3% | 5.0% (+10.3)#51 | 5.0% (+10.3)#1,929 |
| 52. | 52056 | 15.0% | 5.0% (+10.0)#52 | 5.0% (+10.0)#2,024 |
| 53. | 52720 | 14.9% | 5.0% (+9.96)#53 | 5.0% (+9.93)#2,052 |
| 54. | 52555 | 14.9% | 5.0% (+9.93)#54 | 5.0% (+9.90)#2,069 |
| 55. | 52651 | 14.9% | 5.0% (+9.92)#55 | 5.0% (+9.88)#2,076 |
| 56. | 51047 | 14.9% | 5.0% (+9.91)#56 | 5.0% (+9.88)#2,078 |
| 57. | 50241 | 14.9% | 5.0% (+9.90)#57 | 5.0% (+9.87)#2,083 |
| 58. | 50218 | 14.8% | 5.0% (+9.87)#58 | 5.0% (+9.84)#2,090 |
| 59. | 52154 | 14.6% | 5.0% (+9.67)#59 | 5.0% (+9.64)#2,181 |
| 60. | 52079 | 14.6% | 5.0% (+9.63)#60 | 5.0% (+9.60)#2,202 |
| 61. | 52223 | 14.5% | 5.0% (+9.57)#61 | 5.0% (+9.54)#2,227 |
| 62. | 50118 | 14.5% | 5.0% (+9.54)#62 | 5.0% (+9.51)#2,241 |
| 63. | 52332 | 14.4% | 5.0% (+9.48)#63 | 5.0% (+9.44)#2,265 |
| 64. | 50476 | 14.3% | 5.0% (+9.37)#64 | 5.0% (+9.33)#2,301 |
| 65. | 51006 | 14.0% | 5.0% (+9.00)#65 | 5.0% (+8.96)#2,481 |
| 66. | 50034 | 13.9% | 5.0% (+8.90)#66 | 5.0% (+8.87)#2,527 |
| 67. | 52590 | 13.9% | 5.0% (+8.89)#67 | 5.0% (+8.86)#2,530 |
| 68. | 52549 | 13.8% | 5.0% (+8.86)#68 | 5.0% (+8.83)#2,536 |
| 69. | 50128 | 13.8% | 5.0% (+8.83)#69 | 5.0% (+8.80)#2,549 |
| 70. | 52330 | 13.8% | 5.0% (+8.80)#70 | 5.0% (+8.76)#2,565 |
| 71. | 51358 | 13.7% | 5.0% (+8.72)#71 | 5.0% (+8.68)#2,616 |
| 72. | 50522 | 13.6% | 5.0% (+8.64)#72 | 5.0% (+8.61)#2,656 |
| 73. | 52042 | 13.4% | 5.0% (+8.42)#73 | 5.0% (+8.38)#2,761 |
| 74. | 52170 | 13.2% | 5.0% (+8.27)#74 | 5.0% (+8.24)#2,826 |
| 75. | 52315 | 13.2% | 5.0% (+8.26)#75 | 5.0% (+8.23)#2,830 |
| 76. | 52647 | 13.2% | 5.0% (+8.23)#76 | 5.0% (+8.19)#2,844 |
| 77. | 52035 | 13.2% | 5.0% (+8.22)#77 | 5.0% (+8.19)#2,845 |
| 78. | 52201 | 13.1% | 5.0% (+8.10)#78 | 5.0% (+8.06)#2,902 |
| 79. | 50847 | 13.0% | 5.0% (+8.08)#79 | 5.0% (+8.05)#2,914 |
| 80. | 52156 | 13.0% | 5.0% (+8.07)#80 | 5.0% (+8.04)#2,920 |
| 81. | 52249 | 13.0% | 5.0% (+8.00)#81 | 5.0% (+7.96)#2,958 |
| 82. | 52362 | 12.9% | 5.0% (+7.99)#82 | 5.0% (+7.96)#2,961 |
| 83. | 50460 | 12.9% | 5.0% (+7.95)#83 | 5.0% (+7.92)#2,983 |
| 84. | 52038 | 12.9% | 5.0% (+7.91)#84 | 5.0% (+7.87)#3,010 |
| 85. | 50052 | 12.8% | 5.0% (+7.86)#85 | 5.0% (+7.83)#3,040 |
| 86. | 52639 | 12.8% | 5.0% (+7.84)#86 | 5.0% (+7.80)#3,051 |
| 87. | 50527 | 12.8% | 5.0% (+7.80)#87 | 5.0% (+7.77)#3,071 |
| 88. | 50467 | 12.7% | 5.0% (+7.77)#88 | 5.0% (+7.73)#3,094 |
| 89. | 50641 | 12.7% | 5.0% (+7.76)#89 | 5.0% (+7.73)#3,096 |
| 90. | 50229 | 12.7% | 5.0% (+7.72)#90 | 5.0% (+7.68)#3,134 |
| 91. | 52147 | 12.7% | 5.0% (+7.71)#91 | 5.0% (+7.68)#3,139 |
| 92. | 50249 | 12.6% | 5.0% (+7.68)#92 | 5.0% (+7.65)#3,159 |
| 93. | 50103 | 12.6% | 5.0% (+7.68)#93 | 5.0% (+7.64)#3,162 |
| 94. | 52305 | 12.6% | 5.0% (+7.66)#94 | 5.0% (+7.63)#3,173 |
| 95. | 52248 | 12.6% | 5.0% (+7.59)#95 | 5.0% (+7.56)#3,215 |
| 96. | 52161 | 12.5% | 5.0% (+7.59)#96 | 5.0% (+7.55)#3,219 |
| 97. | 51575 | 12.5% | 5.0% (+7.54)#97 | 5.0% (+7.51)#3,246 |
| 98. | 52048 | 12.5% | 5.0% (+7.54)#98 | 5.0% (+7.51)#3,258 |
| 99. | 52151 | 12.5% | 5.0% (+7.49)#99 | 5.0% (+7.46)#3,301 |
| 100. | 52635 | 12.4% | 5.0% (+7.48)#100 | 5.0% (+7.45)#3,310 |
Common Questions
What are the Top 10 Zip Codes with the Highest Percentage of Population Employed in Construction & Extraction in Iowa?
Top 10 Zip Codes with the Highest Percentage of Population Employed in Construction & Extraction in Iowa are:
What zip code has the Highest Percentage of Population Employed in Construction & Extraction in Iowa?
50835 has the Highest Percentage of Population Employed in Construction & Extraction in Iowa with 42.1%.
What is the Percentage of Population Employed in Construction & Extraction in the State of Iowa?
Percentage of Population Employed in Construction & Extraction in Iowa is 5.0%.
What is the Percentage of Population Employed in Construction & Extraction in the United States?
Percentage of Population Employed in Construction & Extraction in the United States is 5.0%.