Zip Codes with the Highest Percentage of Families with Income Above $200,000 in Iowa
RELATED REPORTS & OPTIONS
Family Income | $200k+
Iowa
Compare Zip Codes
Map of Zip Codes with the Highest Percentage of Families with Income Above $200,000 in Iowa
10.0%
50.0%
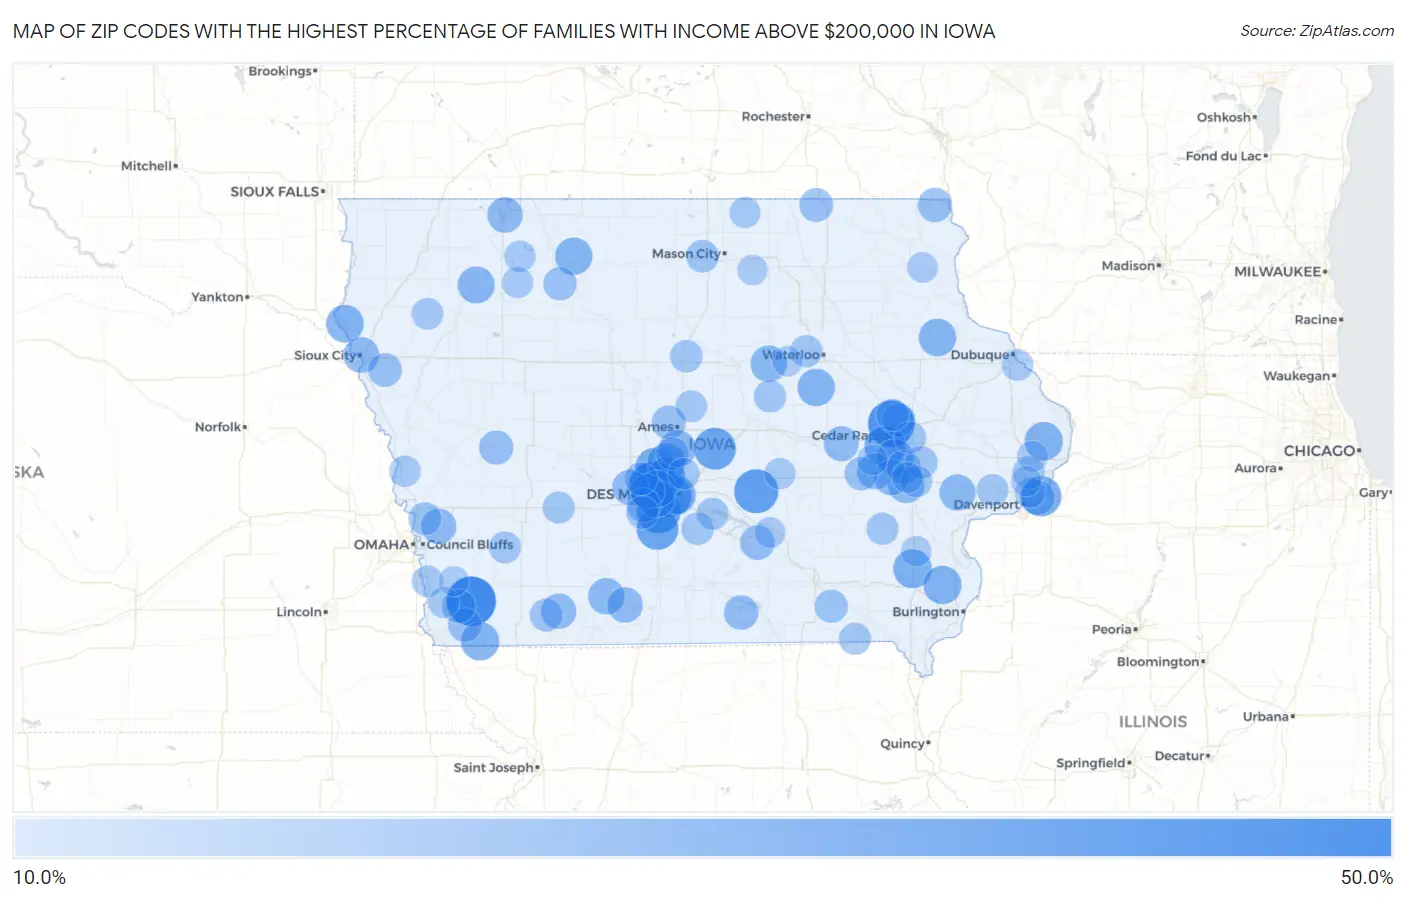
Zip Codes with the Highest Percentage of Families with Income Above $200,000 in Iowa
| Zip Code | Families with Income > $200k | vs State | vs National | |
| 1. | 51645 | 44.6% | 10.1%(+34.5)#1 | 14.8%(+29.8)#955 |
| 2. | 50323 | 44.4% | 10.1%(+34.3)#2 | 14.8%(+29.6)#965 |
| 3. | 52411 | 40.3% | 10.1%(+30.2)#3 | 14.8%(+25.5)#1,283 |
| 4. | 50137 | 36.4% | 10.1%(+26.3)#4 | 14.8%(+21.6)#1,697 |
| 5. | 50061 | 36.2% | 10.1%(+26.1)#5 | 14.8%(+21.4)#1,711 |
| 6. | 50312 | 34.4% | 10.1%(+24.3)#6 | 14.8%(+19.6)#1,914 |
| 7. | 50033 | 33.3% | 10.1%(+23.2)#7 | 14.8%(+18.5)#2,076 |
| 8. | 50055 | 33.2% | 10.1%(+23.1)#8 | 14.8%(+18.4)#2,089 |
| 9. | 52228 | 31.9% | 10.1%(+21.8)#9 | 14.8%(+17.1)#2,244 |
| 10. | 52767 | 30.8% | 10.1%(+20.7)#10 | 14.8%(+16.0)#2,411 |
| 11. | 50109 | 29.6% | 10.1%(+19.5)#11 | 14.8%(+14.8)#2,578 |
| 12. | 50309 | 28.7% | 10.1%(+18.6)#12 | 14.8%(+13.9)#2,735 |
| 13. | 52652 | 28.6% | 10.1%(+18.5)#13 | 14.8%(+13.8)#2,768 |
| 14. | 52750 | 27.9% | 10.1%(+17.8)#14 | 14.8%(+13.1)#2,885 |
| 15. | 51647 | 27.9% | 10.1%(+17.8)#15 | 14.8%(+13.1)#2,886 |
| 16. | 50226 | 27.7% | 10.1%(+17.6)#16 | 14.8%(+12.9)#2,917 |
| 17. | 52660 | 27.7% | 10.1%(+17.6)#17 | 14.8%(+12.9)#2,924 |
| 18. | 50131 | 27.3% | 10.1%(+17.2)#18 | 14.8%(+12.5)#2,996 |
| 19. | 51062 | 26.9% | 10.1%(+16.8)#19 | 14.8%(+12.1)#3,077 |
| 20. | 52050 | 26.8% | 10.1%(+16.7)#20 | 14.8%(+12.0)#3,099 |
| 21. | 50612 | 26.7% | 10.1%(+16.6)#21 | 14.8%(+11.9)#3,117 |
| 22. | 50266 | 26.6% | 10.1%(+16.5)#22 | 14.8%(+11.8)#3,124 |
| 23. | 50528 | 26.5% | 10.1%(+16.4)#23 | 14.8%(+11.7)#3,155 |
| 24. | 50124 | 26.2% | 10.1%(+16.1)#24 | 14.8%(+11.4)#3,200 |
| 25. | 50325 | 26.0% | 10.1%(+15.9)#25 | 14.8%(+11.2)#3,246 |
| 26. | 52338 | 26.0% | 10.1%(+15.9)#26 | 14.8%(+11.2)#3,254 |
| 27. | 51047 | 26.0% | 10.1%(+15.9)#27 | 14.8%(+11.2)#3,257 |
| 28. | 50642 | 25.3% | 10.1%(+15.2)#28 | 14.8%(+10.5)#3,399 |
| 29. | 52246 | 25.0% | 10.1%(+14.9)#29 | 14.8%(+10.2)#3,459 |
| 30. | 50861 | 25.0% | 10.1%(+14.9)#30 | 14.8%(+10.2)#3,481 |
| 31. | 52720 | 24.9% | 10.1%(+14.8)#31 | 14.8%(+10.1)#3,510 |
| 32. | 52236 | 24.6% | 10.1%(+14.5)#32 | 14.8%(+9.80)#3,583 |
| 33. | 51101 | 24.1% | 10.1%(+14.0)#33 | 14.8%(+9.30)#3,688 |
| 34. | 50003 | 23.9% | 10.1%(+13.8)#34 | 14.8%(+9.10)#3,736 |
| 35. | 52322 | 23.8% | 10.1%(+13.7)#35 | 14.8%(+9.00)#3,774 |
| 36. | 51355 | 23.8% | 10.1%(+13.7)#36 | 14.8%(+9.00)#3,776 |
| 37. | 50074 | 23.7% | 10.1%(+13.6)#37 | 14.8%(+8.90)#3,799 |
| 38. | 51576 | 23.5% | 10.1%(+13.4)#38 | 14.8%(+8.70)#3,837 |
| 39. | 50862 | 23.5% | 10.1%(+13.4)#39 | 14.8%(+8.70)#3,846 |
| 40. | 52257 | 23.0% | 10.1%(+12.9)#40 | 14.8%(+8.20)#3,962 |
| 41. | 50256 | 22.7% | 10.1%(+12.6)#41 | 14.8%(+7.90)#4,029 |
| 42. | 52722 | 22.6% | 10.1%(+12.5)#42 | 14.8%(+7.80)#4,036 |
| 43. | 52581 | 22.5% | 10.1%(+12.4)#43 | 14.8%(+7.70)#4,100 |
| 44. | 50263 | 22.4% | 10.1%(+12.3)#44 | 14.8%(+7.60)#4,112 |
| 45. | 52160 | 22.1% | 10.1%(+12.0)#45 | 14.8%(+7.30)#4,197 |
| 46. | 51454 | 21.8% | 10.1%(+11.7)#46 | 14.8%(+7.00)#4,282 |
| 47. | 52317 | 21.7% | 10.1%(+11.6)#47 | 14.8%(+6.90)#4,299 |
| 48. | 50014 | 21.5% | 10.1%(+11.4)#48 | 14.8%(+6.70)#4,354 |
| 49. | 50038 | 21.4% | 10.1%(+11.3)#49 | 14.8%(+6.60)#4,392 |
| 50. | 51007 | 21.3% | 10.1%(+11.2)#50 | 14.8%(+6.50)#4,420 |
| 51. | 52134 | 21.3% | 10.1%(+11.2)#51 | 14.8%(+6.50)#4,424 |
| 52. | 51639 | 21.2% | 10.1%(+11.1)#52 | 14.8%(+6.40)#4,459 |
| 53. | 51649 | 21.1% | 10.1%(+11.0)#53 | 14.8%(+6.30)#4,489 |
| 54. | 50562 | 20.7% | 10.1%(+10.6)#54 | 14.8%(+5.90)#4,614 |
| 55. | 52220 | 20.7% | 10.1%(+10.6)#55 | 14.8%(+5.90)#4,615 |
| 56. | 52328 | 20.4% | 10.1%(+10.3)#56 | 14.8%(+5.60)#4,696 |
| 57. | 50063 | 20.4% | 10.1%(+10.3)#57 | 14.8%(+5.60)#4,699 |
| 58. | 52560 | 20.4% | 10.1%(+10.3)#58 | 14.8%(+5.60)#4,710 |
| 59. | 51542 | 20.1% | 10.1%(+10.0)#59 | 14.8%(+5.30)#4,798 |
| 60. | 50244 | 20.0% | 10.1%(+9.90)#60 | 14.8%(+5.20)#4,824 |
| 61. | 50848 | 20.0% | 10.1%(+9.90)#61 | 14.8%(+5.20)#4,833 |
| 62. | 50428 | 19.6% | 10.1%(+9.50)#62 | 14.8%(+4.80)#4,949 |
| 63. | 52333 | 19.6% | 10.1%(+9.50)#63 | 14.8%(+4.80)#4,951 |
| 64. | 50271 | 19.5% | 10.1%(+9.40)#64 | 14.8%(+4.70)#4,990 |
| 65. | 50261 | 19.4% | 10.1%(+9.30)#65 | 14.8%(+4.60)#5,021 |
| 66. | 50001 | 19.4% | 10.1%(+9.30)#66 | 14.8%(+4.60)#5,032 |
| 67. | 50609 | 19.3% | 10.1%(+9.20)#67 | 14.8%(+4.50)#5,069 |
| 68. | 52403 | 19.2% | 10.1%(+9.10)#68 | 14.8%(+4.40)#5,082 |
| 69. | 50613 | 19.1% | 10.1%(+9.00)#69 | 14.8%(+4.30)#5,099 |
| 70. | 52756 | 19.1% | 10.1%(+9.00)#70 | 14.8%(+4.30)#5,130 |
| 71. | 52341 | 19.1% | 10.1%(+9.00)#71 | 14.8%(+4.30)#5,131 |
| 72. | 52359 | 19.0% | 10.1%(+8.90)#72 | 14.8%(+4.20)#5,166 |
| 73. | 52542 | 18.9% | 10.1%(+8.80)#73 | 14.8%(+4.10)#5,221 |
| 74. | 50002 | 18.8% | 10.1%(+8.70)#74 | 14.8%(+4.00)#5,253 |
| 75. | 50252 | 18.8% | 10.1%(+8.70)#75 | 14.8%(+4.00)#5,263 |
| 76. | 52245 | 18.7% | 10.1%(+8.60)#76 | 14.8%(+3.90)#5,284 |
| 77. | 51535 | 18.7% | 10.1%(+8.60)#77 | 14.8%(+3.90)#5,305 |
| 78. | 52769 | 18.4% | 10.1%(+8.30)#78 | 14.8%(+3.60)#5,438 |
| 79. | 50021 | 18.3% | 10.1%(+8.20)#79 | 14.8%(+3.50)#5,451 |
| 80. | 50236 | 18.3% | 10.1%(+8.20)#80 | 14.8%(+3.50)#5,469 |
| 81. | 51035 | 18.3% | 10.1%(+8.20)#81 | 14.8%(+3.50)#5,470 |
| 82. | 52003 | 18.0% | 10.1%(+7.90)#82 | 14.8%(+3.20)#5,574 |
| 83. | 51561 | 17.9% | 10.1%(+7.80)#83 | 14.8%(+3.10)#5,623 |
| 84. | 51333 | 17.8% | 10.1%(+7.70)#84 | 14.8%(+3.00)#5,666 |
| 85. | 51557 | 17.7% | 10.1%(+7.60)#85 | 14.8%(+2.90)#5,707 |
| 86. | 51366 | 17.7% | 10.1%(+7.60)#86 | 14.8%(+2.90)#5,713 |
| 87. | 52241 | 17.6% | 10.1%(+7.50)#87 | 14.8%(+2.80)#5,728 |
| 88. | 50112 | 17.5% | 10.1%(+7.40)#88 | 14.8%(+2.70)#5,774 |
| 89. | 50426 | 17.4% | 10.1%(+7.30)#89 | 14.8%(+2.60)#5,846 |
| 90. | 51653 | 17.3% | 10.1%(+7.20)#90 | 14.8%(+2.50)#5,878 |
| 91. | 52742 | 17.2% | 10.1%(+7.10)#91 | 14.8%(+2.40)#5,904 |
| 92. | 50143 | 16.9% | 10.1%(+6.80)#92 | 14.8%(+2.10)#6,057 |
| 93. | 52203 | 16.8% | 10.1%(+6.70)#93 | 14.8%(+2.00)#6,094 |
| 94. | 52621 | 16.7% | 10.1%(+6.60)#94 | 14.8%(+1.90)#6,136 |
| 95. | 52156 | 16.7% | 10.1%(+6.60)#95 | 14.8%(+1.90)#6,140 |
| 96. | 52807 | 16.6% | 10.1%(+6.50)#96 | 14.8%(+1.80)#6,173 |
| 97. | 50624 | 16.5% | 10.1%(+6.40)#97 | 14.8%(+1.70)#6,231 |
| 98. | 50468 | 16.5% | 10.1%(+6.40)#98 | 14.8%(+1.70)#6,233 |
| 99. | 52748 | 16.4% | 10.1%(+6.30)#99 | 14.8%(+1.60)#6,255 |
| 100. | 51551 | 16.4% | 10.1%(+6.30)#100 | 14.8%(+1.60)#6,271 |
Common Questions
What are the Top 10 Zip Codes with the Highest Percentage of Families with Income Above $200,000 in Iowa?
Top 10 Zip Codes with the Highest Percentage of Families with Income Above $200,000 in Iowa are:
What zip code has the Highest Percentage of Families with Income Above $200,000 in Iowa?
51645 has the Highest Percentage of Families with Income Above $200,000 in Iowa with 44.6%.
What is the Percentage of Families with Income Above $200,000 in the State of Iowa?
Percentage of Families with Income Above $200,000 in Iowa is 10.1%.
What is the Percentage of Families with Income Above $200,000 in the United States?
Percentage of Families with Income Above $200,000 in the United States is 14.8%.