Ferndale, FL Map & Demographics
Ferndale Map
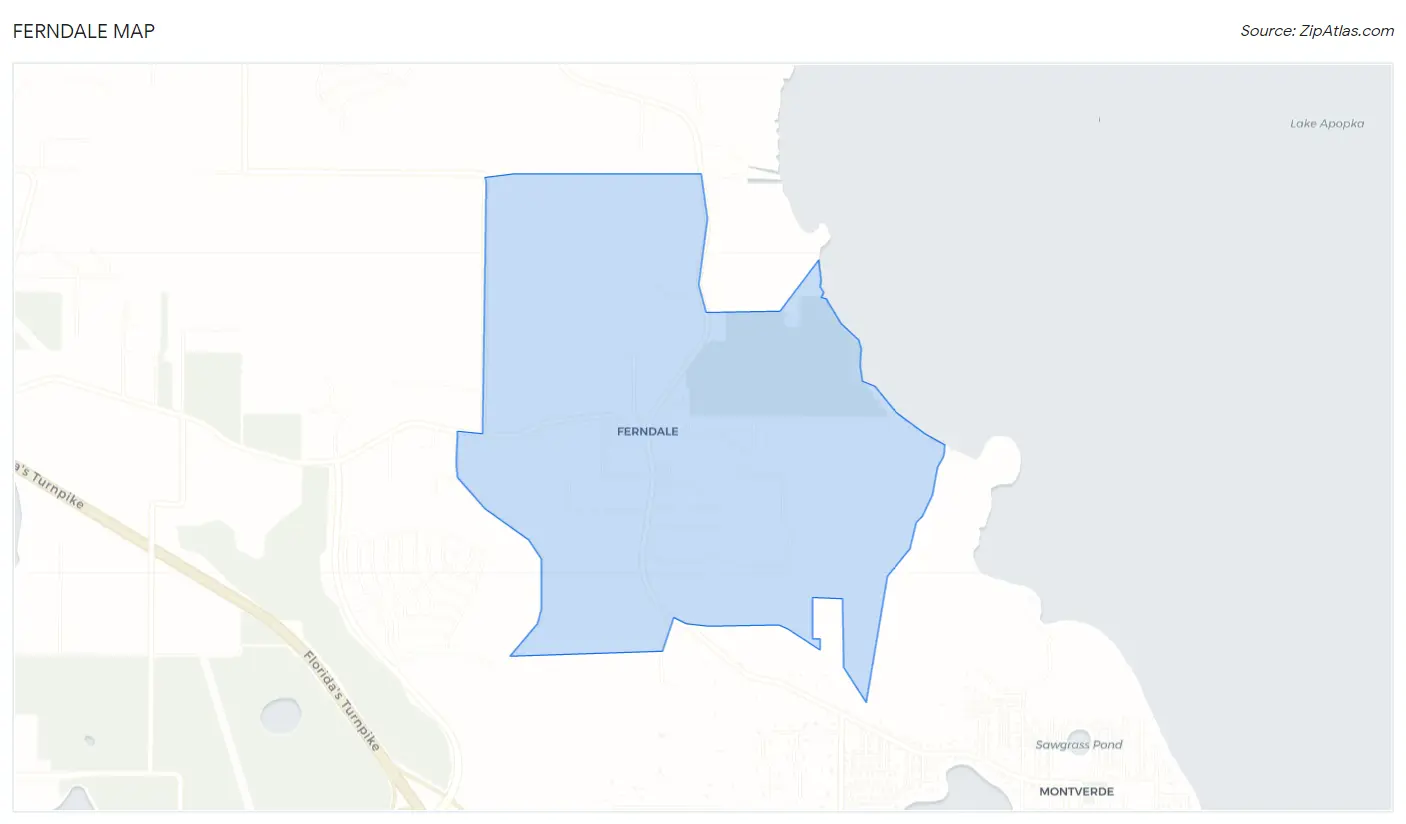
Ferndale Overview
$45,348
PER CAPITA INCOME
$135,809
AVG FAMILY INCOME
5.1%
WAGE / INCOME GAP [ % ]
94.9¢/ $1
WAGE / INCOME GAP [ $ ]
0.33
INEQUALITY / GINI INDEX
612
TOTAL POPULATION
280
MALE POPULATION
332
FEMALE POPULATION
84.34
MALES / 100 FEMALES
118.57
FEMALES / 100 MALES
47.5
MEDIAN AGE
3.5
AVG FAMILY SIZE
2.9
AVG HOUSEHOLD SIZE
407
LABOR FORCE [ PEOPLE ]
75.9%
PERCENT IN LABOR FORCE
Ferndale Zip Codes
Ferndale Area Codes
Income in Ferndale
Income Overview in Ferndale
| Characteristic | Number | Measure |
| Per Capita Income | 612 | $45,348 |
| Median Family Income | 164 | $135,809 |
| Mean Family Income | 164 | $139,926 |
| Median Household Income | 208 | $0 |
| Mean Household Income | 208 | $126,341 |
| Income Deficit | 164 | $0 |
| Wage / Income Gap (%) | 612 | 5.14% |
| Wage / Income Gap ($) | 612 | 94.86¢ per $1 |
| Gini / Inequality Index | 612 | 0.33 |
Earnings by Sex in Ferndale
Average Earnings in Ferndale are $60,417, $62,024 for men and $58,836 for women, a difference of 5.1%.
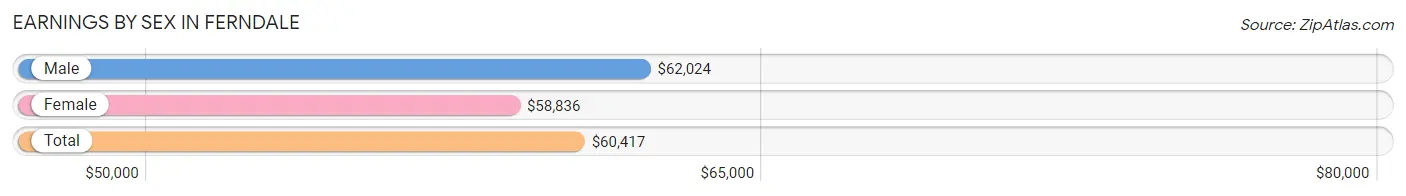
| Sex | Number | Average Earnings |
| Male | 226 (54.7%) | $62,024 |
| Female | 187 (45.3%) | $58,836 |
| Total | 413 (100.0%) | $60,417 |
Earnings by Sex by Income Bracket in Ferndale
The most common earnings brackets in Ferndale are $55,000 to $64,999 for men (55 | 24.3%) and $65,000 to $74,999 for women (44 | 23.5%).
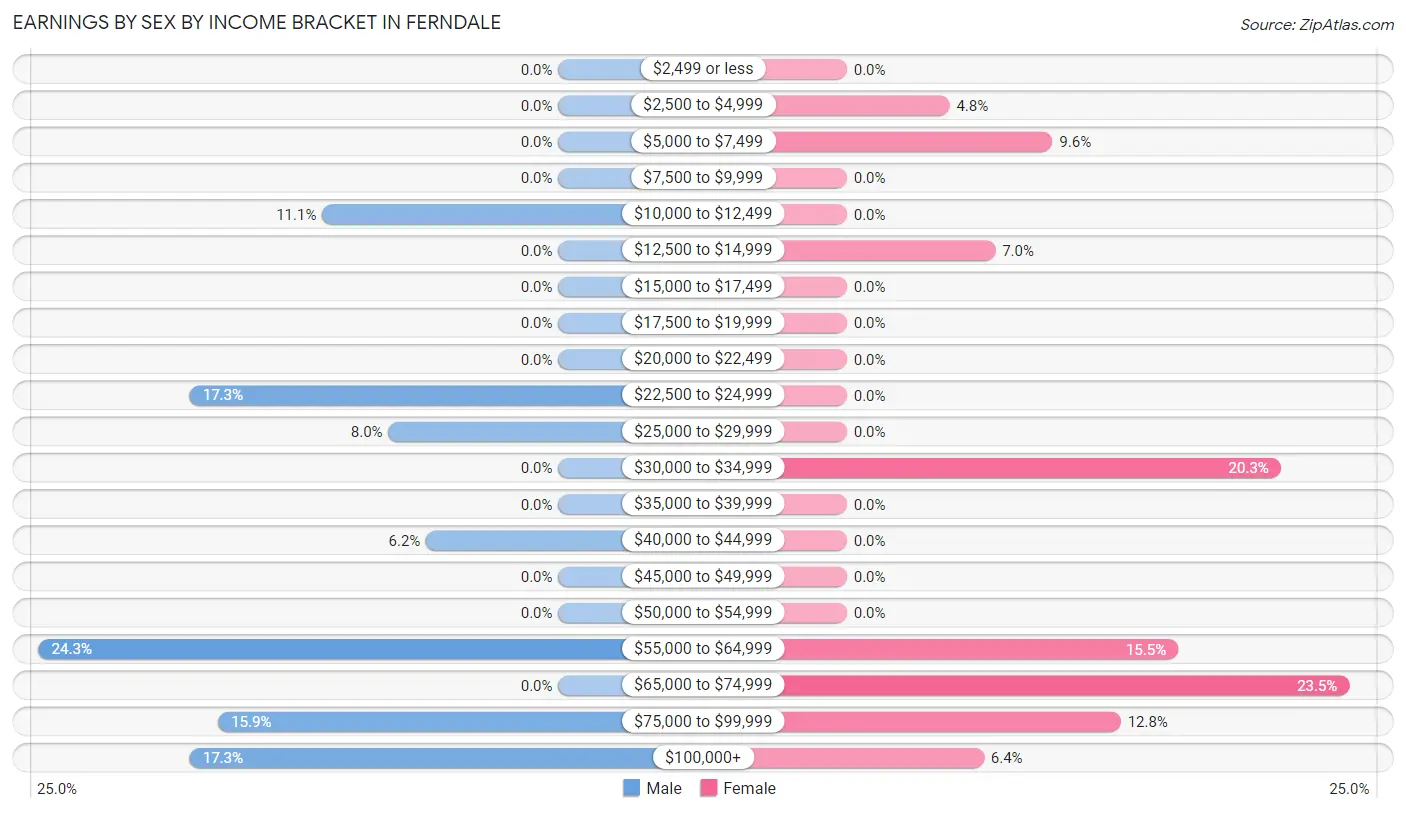
| Income | Male | Female |
| $2,499 or less | 0 (0.0%) | 0 (0.0%) |
| $2,500 to $4,999 | 0 (0.0%) | 9 (4.8%) |
| $5,000 to $7,499 | 0 (0.0%) | 18 (9.6%) |
| $7,500 to $9,999 | 0 (0.0%) | 0 (0.0%) |
| $10,000 to $12,499 | 25 (11.1%) | 0 (0.0%) |
| $12,500 to $14,999 | 0 (0.0%) | 13 (7.0%) |
| $15,000 to $17,499 | 0 (0.0%) | 0 (0.0%) |
| $17,500 to $19,999 | 0 (0.0%) | 0 (0.0%) |
| $20,000 to $22,499 | 0 (0.0%) | 0 (0.0%) |
| $22,500 to $24,999 | 39 (17.3%) | 0 (0.0%) |
| $25,000 to $29,999 | 18 (8.0%) | 0 (0.0%) |
| $30,000 to $34,999 | 0 (0.0%) | 38 (20.3%) |
| $35,000 to $39,999 | 0 (0.0%) | 0 (0.0%) |
| $40,000 to $44,999 | 14 (6.2%) | 0 (0.0%) |
| $45,000 to $49,999 | 0 (0.0%) | 0 (0.0%) |
| $50,000 to $54,999 | 0 (0.0%) | 0 (0.0%) |
| $55,000 to $64,999 | 55 (24.3%) | 29 (15.5%) |
| $65,000 to $74,999 | 0 (0.0%) | 44 (23.5%) |
| $75,000 to $99,999 | 36 (15.9%) | 24 (12.8%) |
| $100,000+ | 39 (17.3%) | 12 (6.4%) |
| Total | 226 (100.0%) | 187 (100.0%) |
Earnings by Sex by Educational Attainment in Ferndale
Average earnings in Ferndale are $63,640 for men and $58,836 for women, a difference of 7.5%. Men with an educational attainment of high school diploma enjoy the highest average annual earnings of $24,744, while those with high school diploma education earn the least with $24,744. Women with an educational attainment of high school diploma earn the most with the average annual earnings of $33,421, while those with high school diploma education have the smallest earnings of $33,421.
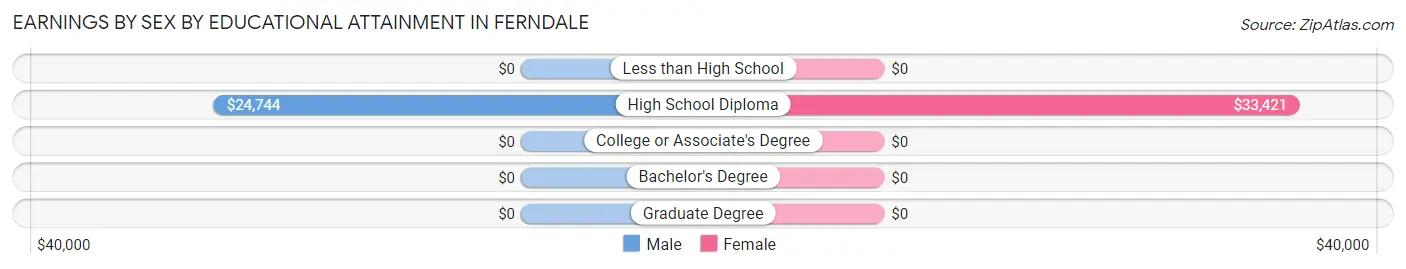
| Educational Attainment | Male Income | Female Income |
| Less than High School | - | - |
| High School Diploma | $24,744 | $33,421 |
| College or Associate's Degree | - | - |
| Bachelor's Degree | - | - |
| Graduate Degree | - | - |
| Total | $63,640 | $58,836 |
Family Income in Ferndale
Family Income Brackets in Ferndale
According to the Ferndale family income data, there are 47 families falling into the $150,000 to $199,999 income range, which is the most common income bracket and makes up 28.7% of all families.
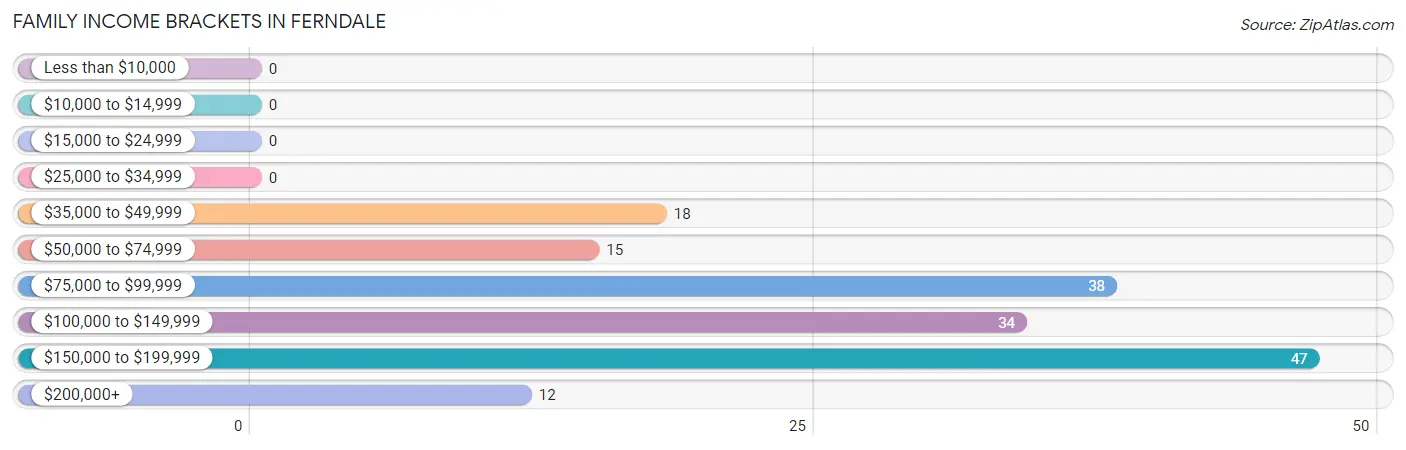
| Income Bracket | # Families | % Families |
| Less than $10,000 | 0 | 0.0% |
| $10,000 to $14,999 | 0 | 0.0% |
| $15,000 to $24,999 | 0 | 0.0% |
| $25,000 to $34,999 | 0 | 0.0% |
| $35,000 to $49,999 | 18 | 11.0% |
| $50,000 to $74,999 | 15 | 9.1% |
| $75,000 to $99,999 | 38 | 23.2% |
| $100,000 to $149,999 | 34 | 20.7% |
| $150,000 to $199,999 | 47 | 28.7% |
| $200,000+ | 12 | 7.3% |
Family Income by Famaliy Size in Ferndale
4-person families (75 | 45.7%) account for the highest median family income in Ferndale with $157,917 per family, while 4-person families (75 | 45.7%) have the highest median income of $39,479 per family member.
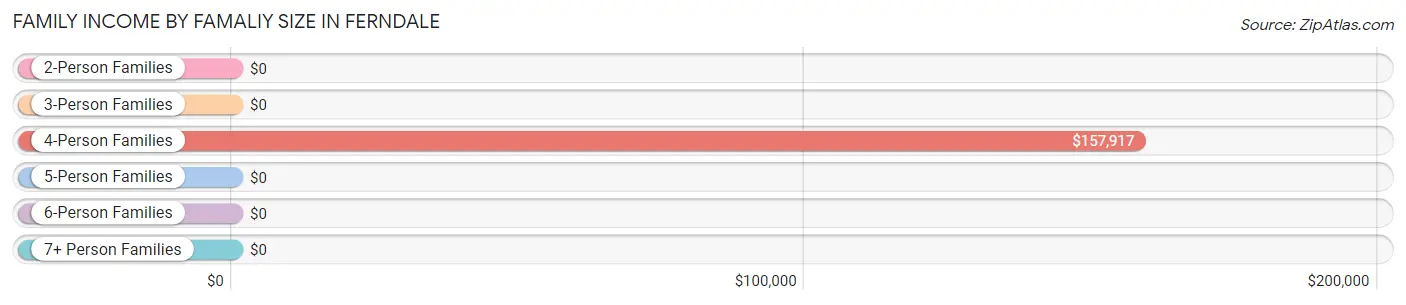
| Income Bracket | # Families | Median Income |
| 2-Person Families | 56 (34.2%) | $0 |
| 3-Person Families | 33 (20.1%) | $0 |
| 4-Person Families | 75 (45.7%) | $157,917 |
| 5-Person Families | 0 (0.0%) | $0 |
| 6-Person Families | 0 (0.0%) | $0 |
| 7+ Person Families | 0 (0.0%) | $0 |
| Total | 164 (100.0%) | $135,809 |
Family Income by Number of Earners in Ferndale
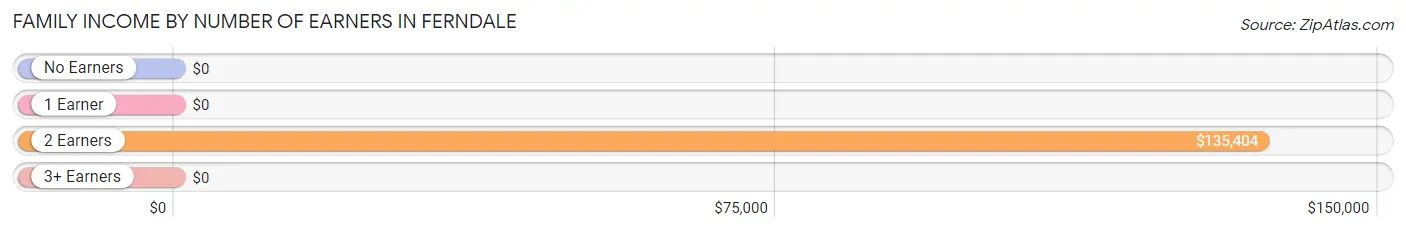
| Number of Earners | # Families | Median Income |
| No Earners | 0 (0.0%) | $0 |
| 1 Earner | 15 (9.1%) | $0 |
| 2 Earners | 123 (75.0%) | $135,404 |
| 3+ Earners | 26 (15.9%) | $0 |
| Total | 164 (100.0%) | $135,809 |
Household Income in Ferndale
Household Income Brackets in Ferndale
With 74 households falling in the category, the $75,000 to $99,999 income range is the most frequent in Ferndale, accounting for 35.6% of all households.
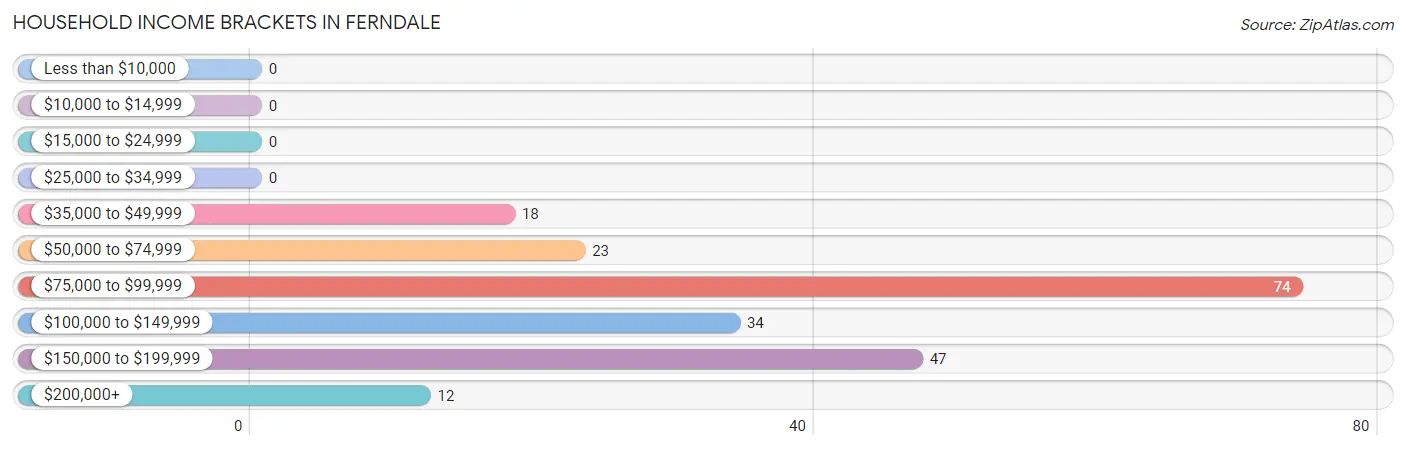
| Income Bracket | # Households | % Households |
| Less than $10,000 | 0 | 0.0% |
| $10,000 to $14,999 | 0 | 0.0% |
| $15,000 to $24,999 | 0 | 0.0% |
| $25,000 to $34,999 | 0 | 0.0% |
| $35,000 to $49,999 | 18 | 8.7% |
| $50,000 to $74,999 | 23 | 11.1% |
| $75,000 to $99,999 | 74 | 35.6% |
| $100,000 to $149,999 | 34 | 16.3% |
| $150,000 to $199,999 | 47 | 22.6% |
| $200,000+ | 12 | 5.8% |
Household Income by Householder Age in Ferndale
The median household income in Ferndale is $0, with the highest median household income of $197,688 found in the 25 to 44 years age bracket for the primary householder. A total of 61 households (29.3%) fall into this category.
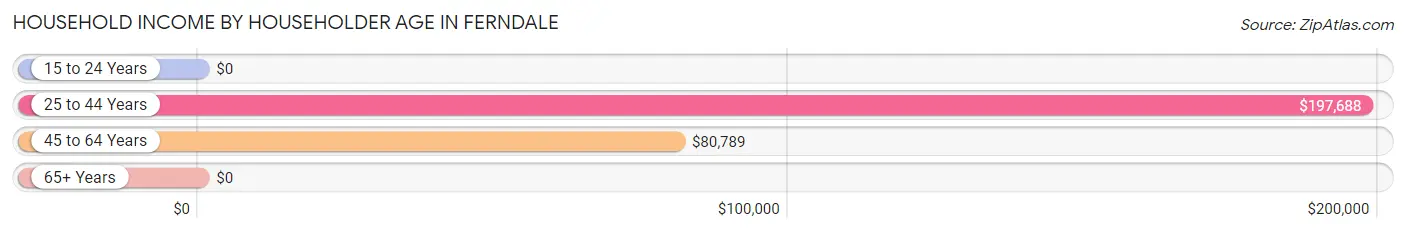
| Income Bracket | # Households | Median Income |
| 15 to 24 Years | 0 (0.0%) | $0 |
| 25 to 44 Years | 61 (29.3%) | $197,688 |
| 45 to 64 Years | 132 (63.5%) | $80,789 |
| 65+ Years | 15 (7.2%) | $0 |
| Total | 208 (100.0%) | $0 |
Poverty in Ferndale
Income Below Poverty by Sex and Age in Ferndale
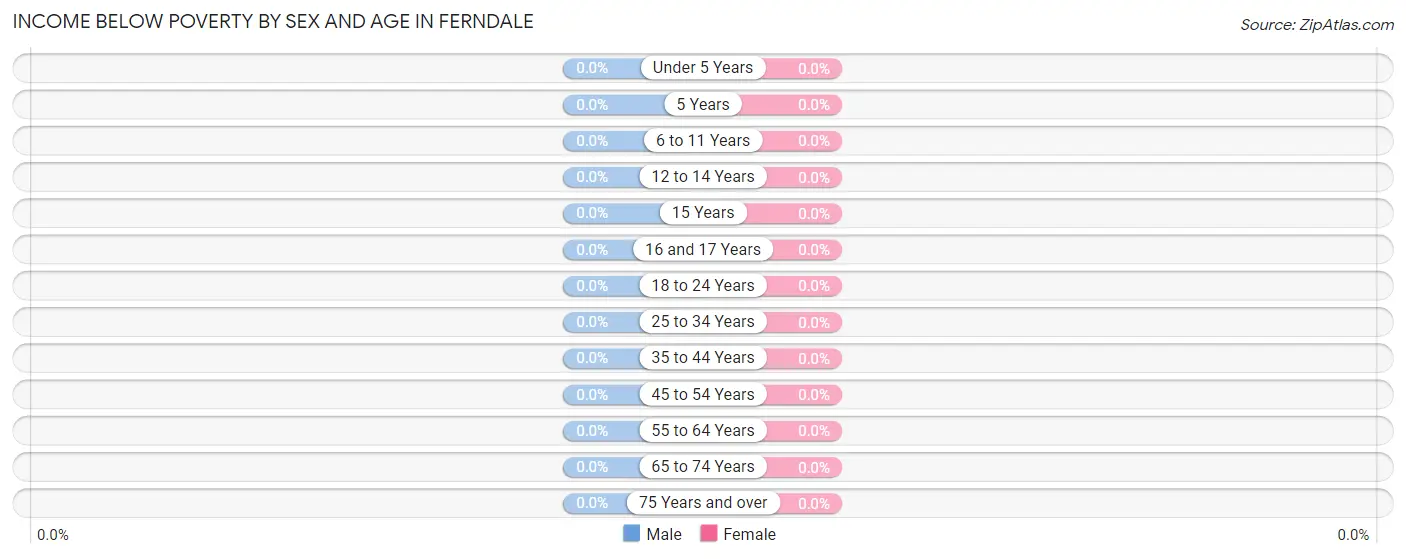
| Age Bracket | Male | Female |
| Under 5 Years | 0 (0.0%) | 0 (0.0%) |
| 5 Years | 0 (0.0%) | 0 (0.0%) |
| 6 to 11 Years | 0 (0.0%) | 0 (0.0%) |
| 12 to 14 Years | 0 (0.0%) | 0 (0.0%) |
| 15 Years | 0 (0.0%) | 0 (0.0%) |
| 16 and 17 Years | 0 (0.0%) | 0 (0.0%) |
| 18 to 24 Years | 0 (0.0%) | 0 (0.0%) |
| 25 to 34 Years | 0 (0.0%) | 0 (0.0%) |
| 35 to 44 Years | 0 (0.0%) | 0 (0.0%) |
| 45 to 54 Years | 0 (0.0%) | 0 (0.0%) |
| 55 to 64 Years | 0 (0.0%) | 0 (0.0%) |
| 65 to 74 Years | 0 (0.0%) | 0 (0.0%) |
| 75 Years and over | 0 (0.0%) | 0 (0.0%) |
| Total | 0 (0.0%) | 0 (0.0%) |
Income Above Poverty by Sex and Age in Ferndale
According to the poverty statistics in Ferndale, males aged 12 to 14 years and females aged 6 to 11 years are the age groups that are most secure financially, with 100.0% of males and 100.0% of females in these age groups living above the poverty line.
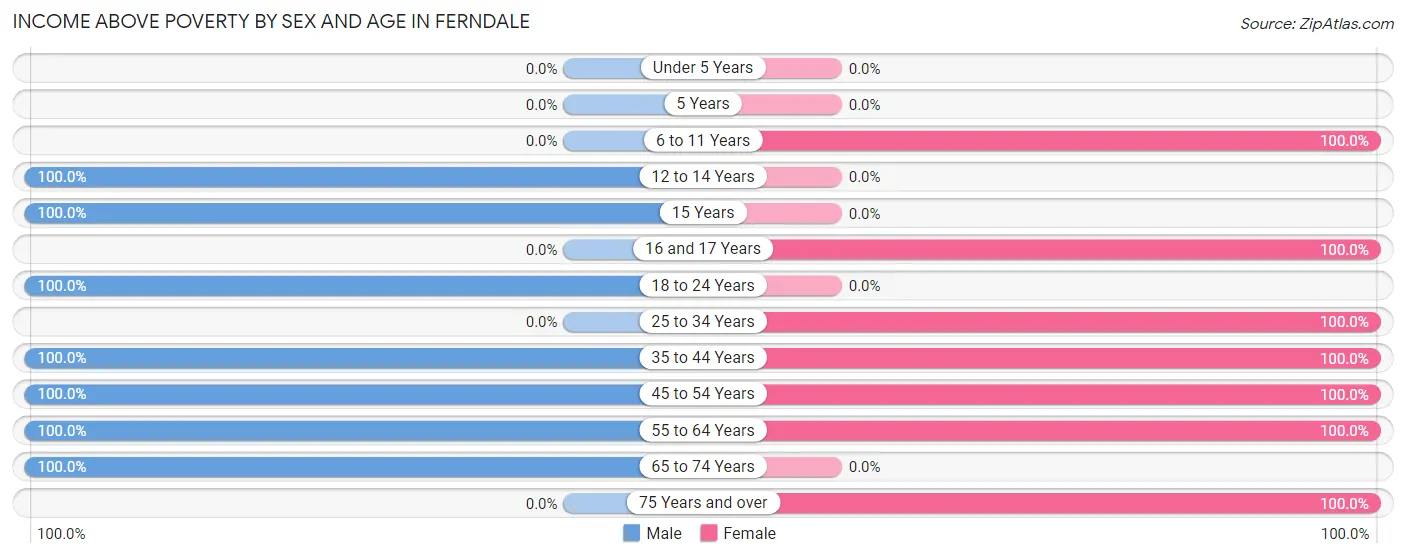
| Age Bracket | Male | Female |
| Under 5 Years | 0 (0.0%) | 0 (0.0%) |
| 5 Years | 0 (0.0%) | 0 (0.0%) |
| 6 to 11 Years | 0 (0.0%) | 40 (100.0%) |
| 12 to 14 Years | 16 (100.0%) | 0 (0.0%) |
| 15 Years | 20 (100.0%) | 0 (0.0%) |
| 16 and 17 Years | 0 (0.0%) | 90 (100.0%) |
| 18 to 24 Years | 39 (100.0%) | 0 (0.0%) |
| 25 to 34 Years | 0 (0.0%) | 21 (100.0%) |
| 35 to 44 Years | 41 (100.0%) | 33 (100.0%) |
| 45 to 54 Years | 31 (100.0%) | 68 (100.0%) |
| 55 to 64 Years | 94 (100.0%) | 65 (100.0%) |
| 65 to 74 Years | 39 (100.0%) | 0 (0.0%) |
| 75 Years and over | 0 (0.0%) | 15 (100.0%) |
| Total | 280 (100.0%) | 332 (100.0%) |
Income Below Poverty Among Married-Couple Families in Ferndale
| Children | Above Poverty | Below Poverty |
| No Children | 62 (100.0%) | 0 (0.0%) |
| 1 or 2 Children | 87 (100.0%) | 0 (0.0%) |
| 3 or 4 Children | 0 (0.0%) | 0 (0.0%) |
| 5 or more Children | 0 (0.0%) | 0 (0.0%) |
| Total | 149 (100.0%) | 0 (0.0%) |
Income Below Poverty Among Single-Parent Households in Ferndale
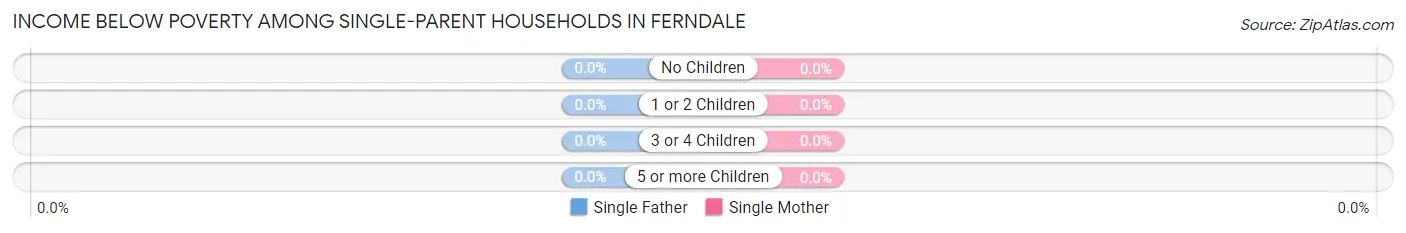
| Children | Single Father | Single Mother |
| No Children | 0 (0.0%) | 0 (0.0%) |
| 1 or 2 Children | 0 (0.0%) | 0 (0.0%) |
| 3 or 4 Children | 0 (0.0%) | 0 (0.0%) |
| 5 or more Children | 0 (0.0%) | 0 (0.0%) |
| Total | 0 (0.0%) | 0 (0.0%) |
Income Below Poverty Among Married-Couple vs Single-Parent Households in Ferndale
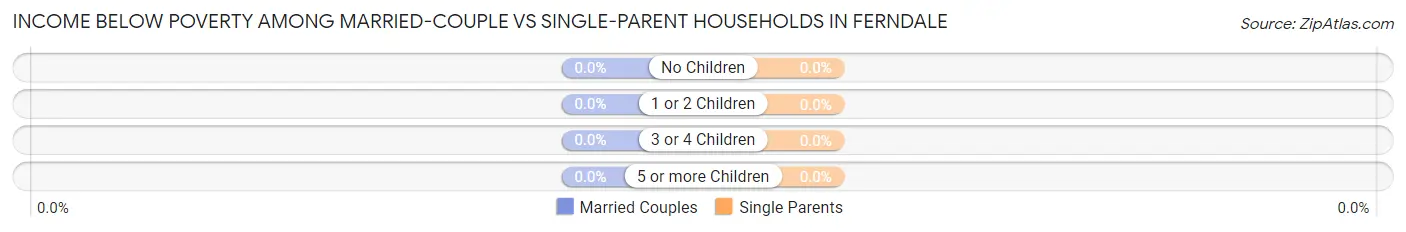
| Children | Married-Couple Families | Single-Parent Households |
| No Children | 0 (0.0%) | 0 (0.0%) |
| 1 or 2 Children | 0 (0.0%) | 0 (0.0%) |
| 3 or 4 Children | 0 (0.0%) | 0 (0.0%) |
| 5 or more Children | 0 (0.0%) | 0 (0.0%) |
| Total | 0 (0.0%) | 0 (0.0%) |
Race in Ferndale
The most populous races in Ferndale are White / Caucasian (596 | 97.4%), and Two or more Races (16 | 2.6%).
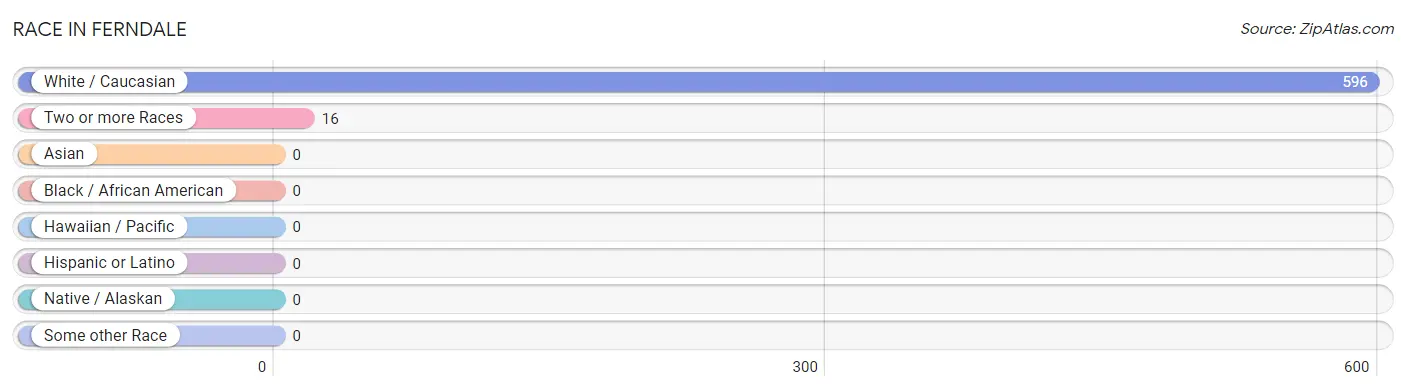
| Race | # Population | % Population |
| Asian | 0 | 0.0% |
| Black / African American | 0 | 0.0% |
| Hawaiian / Pacific | 0 | 0.0% |
| Hispanic or Latino | 0 | 0.0% |
| Native / Alaskan | 0 | 0.0% |
| White / Caucasian | 596 | 97.4% |
| Two or more Races | 16 | 2.6% |
| Some other Race | 0 | 0.0% |
| Total | 612 | 100.0% |
Ancestry in Ferndale
The most populous ancestries reported in Ferndale are American (269 | 44.0%), English (144 | 23.5%), German (55 | 9.0%), Irish (45 | 7.3%), and French Canadian (18 | 2.9%), together accounting for 86.8% of all Ferndale residents.
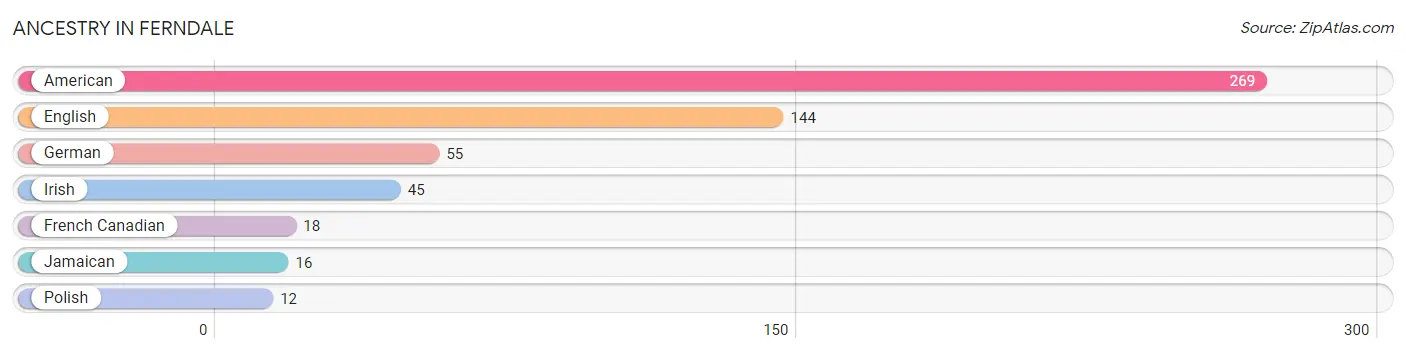
| Ancestry | # Population | % Population |
| American | 269 | 44.0% |
| English | 144 | 23.5% |
| French Canadian | 18 | 2.9% |
| German | 55 | 9.0% |
| Irish | 45 | 7.3% |
| Jamaican | 16 | 2.6% |
| Polish | 12 | 2.0% | View All 7 Rows |
Immigrants in Ferndale

| Immigration Origin | # Population | % Population | View All 0 Rows |
Sex and Age in Ferndale
Sex and Age in Ferndale
The most populous age groups in Ferndale are 55 to 59 Years (88 | 31.4%) for men and 15 to 19 Years (90 | 27.1%) for women.
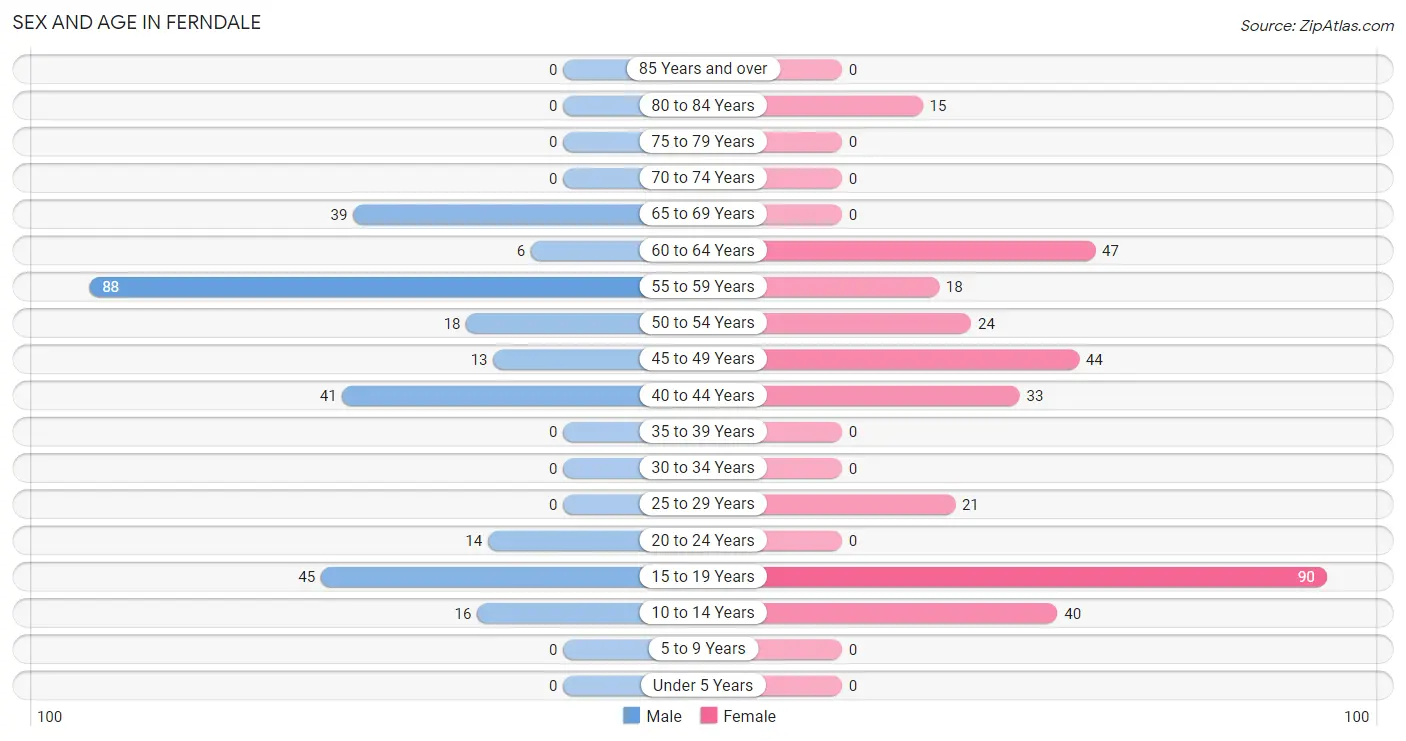
| Age Bracket | Male | Female |
| Under 5 Years | 0 (0.0%) | 0 (0.0%) |
| 5 to 9 Years | 0 (0.0%) | 0 (0.0%) |
| 10 to 14 Years | 16 (5.7%) | 40 (12.0%) |
| 15 to 19 Years | 45 (16.1%) | 90 (27.1%) |
| 20 to 24 Years | 14 (5.0%) | 0 (0.0%) |
| 25 to 29 Years | 0 (0.0%) | 21 (6.3%) |
| 30 to 34 Years | 0 (0.0%) | 0 (0.0%) |
| 35 to 39 Years | 0 (0.0%) | 0 (0.0%) |
| 40 to 44 Years | 41 (14.6%) | 33 (9.9%) |
| 45 to 49 Years | 13 (4.6%) | 44 (13.3%) |
| 50 to 54 Years | 18 (6.4%) | 24 (7.2%) |
| 55 to 59 Years | 88 (31.4%) | 18 (5.4%) |
| 60 to 64 Years | 6 (2.1%) | 47 (14.2%) |
| 65 to 69 Years | 39 (13.9%) | 0 (0.0%) |
| 70 to 74 Years | 0 (0.0%) | 0 (0.0%) |
| 75 to 79 Years | 0 (0.0%) | 0 (0.0%) |
| 80 to 84 Years | 0 (0.0%) | 15 (4.5%) |
| 85 Years and over | 0 (0.0%) | 0 (0.0%) |
| Total | 280 (100.0%) | 332 (100.0%) |
Families and Households in Ferndale
Median Family Size in Ferndale
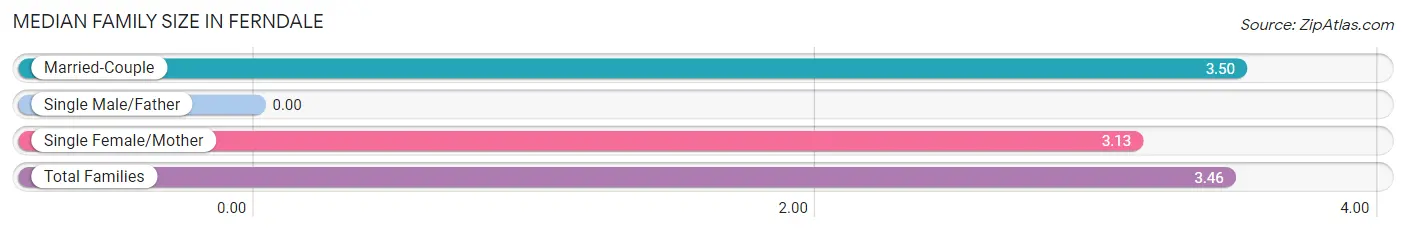
| Family Type | # Families | Family Size |
| Married-Couple | 149 (90.8%) | 3.50 |
| Single Male/Father | 0 (0.0%) | - |
| Single Female/Mother | 15 (9.1%) | 3.13 |
| Total Families | 164 (100.0%) | 3.46 |
Median Household Size in Ferndale
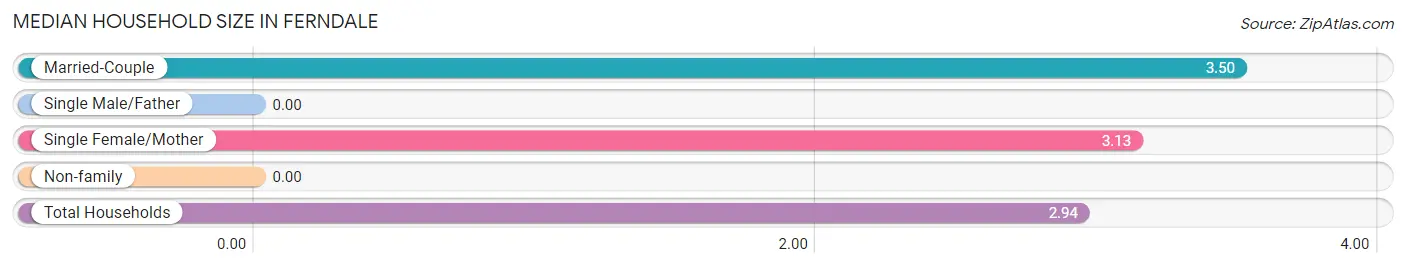
| Household Type | # Households | Household Size |
| Married-Couple | 149 (71.6%) | 3.50 |
| Single Male/Father | 0 (0.0%) | - |
| Single Female/Mother | 15 (7.2%) | 3.13 |
| Non-family | 44 (21.1%) | - |
| Total Households | 208 (100.0%) | 2.94 |
Household Size by Marriage Status in Ferndale
Out of a total of 208 households in Ferndale, 164 (78.8%) are family households, while 44 (21.1%) are nonfamily households. The most numerous type of family households are 4-person households, comprising 75, and the most common type of nonfamily households are 1-person households, comprising 44.
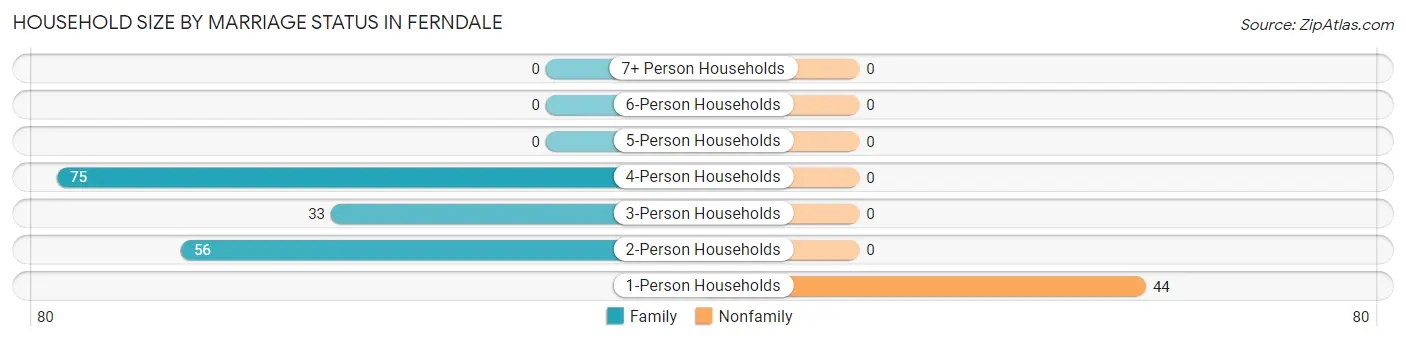
| Household Size | Family Households | Nonfamily Households |
| 1-Person Households | - | 44 (21.1%) |
| 2-Person Households | 56 (26.9%) | 0 (0.0%) |
| 3-Person Households | 33 (15.9%) | 0 (0.0%) |
| 4-Person Households | 75 (36.1%) | 0 (0.0%) |
| 5-Person Households | 0 (0.0%) | 0 (0.0%) |
| 6-Person Households | 0 (0.0%) | 0 (0.0%) |
| 7+ Person Households | 0 (0.0%) | 0 (0.0%) |
| Total | 164 (78.8%) | 44 (21.1%) |
Female Fertility in Ferndale
Fertility by Age in Ferndale
Average fertility rate in Ferndale is 61.0 births per 1,000 women. Women in the age bracket of 20 to 34 years have the highest fertility rate with 619.0 births per 1,000 women. Women in the age bracket of 20 to 34 years acount for 100.0% of all women with births.
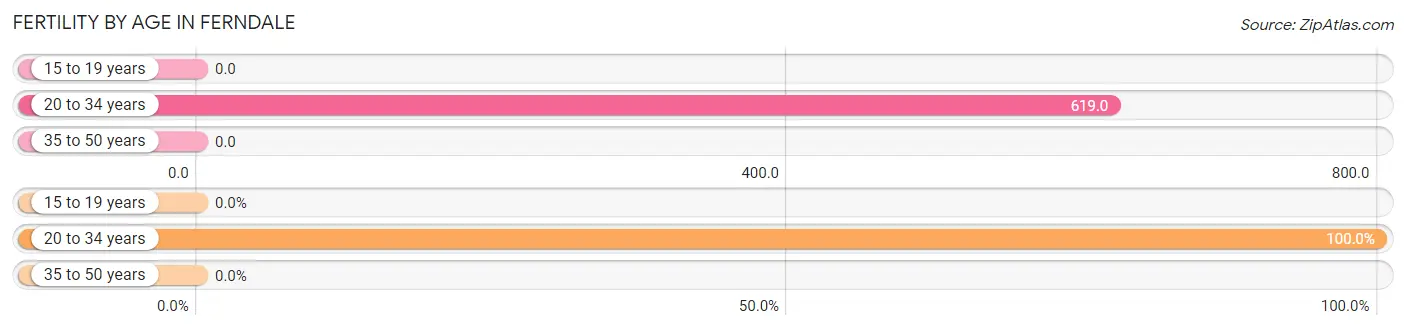
| Age Bracket | Women with Births | Births / 1,000 Women |
| 15 to 19 years | 0 (0.0%) | 0.0 |
| 20 to 34 years | 13 (100.0%) | 619.0 |
| 35 to 50 years | 0 (0.0%) | 0.0 |
| Total | 13 (100.0%) | 61.0 |
Fertility by Age by Marriage Status in Ferndale
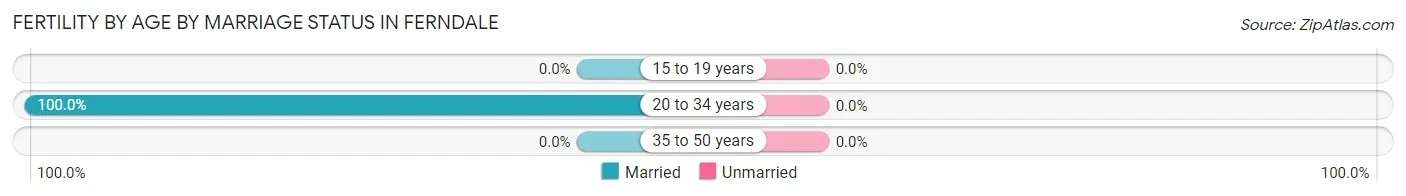
| Age Bracket | Married | Unmarried |
| 15 to 19 years | 0 (0.0%) | 0 (0.0%) |
| 20 to 34 years | 13 (100.0%) | 0 (0.0%) |
| 35 to 50 years | 0 (0.0%) | 0 (0.0%) |
| Total | 13 (100.0%) | 0 (0.0%) |
Fertility by Education in Ferndale
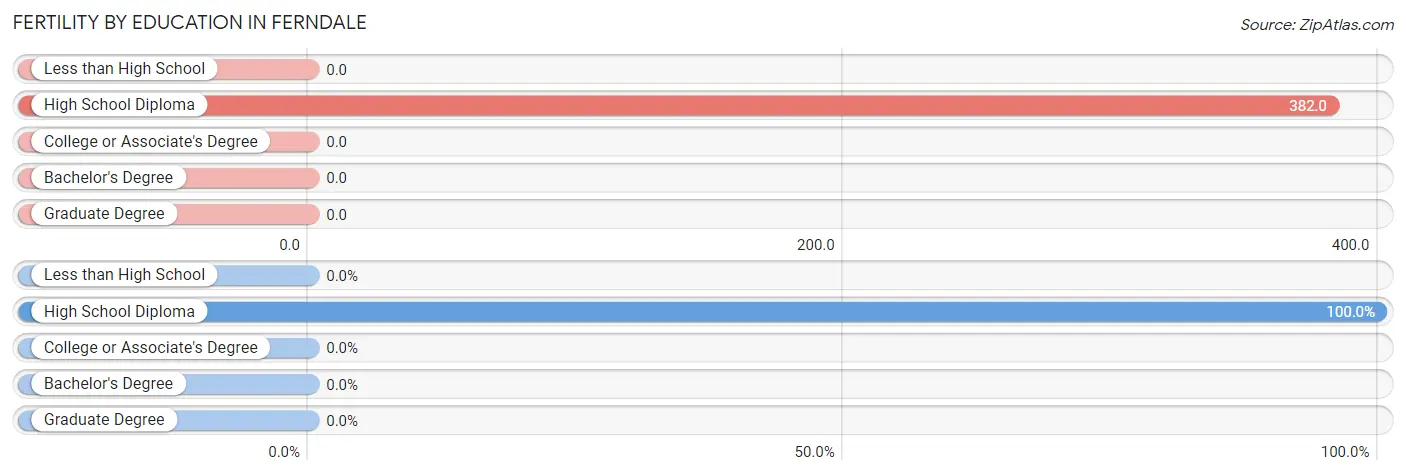
| Educational Attainment | Women with Births | Births / 1,000 Women |
| Less than High School | 0 (0.0%) | 0.0 |
| High School Diploma | 13 (100.0%) | 382.0 |
| College or Associate's Degree | 0 (0.0%) | 0.0 |
| Bachelor's Degree | 0 (0.0%) | 0.0 |
| Graduate Degree | 0 (0.0%) | 0.0 |
| Total | 13 (100.0%) | 61.0 |
Fertility by Education by Marriage Status in Ferndale
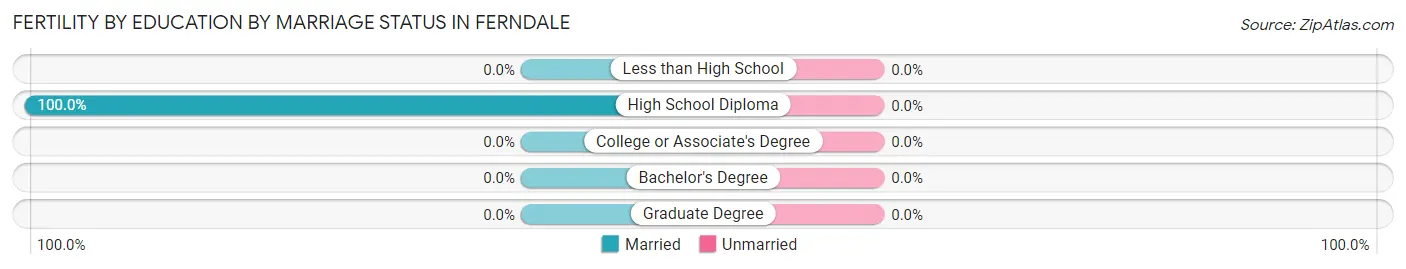
| Educational Attainment | Married | Unmarried |
| Less than High School | 0 (0.0%) | 0 (0.0%) |
| High School Diploma | 13 (100.0%) | 0 (0.0%) |
| College or Associate's Degree | 0 (0.0%) | 0 (0.0%) |
| Bachelor's Degree | 0 (0.0%) | 0 (0.0%) |
| Graduate Degree | 0 (0.0%) | 0 (0.0%) |
| Total | 13 (100.0%) | 0 (0.0%) |
Employment Characteristics in Ferndale
Employment by Class of Employer in Ferndale
Among the 407 employed individuals in Ferndale, private company employees (207 | 50.9%), not-for-profit organizations (113 | 27.8%), and state government employees (44 | 10.8%) make up the most common classes of employment.
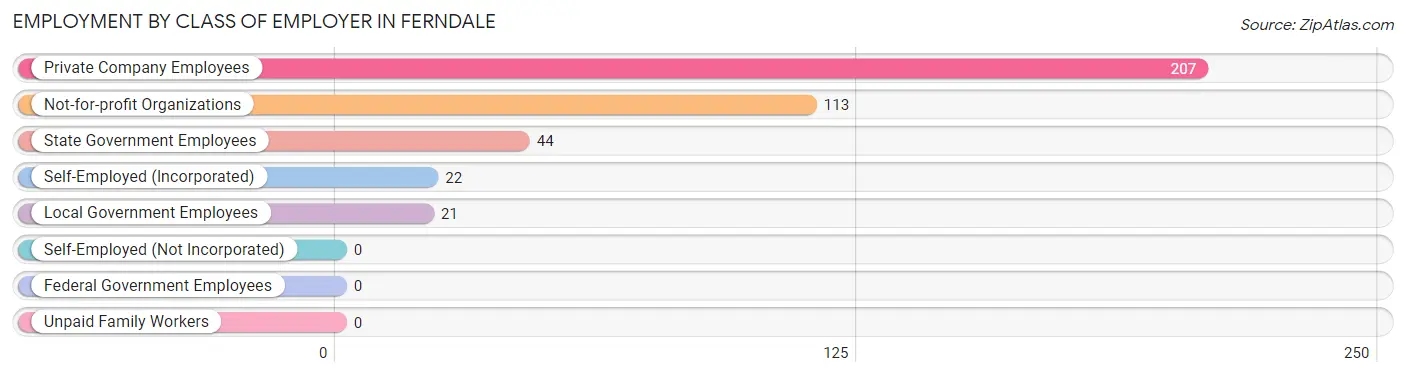
| Employer Class | # Employees | % Employees |
| Private Company Employees | 207 | 50.9% |
| Self-Employed (Incorporated) | 22 | 5.4% |
| Self-Employed (Not Incorporated) | 0 | 0.0% |
| Not-for-profit Organizations | 113 | 27.8% |
| Local Government Employees | 21 | 5.2% |
| State Government Employees | 44 | 10.8% |
| Federal Government Employees | 0 | 0.0% |
| Unpaid Family Workers | 0 | 0.0% |
| Total | 407 | 100.0% |
Employment Status by Age in Ferndale
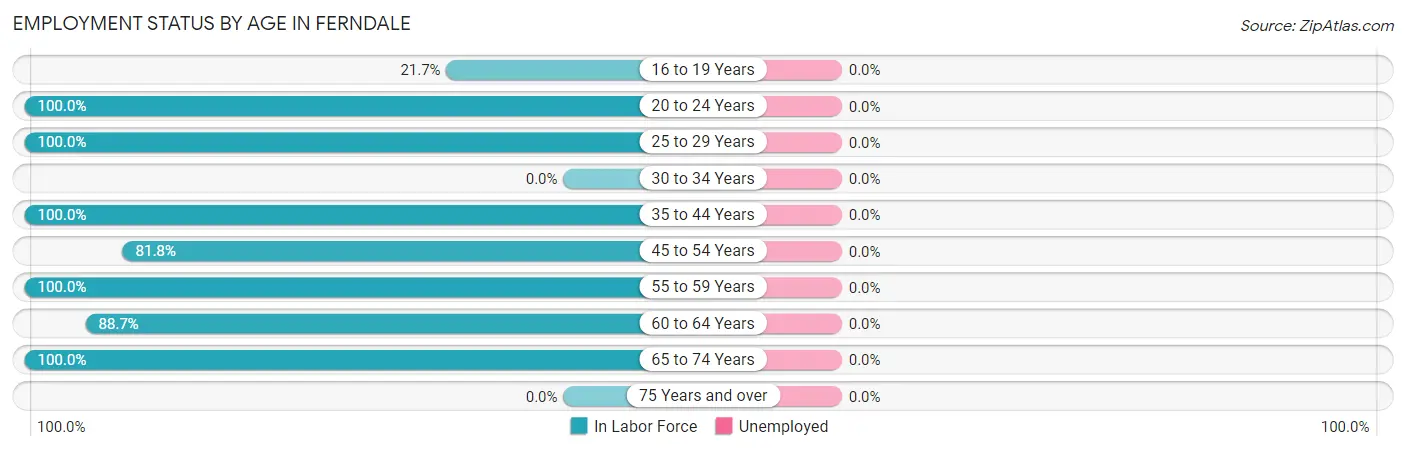
| Age Bracket | In Labor Force | Unemployed |
| 16 to 19 Years | 25 (21.7%) | 0 (0.0%) |
| 20 to 24 Years | 14 (100.0%) | 0 (0.0%) |
| 25 to 29 Years | 21 (100.0%) | 0 (0.0%) |
| 30 to 34 Years | 0 (0.0%) | 0 (0.0%) |
| 35 to 44 Years | 74 (100.0%) | 0 (0.0%) |
| 45 to 54 Years | 81 (81.8%) | 0 (0.0%) |
| 55 to 59 Years | 106 (100.0%) | 0 (0.0%) |
| 60 to 64 Years | 47 (88.7%) | 0 (0.0%) |
| 65 to 74 Years | 39 (100.0%) | 0 (0.0%) |
| 75 Years and over | 0 (0.0%) | 0 (0.0%) |
| Total | 407 (75.9%) | 0 (0.0%) |
Employment Status by Educational Attainment in Ferndale
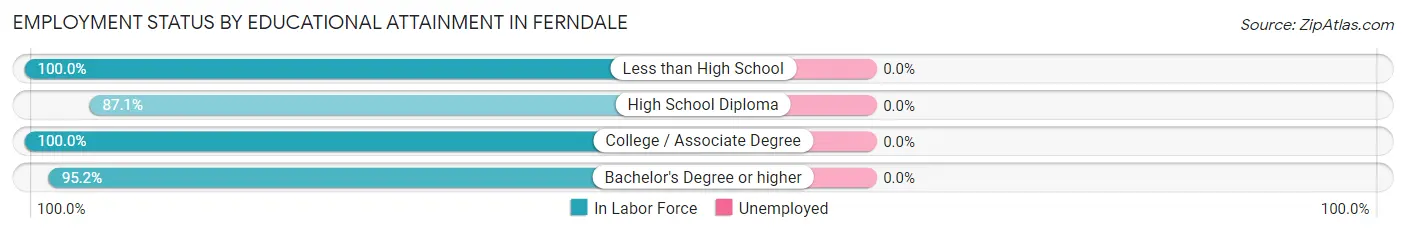
| Educational Attainment | In Labor Force | Unemployed |
| Less than High School | 36 (100.0%) | 0 (0.0%) |
| High School Diploma | 121 (87.1%) | 0 (0.0%) |
| College / Associate Degree | 54 (100.0%) | 0 (0.0%) |
| Bachelor's Degree or higher | 118 (95.2%) | 0 (0.0%) |
| Total | 329 (93.2%) | 0 (0.0%) |
Employment Occupations by Sex in Ferndale
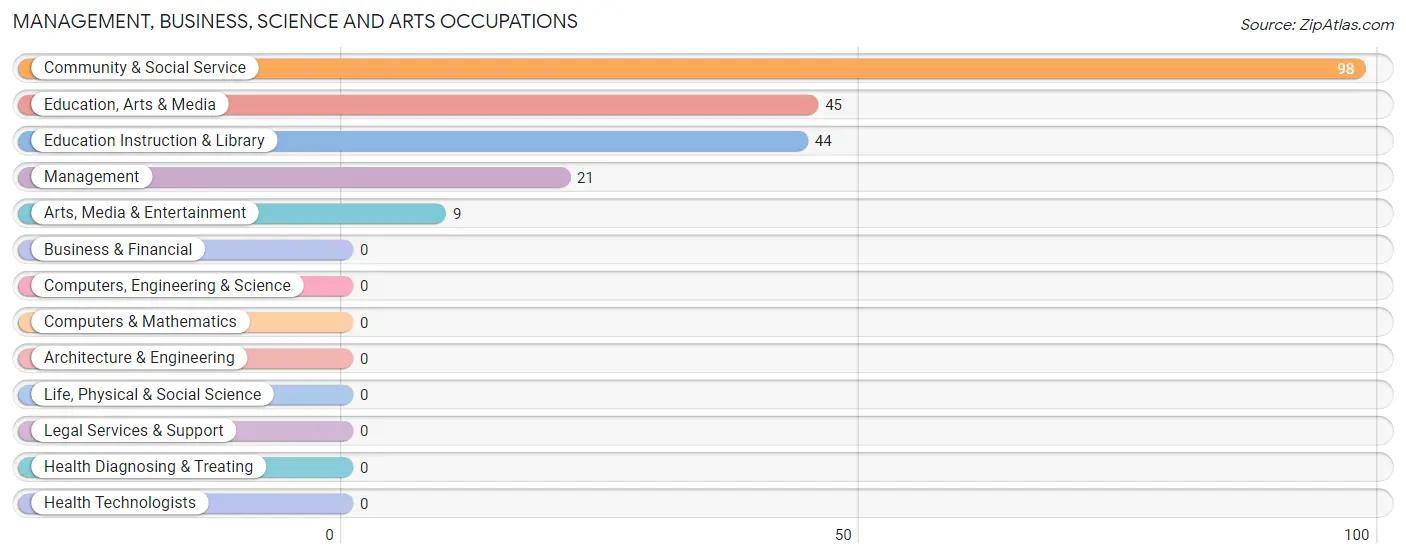
Management, Business, Science and Arts Occupations
The most common Management, Business, Science and Arts occupations in Ferndale are Community & Social Service (98 | 24.1%), Education, Arts & Media (45 | 11.1%), Education Instruction & Library (44 | 10.8%), Management (21 | 5.2%), and Arts, Media & Entertainment (9 | 2.2%).
Management, Business, Science and Arts Occupations by Sex
Within the Management, Business, Science and Arts occupations in Ferndale, the most male-oriented occupations are Education, Arts & Media (100.0%), and Community & Social Service (45.9%), while the most female-oriented occupations are Management (100.0%), Education Instruction & Library (100.0%), and Arts, Media & Entertainment (100.0%).
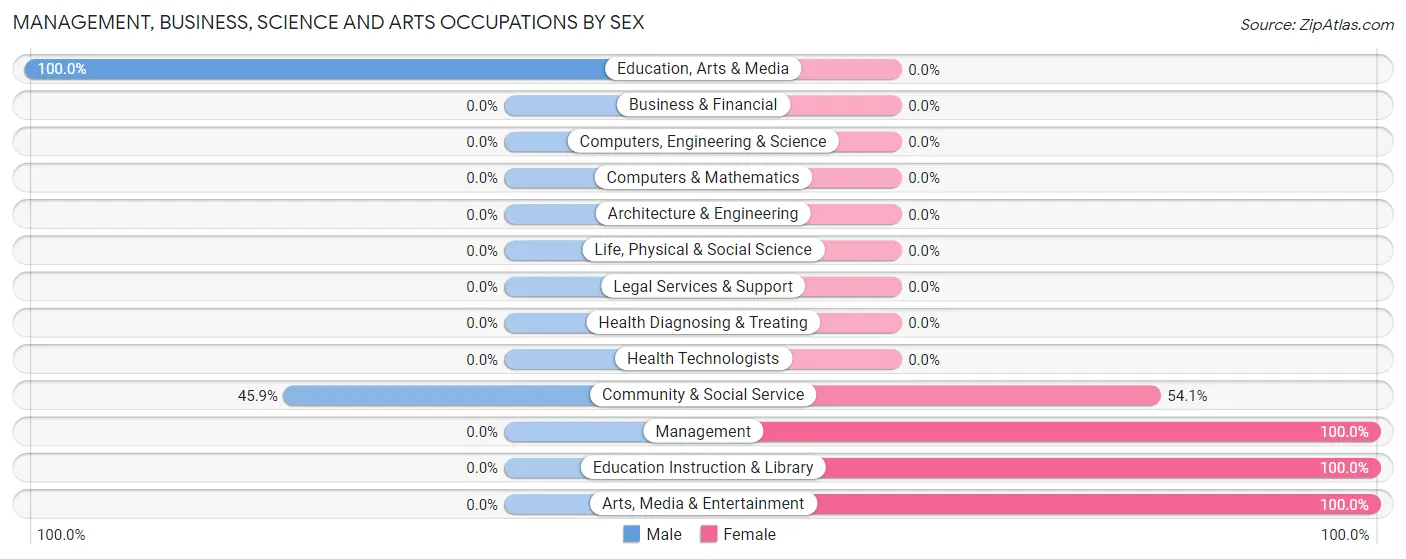
| Occupation | Male | Female |
| Management | 0 (0.0%) | 21 (100.0%) |
| Business & Financial | 0 (0.0%) | 0 (0.0%) |
| Computers, Engineering & Science | 0 (0.0%) | 0 (0.0%) |
| Computers & Mathematics | 0 (0.0%) | 0 (0.0%) |
| Architecture & Engineering | 0 (0.0%) | 0 (0.0%) |
| Life, Physical & Social Science | 0 (0.0%) | 0 (0.0%) |
| Community & Social Service | 45 (45.9%) | 53 (54.1%) |
| Education, Arts & Media | 45 (100.0%) | 0 (0.0%) |
| Legal Services & Support | 0 (0.0%) | 0 (0.0%) |
| Education Instruction & Library | 0 (0.0%) | 44 (100.0%) |
| Arts, Media & Entertainment | 0 (0.0%) | 9 (100.0%) |
| Health Diagnosing & Treating | 0 (0.0%) | 0 (0.0%) |
| Health Technologists | 0 (0.0%) | 0 (0.0%) |
| Total (Category) | 45 (37.8%) | 74 (62.2%) |
| Total (Overall) | 220 (54.0%) | 187 (46.0%) |
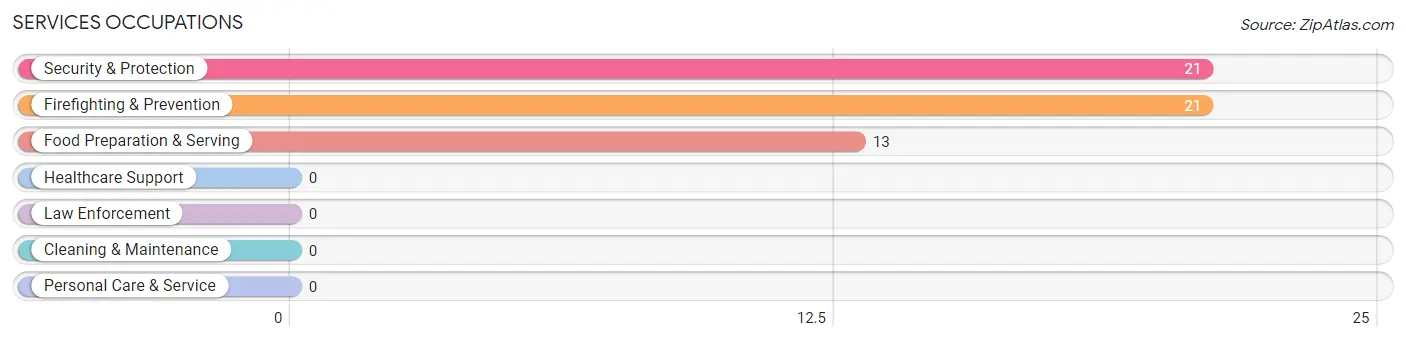
Services Occupations
The most common Services occupations in Ferndale are Security & Protection (21 | 5.2%), Firefighting & Prevention (21 | 5.2%), and Food Preparation & Serving (13 | 3.2%).
Services Occupations by Sex
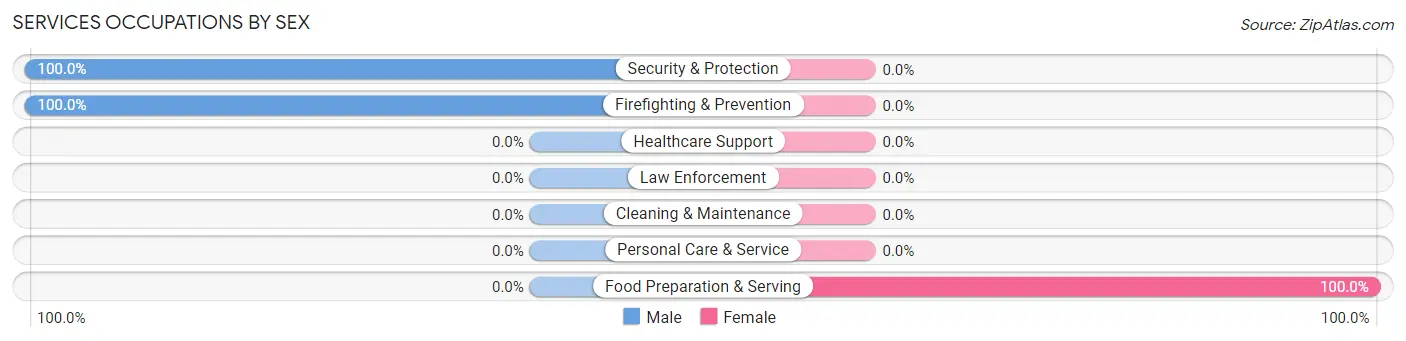
| Occupation | Male | Female |
| Healthcare Support | 0 (0.0%) | 0 (0.0%) |
| Security & Protection | 21 (100.0%) | 0 (0.0%) |
| Firefighting & Prevention | 21 (100.0%) | 0 (0.0%) |
| Law Enforcement | 0 (0.0%) | 0 (0.0%) |
| Food Preparation & Serving | 0 (0.0%) | 13 (100.0%) |
| Cleaning & Maintenance | 0 (0.0%) | 0 (0.0%) |
| Personal Care & Service | 0 (0.0%) | 0 (0.0%) |
| Total (Category) | 21 (61.8%) | 13 (38.2%) |
| Total (Overall) | 220 (54.0%) | 187 (46.0%) |
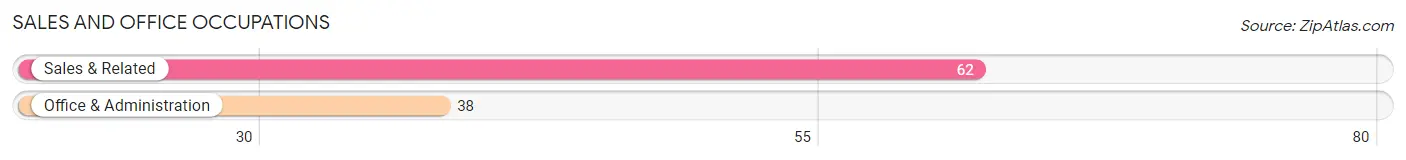
Sales and Office Occupations
The most common Sales and Office occupations in Ferndale are Sales & Related (62 | 15.2%), and Office & Administration (38 | 9.3%).
Sales and Office Occupations by Sex
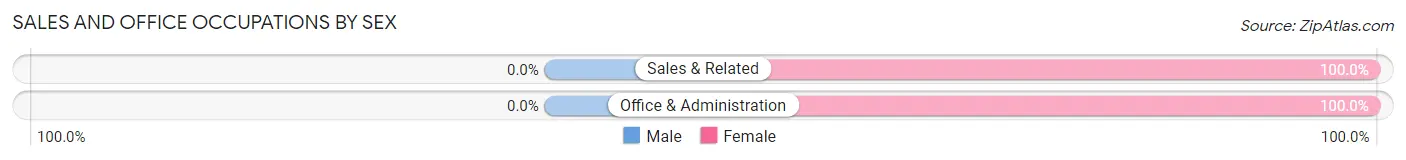
| Occupation | Male | Female |
| Sales & Related | 0 (0.0%) | 62 (100.0%) |
| Office & Administration | 0 (0.0%) | 38 (100.0%) |
| Total (Category) | 0 (0.0%) | 100 (100.0%) |
| Total (Overall) | 220 (54.0%) | 187 (46.0%) |
Natural Resources, Construction and Maintenance Occupations
The most common Natural Resources, Construction and Maintenance occupations in Ferndale are Construction & Extraction (70 | 17.2%), and Installation, Maintenance & Repair (27 | 6.6%).
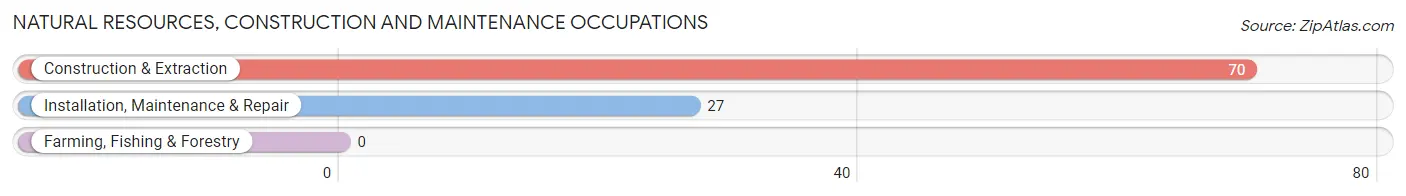
Natural Resources, Construction and Maintenance Occupations by Sex
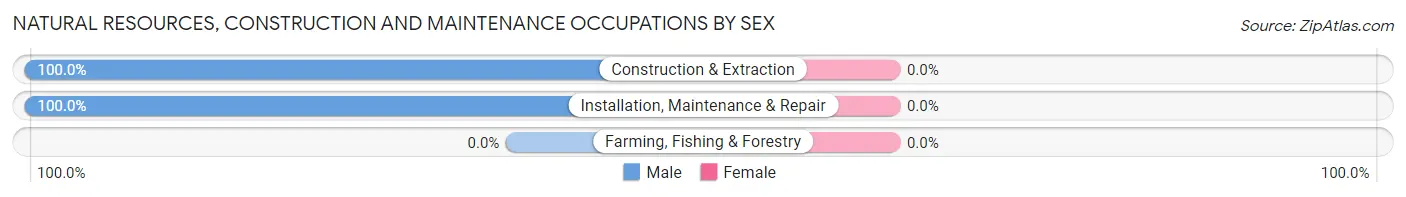
| Occupation | Male | Female |
| Farming, Fishing & Forestry | 0 (0.0%) | 0 (0.0%) |
| Construction & Extraction | 70 (100.0%) | 0 (0.0%) |
| Installation, Maintenance & Repair | 27 (100.0%) | 0 (0.0%) |
| Total (Category) | 97 (100.0%) | 0 (0.0%) |
| Total (Overall) | 220 (54.0%) | 187 (46.0%) |
Production, Transportation and Moving Occupations
The most common Production, Transportation and Moving occupations in Ferndale are , and Transportation (57 | 14.0%).
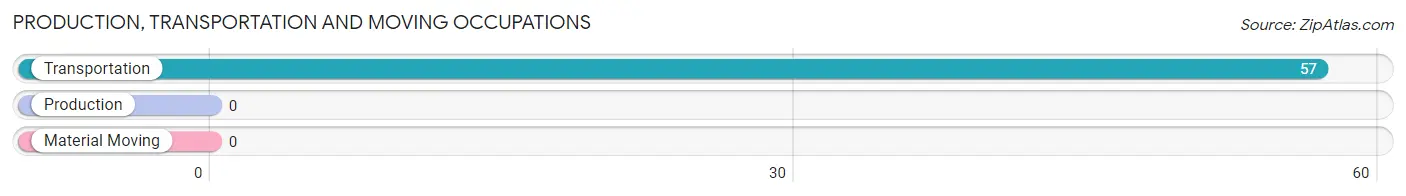
Production, Transportation and Moving Occupations by Sex
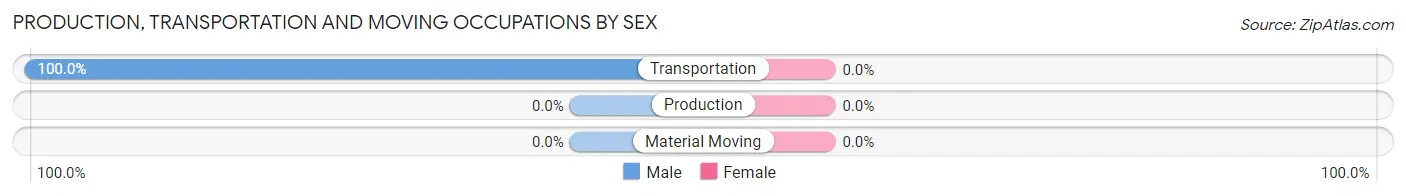
| Occupation | Male | Female |
| Production | 0 (0.0%) | 0 (0.0%) |
| Transportation | 57 (100.0%) | 0 (0.0%) |
| Material Moving | 0 (0.0%) | 0 (0.0%) |
| Total (Category) | 57 (100.0%) | 0 (0.0%) |
| Total (Overall) | 220 (54.0%) | 187 (46.0%) |
Employment Industries by Sex in Ferndale
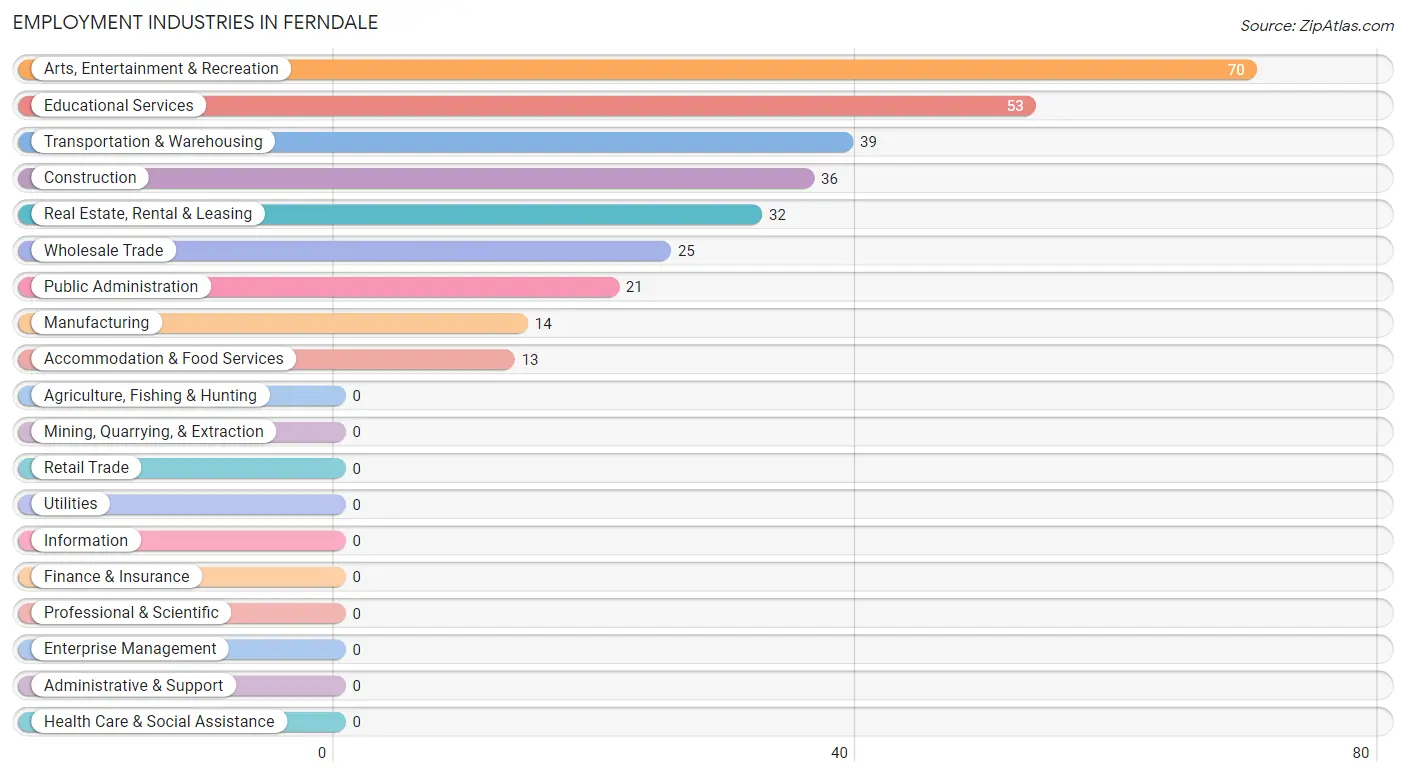
Employment Industries in Ferndale
The major employment industries in Ferndale include Arts, Entertainment & Recreation (70 | 17.2%), Educational Services (53 | 13.0%), Transportation & Warehousing (39 | 9.6%), Construction (36 | 8.8%), and Real Estate, Rental & Leasing (32 | 7.9%).
Employment Industries by Sex in Ferndale
The Ferndale industries that see more men than women are Construction (100.0%), Manufacturing (100.0%), and Transportation & Warehousing (100.0%), whereas the industries that tend to have a higher number of women are Real Estate, Rental & Leasing (100.0%), Educational Services (100.0%), and Accommodation & Food Services (100.0%).
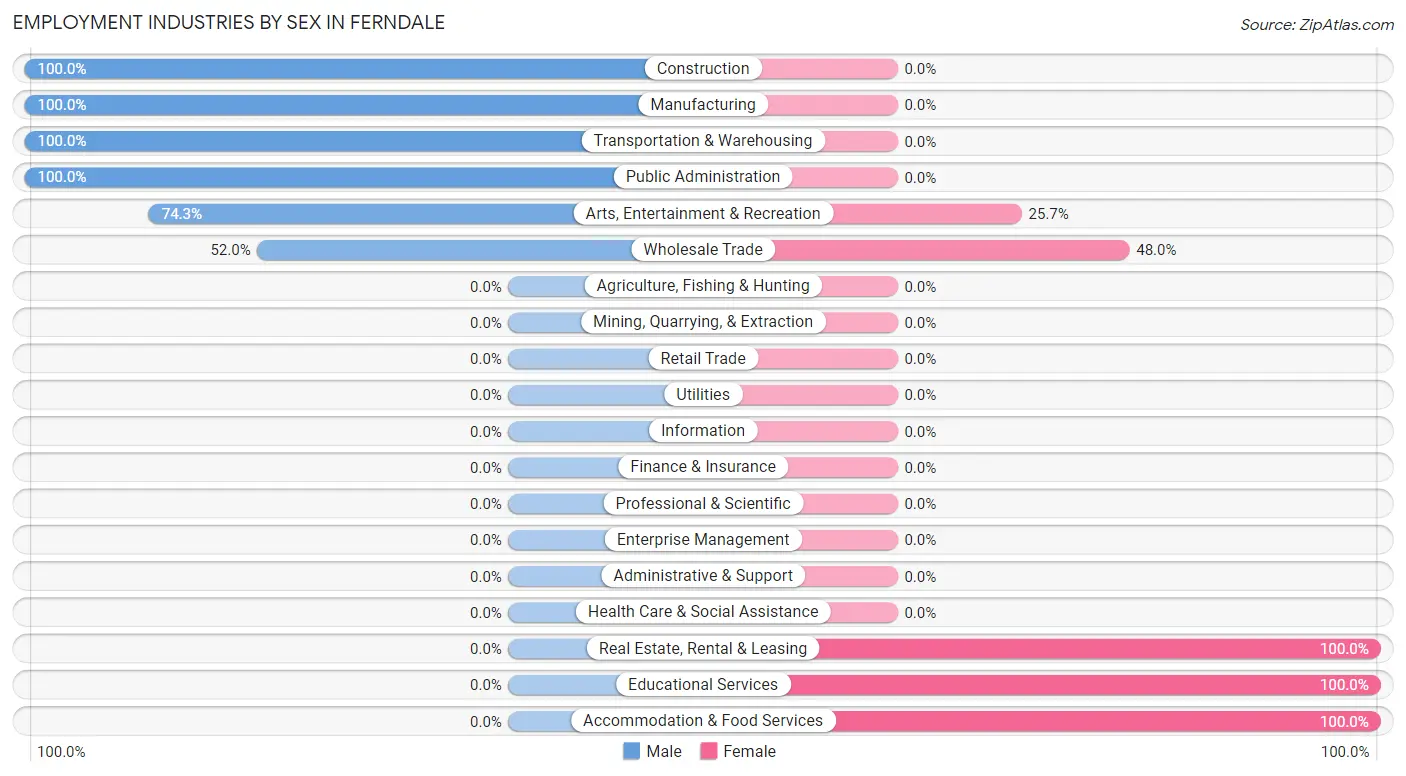
| Industry | Male | Female |
| Agriculture, Fishing & Hunting | 0 (0.0%) | 0 (0.0%) |
| Mining, Quarrying, & Extraction | 0 (0.0%) | 0 (0.0%) |
| Construction | 36 (100.0%) | 0 (0.0%) |
| Manufacturing | 14 (100.0%) | 0 (0.0%) |
| Wholesale Trade | 13 (52.0%) | 12 (48.0%) |
| Retail Trade | 0 (0.0%) | 0 (0.0%) |
| Transportation & Warehousing | 39 (100.0%) | 0 (0.0%) |
| Utilities | 0 (0.0%) | 0 (0.0%) |
| Information | 0 (0.0%) | 0 (0.0%) |
| Finance & Insurance | 0 (0.0%) | 0 (0.0%) |
| Real Estate, Rental & Leasing | 0 (0.0%) | 32 (100.0%) |
| Professional & Scientific | 0 (0.0%) | 0 (0.0%) |
| Enterprise Management | 0 (0.0%) | 0 (0.0%) |
| Administrative & Support | 0 (0.0%) | 0 (0.0%) |
| Educational Services | 0 (0.0%) | 53 (100.0%) |
| Health Care & Social Assistance | 0 (0.0%) | 0 (0.0%) |
| Arts, Entertainment & Recreation | 52 (74.3%) | 18 (25.7%) |
| Accommodation & Food Services | 0 (0.0%) | 13 (100.0%) |
| Public Administration | 21 (100.0%) | 0 (0.0%) |
| Total | 220 (54.0%) | 187 (46.0%) |
Education in Ferndale
School Enrollment in Ferndale
The most common levels of schooling among the 191 students in Ferndale are high school (110 | 57.6%), middle school (56 | 29.3%), and college / undergraduate (25 | 13.1%).
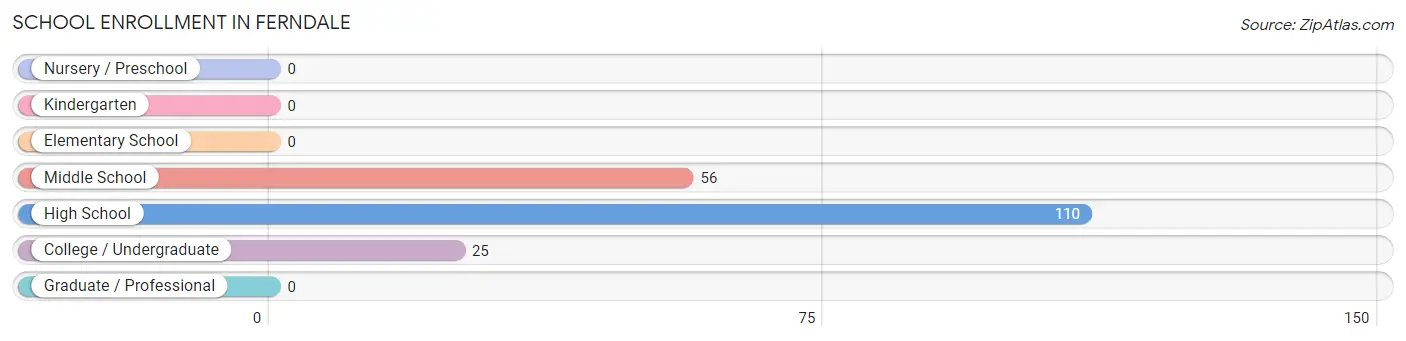
| School Level | # Students | % Students |
| Nursery / Preschool | 0 | 0.0% |
| Kindergarten | 0 | 0.0% |
| Elementary School | 0 | 0.0% |
| Middle School | 56 | 29.3% |
| High School | 110 | 57.6% |
| College / Undergraduate | 25 | 13.1% |
| Graduate / Professional | 0 | 0.0% |
| Total | 191 | 100.0% |
School Enrollment by Age by Funding Source in Ferndale
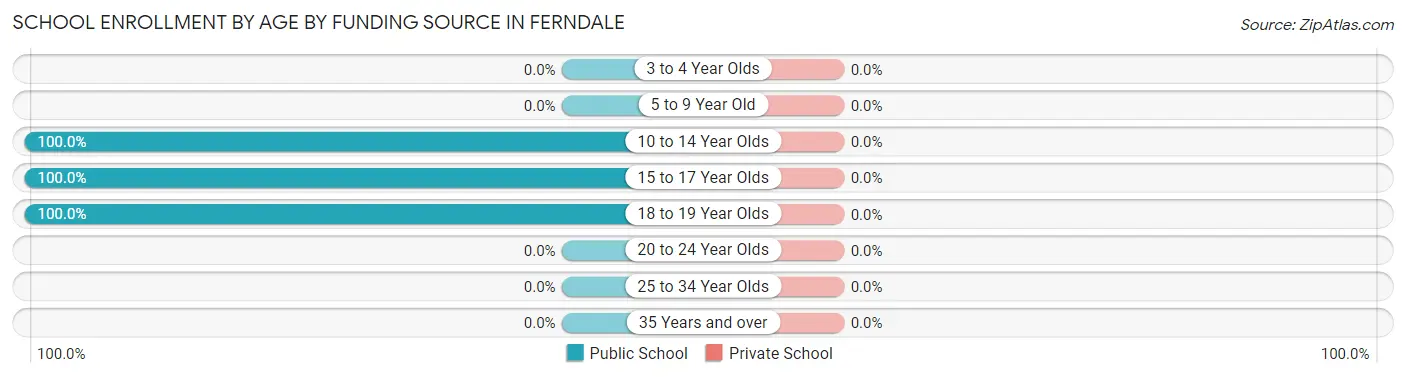
| Age Bracket | Public School | Private School |
| 3 to 4 Year Olds | 0 (0.0%) | 0 (0.0%) |
| 5 to 9 Year Old | 0 (0.0%) | 0 (0.0%) |
| 10 to 14 Year Olds | 56 (100.0%) | 0 (0.0%) |
| 15 to 17 Year Olds | 110 (100.0%) | 0 (0.0%) |
| 18 to 19 Year Olds | 25 (100.0%) | 0 (0.0%) |
| 20 to 24 Year Olds | 0 (0.0%) | 0 (0.0%) |
| 25 to 34 Year Olds | 0 (0.0%) | 0 (0.0%) |
| 35 Years and over | 0 (0.0%) | 0 (0.0%) |
| Total | 191 (100.0%) | 0 (0.0%) |
Educational Attainment by Field of Study in Ferndale
Education (44 | 35.5%), social sciences (34 | 27.4%), liberal arts & history (20 | 16.1%), literature & languages (12 | 9.7%), and psychology (8 | 6.5%) are the most common fields of study among 124 individuals in Ferndale who have obtained a bachelor's degree or higher.
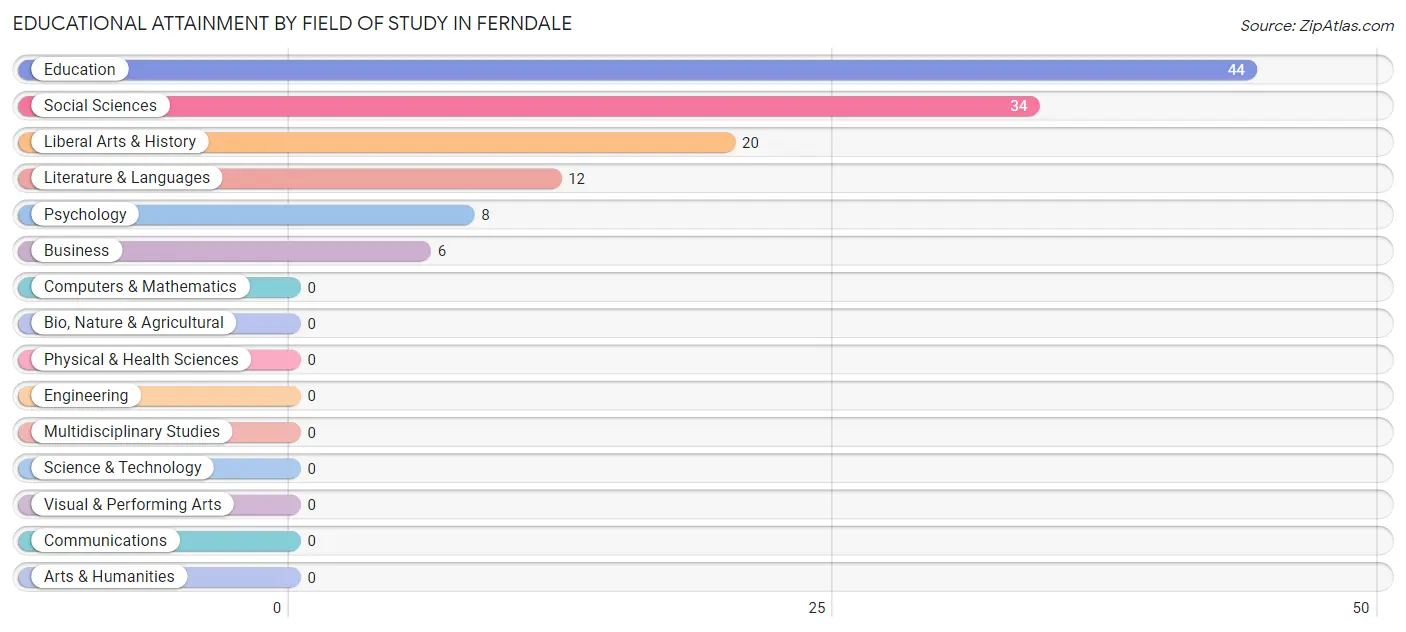
| Field of Study | # Graduates | % Graduates |
| Computers & Mathematics | 0 | 0.0% |
| Bio, Nature & Agricultural | 0 | 0.0% |
| Physical & Health Sciences | 0 | 0.0% |
| Psychology | 8 | 6.5% |
| Social Sciences | 34 | 27.4% |
| Engineering | 0 | 0.0% |
| Multidisciplinary Studies | 0 | 0.0% |
| Science & Technology | 0 | 0.0% |
| Business | 6 | 4.8% |
| Education | 44 | 35.5% |
| Literature & Languages | 12 | 9.7% |
| Liberal Arts & History | 20 | 16.1% |
| Visual & Performing Arts | 0 | 0.0% |
| Communications | 0 | 0.0% |
| Arts & Humanities | 0 | 0.0% |
| Total | 124 | 100.0% |
Transportation & Commute in Ferndale
Vehicle Availability by Sex in Ferndale
The most prevalent vehicle ownership categories in Ferndale are males with 3 vehicles (206, accounting for 93.6%) and females with 3 vehicles (179, making up 110.2%).
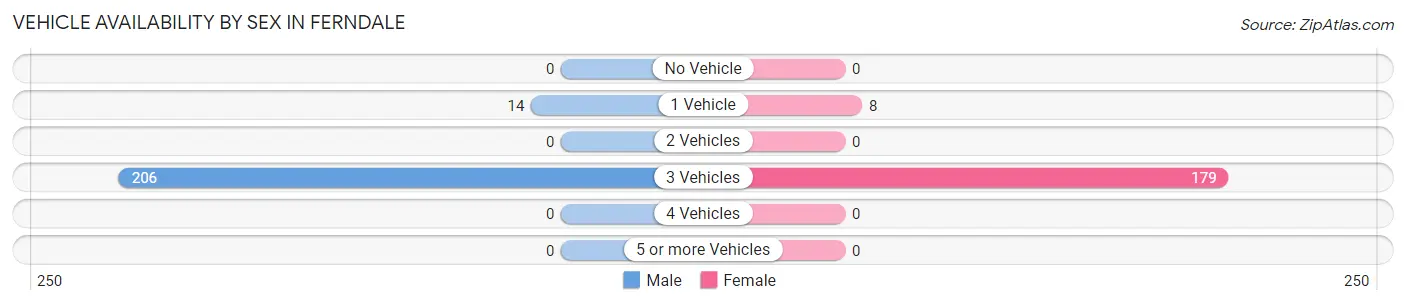
| Vehicles Available | Male | Female |
| No Vehicle | 0 (0.0%) | 0 (0.0%) |
| 1 Vehicle | 14 (6.4%) | 8 (4.3%) |
| 2 Vehicles | 0 (0.0%) | 0 (0.0%) |
| 3 Vehicles | 206 (93.6%) | 179 (95.7%) |
| 4 Vehicles | 0 (0.0%) | 0 (0.0%) |
| 5 or more Vehicles | 0 (0.0%) | 0 (0.0%) |
| Total | 220 (100.0%) | 187 (100.0%) |
Commute Time in Ferndale
The most frequently occuring commute durations in Ferndale are 10 to 14 minutes (110 commuters, 29.8%), 35 to 39 minutes (98 commuters, 26.6%), and 25 to 29 minutes (74 commuters, 20.1%).
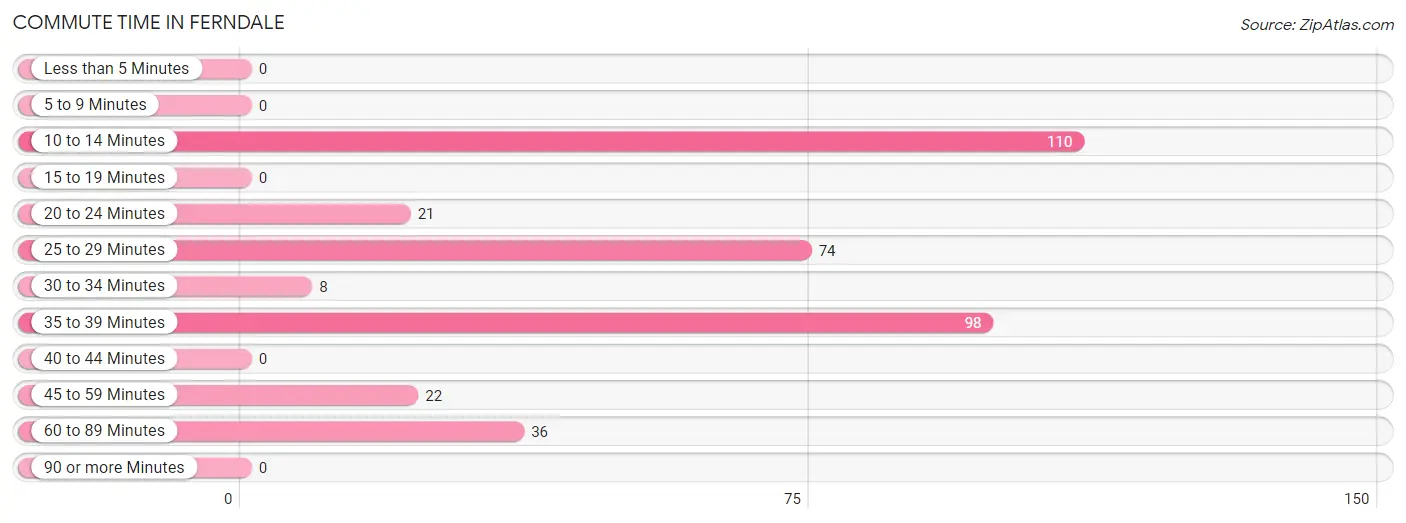
| Commute Time | # Commuters | % Commuters |
| Less than 5 Minutes | 0 | 0.0% |
| 5 to 9 Minutes | 0 | 0.0% |
| 10 to 14 Minutes | 110 | 29.8% |
| 15 to 19 Minutes | 0 | 0.0% |
| 20 to 24 Minutes | 21 | 5.7% |
| 25 to 29 Minutes | 74 | 20.1% |
| 30 to 34 Minutes | 8 | 2.2% |
| 35 to 39 Minutes | 98 | 26.6% |
| 40 to 44 Minutes | 0 | 0.0% |
| 45 to 59 Minutes | 22 | 6.0% |
| 60 to 89 Minutes | 36 | 9.8% |
| 90 or more Minutes | 0 | 0.0% |
Commute Time by Sex in Ferndale
The most common commute times in Ferndale are 35 to 39 minutes (86 commuters, 41.7%) for males and 10 to 14 minutes (65 commuters, 39.9%) for females.
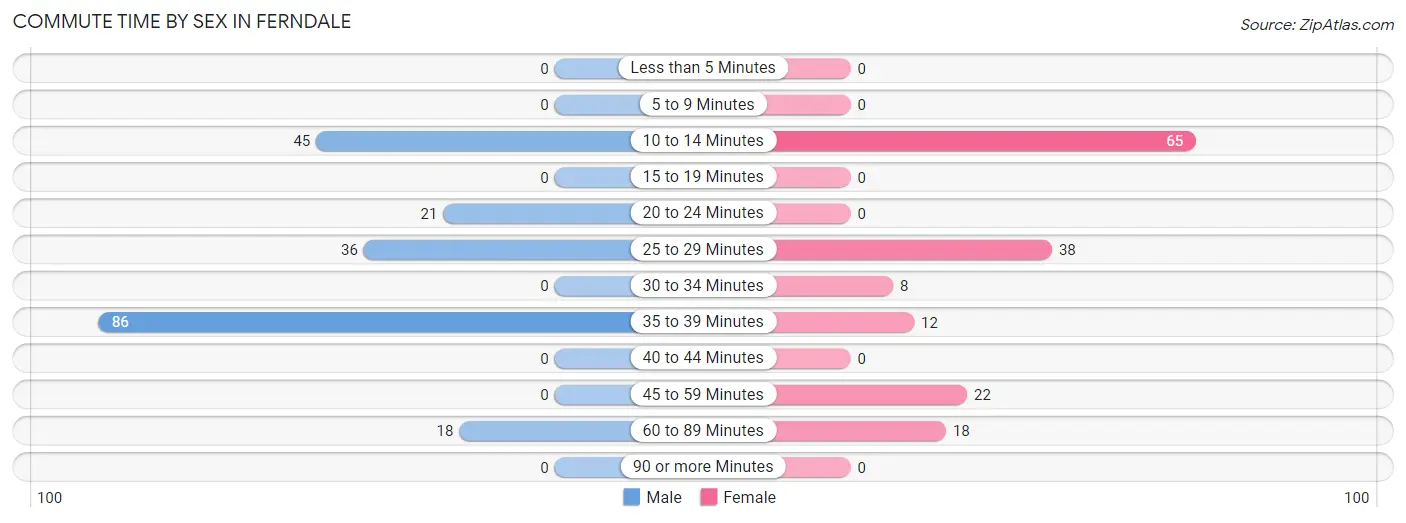
| Commute Time | Male | Female |
| Less than 5 Minutes | 0 (0.0%) | 0 (0.0%) |
| 5 to 9 Minutes | 0 (0.0%) | 0 (0.0%) |
| 10 to 14 Minutes | 45 (21.8%) | 65 (39.9%) |
| 15 to 19 Minutes | 0 (0.0%) | 0 (0.0%) |
| 20 to 24 Minutes | 21 (10.2%) | 0 (0.0%) |
| 25 to 29 Minutes | 36 (17.5%) | 38 (23.3%) |
| 30 to 34 Minutes | 0 (0.0%) | 8 (4.9%) |
| 35 to 39 Minutes | 86 (41.7%) | 12 (7.4%) |
| 40 to 44 Minutes | 0 (0.0%) | 0 (0.0%) |
| 45 to 59 Minutes | 0 (0.0%) | 22 (13.5%) |
| 60 to 89 Minutes | 18 (8.7%) | 18 (11.0%) |
| 90 or more Minutes | 0 (0.0%) | 0 (0.0%) |
Time of Departure to Work by Sex in Ferndale
The most frequent times of departure to work in Ferndale are 7:00 AM to 7:29 AM (80, 38.8%) for males and 7:30 AM to 7:59 AM (90, 55.2%) for females.
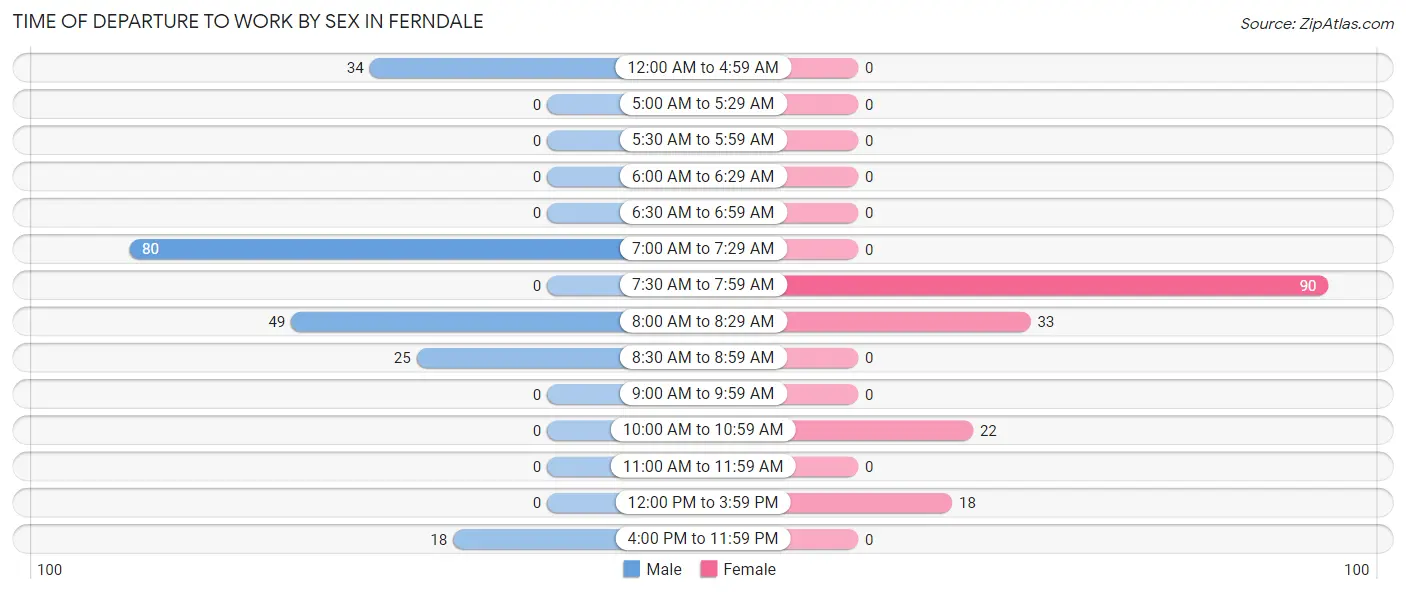
| Time of Departure | Male | Female |
| 12:00 AM to 4:59 AM | 34 (16.5%) | 0 (0.0%) |
| 5:00 AM to 5:29 AM | 0 (0.0%) | 0 (0.0%) |
| 5:30 AM to 5:59 AM | 0 (0.0%) | 0 (0.0%) |
| 6:00 AM to 6:29 AM | 0 (0.0%) | 0 (0.0%) |
| 6:30 AM to 6:59 AM | 0 (0.0%) | 0 (0.0%) |
| 7:00 AM to 7:29 AM | 80 (38.8%) | 0 (0.0%) |
| 7:30 AM to 7:59 AM | 0 (0.0%) | 90 (55.2%) |
| 8:00 AM to 8:29 AM | 49 (23.8%) | 33 (20.3%) |
| 8:30 AM to 8:59 AM | 25 (12.1%) | 0 (0.0%) |
| 9:00 AM to 9:59 AM | 0 (0.0%) | 0 (0.0%) |
| 10:00 AM to 10:59 AM | 0 (0.0%) | 22 (13.5%) |
| 11:00 AM to 11:59 AM | 0 (0.0%) | 0 (0.0%) |
| 12:00 PM to 3:59 PM | 0 (0.0%) | 18 (11.0%) |
| 4:00 PM to 11:59 PM | 18 (8.7%) | 0 (0.0%) |
| Total | 206 (100.0%) | 163 (100.0%) |
Housing Occupancy in Ferndale
Occupancy by Ownership in Ferndale
Of the total 208 dwellings in Ferndale, owner-occupied units account for 193 (92.8%), while renter-occupied units make up 15 (7.2%).
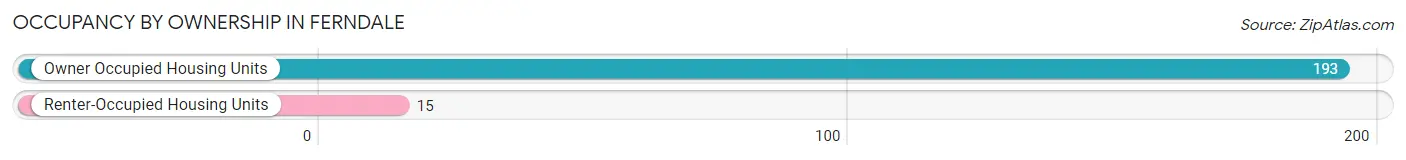
| Occupancy | # Housing Units | % Housing Units |
| Owner Occupied Housing Units | 193 | 92.8% |
| Renter-Occupied Housing Units | 15 | 7.2% |
| Total Occupied Housing Units | 208 | 100.0% |
Occupancy by Household Size in Ferndale
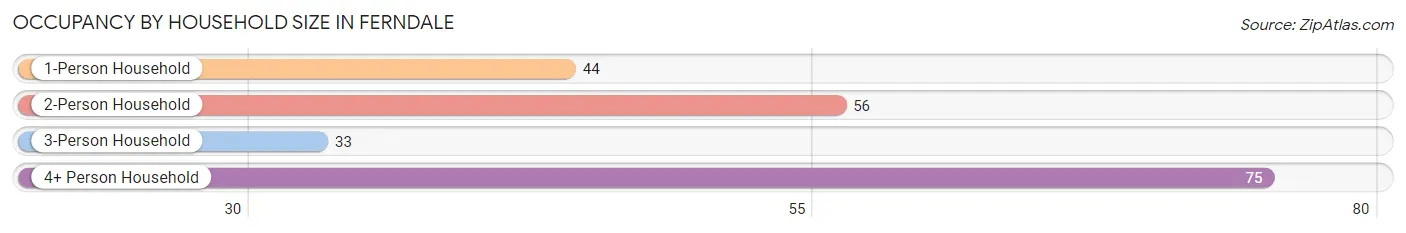
| Household Size | # Housing Units | % Housing Units |
| 1-Person Household | 44 | 21.1% |
| 2-Person Household | 56 | 26.9% |
| 3-Person Household | 33 | 15.9% |
| 4+ Person Household | 75 | 36.1% |
| Total Housing Units | 208 | 100.0% |
Occupancy by Ownership by Household Size in Ferndale
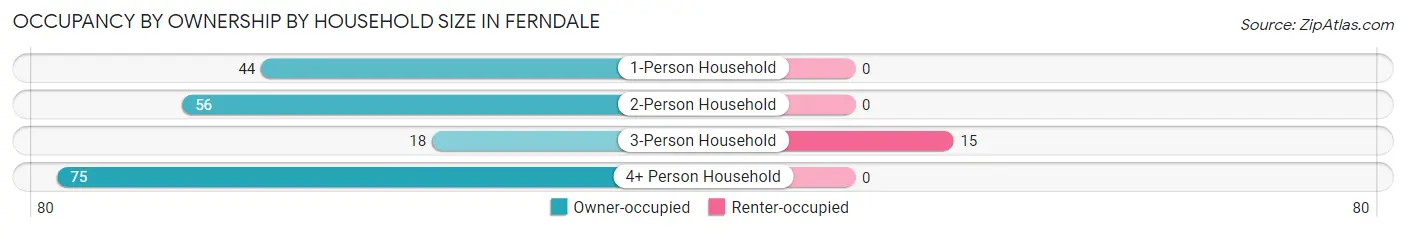
| Household Size | Owner-occupied | Renter-occupied |
| 1-Person Household | 44 (100.0%) | 0 (0.0%) |
| 2-Person Household | 56 (100.0%) | 0 (0.0%) |
| 3-Person Household | 18 (54.5%) | 15 (45.5%) |
| 4+ Person Household | 75 (100.0%) | 0 (0.0%) |
| Total Housing Units | 193 (92.8%) | 15 (7.2%) |
Occupancy by Educational Attainment in Ferndale
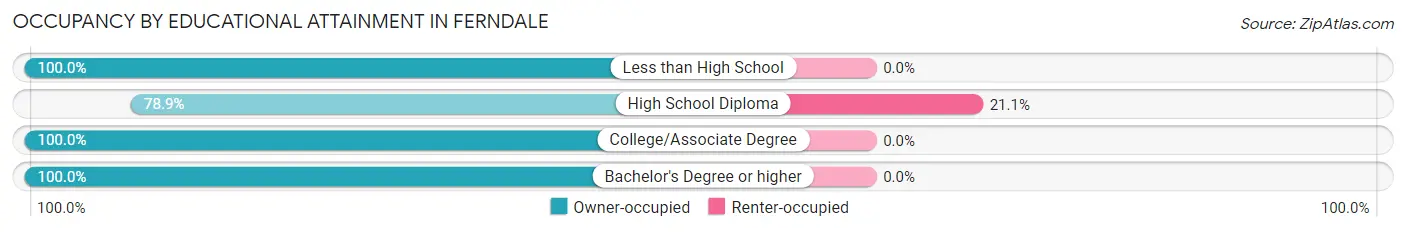
| Household Size | Owner-occupied | Renter-occupied |
| Less than High School | 36 (100.0%) | 0 (0.0%) |
| High School Diploma | 56 (78.9%) | 15 (21.1%) |
| College/Associate Degree | 21 (100.0%) | 0 (0.0%) |
| Bachelor's Degree or higher | 80 (100.0%) | 0 (0.0%) |
Occupancy by Age of Householder in Ferndale
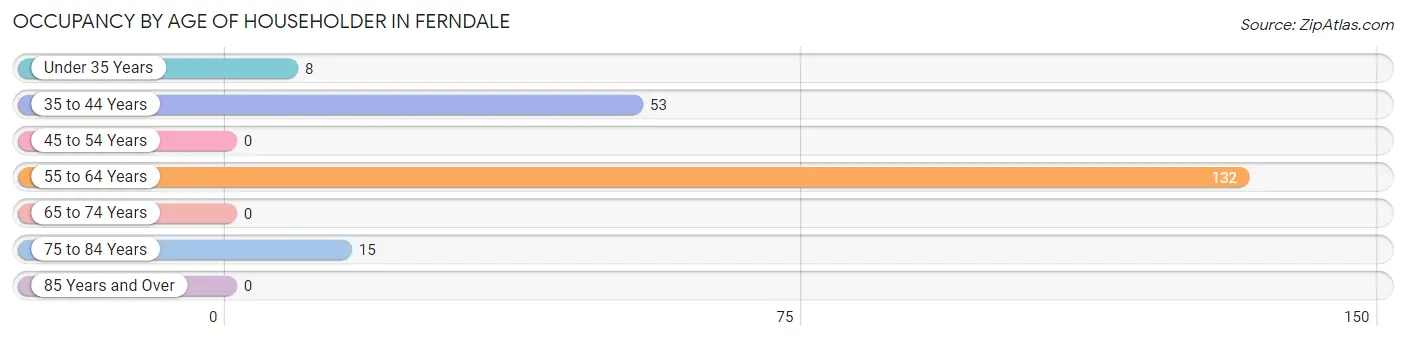
| Age Bracket | # Households | % Households |
| Under 35 Years | 8 | 3.8% |
| 35 to 44 Years | 53 | 25.5% |
| 45 to 54 Years | 0 | 0.0% |
| 55 to 64 Years | 132 | 63.5% |
| 65 to 74 Years | 0 | 0.0% |
| 75 to 84 Years | 15 | 7.2% |
| 85 Years and Over | 0 | 0.0% |
| Total | 208 | 100.0% |
Housing Finances in Ferndale
Median Income by Occupancy in Ferndale
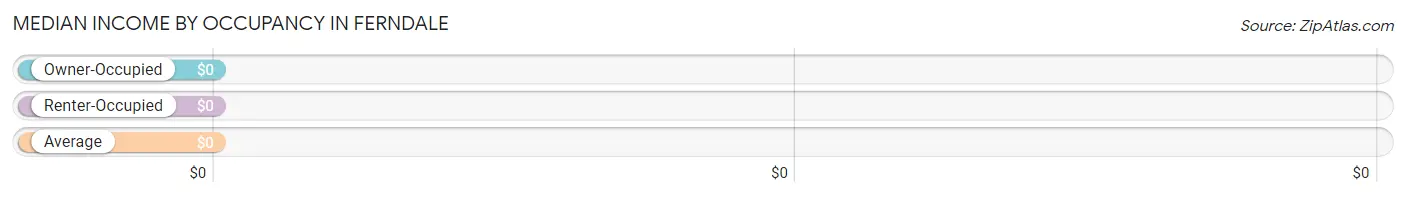
| Occupancy Type | # Households | Median Income |
| Owner-Occupied | 193 (92.8%) | $0 |
| Renter-Occupied | 15 (7.2%) | $0 |
| Average | 208 (100.0%) | $0 |
Occupancy by Householder Income Bracket in Ferndale
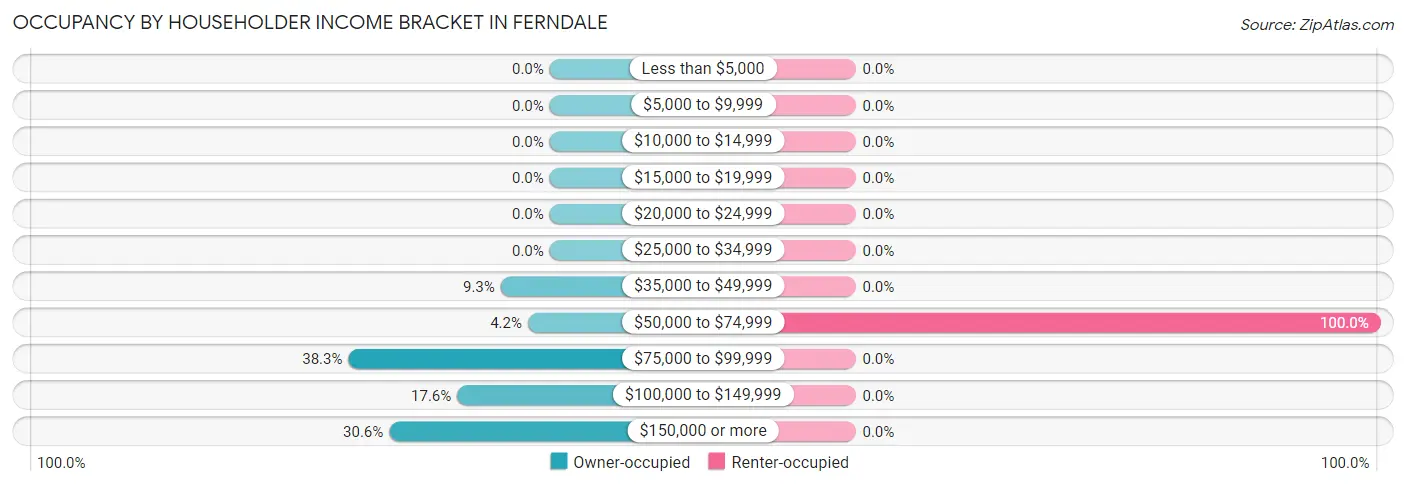
| Income Bracket | Owner-occupied | Renter-occupied |
| Less than $5,000 | 0 (0.0%) | 0 (0.0%) |
| $5,000 to $9,999 | 0 (0.0%) | 0 (0.0%) |
| $10,000 to $14,999 | 0 (0.0%) | 0 (0.0%) |
| $15,000 to $19,999 | 0 (0.0%) | 0 (0.0%) |
| $20,000 to $24,999 | 0 (0.0%) | 0 (0.0%) |
| $25,000 to $34,999 | 0 (0.0%) | 0 (0.0%) |
| $35,000 to $49,999 | 18 (9.3%) | 0 (0.0%) |
| $50,000 to $74,999 | 8 (4.2%) | 15 (100.0%) |
| $75,000 to $99,999 | 74 (38.3%) | 0 (0.0%) |
| $100,000 to $149,999 | 34 (17.6%) | 0 (0.0%) |
| $150,000 or more | 59 (30.6%) | 0 (0.0%) |
| Total | 193 (100.0%) | 15 (100.0%) |
Monthly Housing Cost Tiers in Ferndale
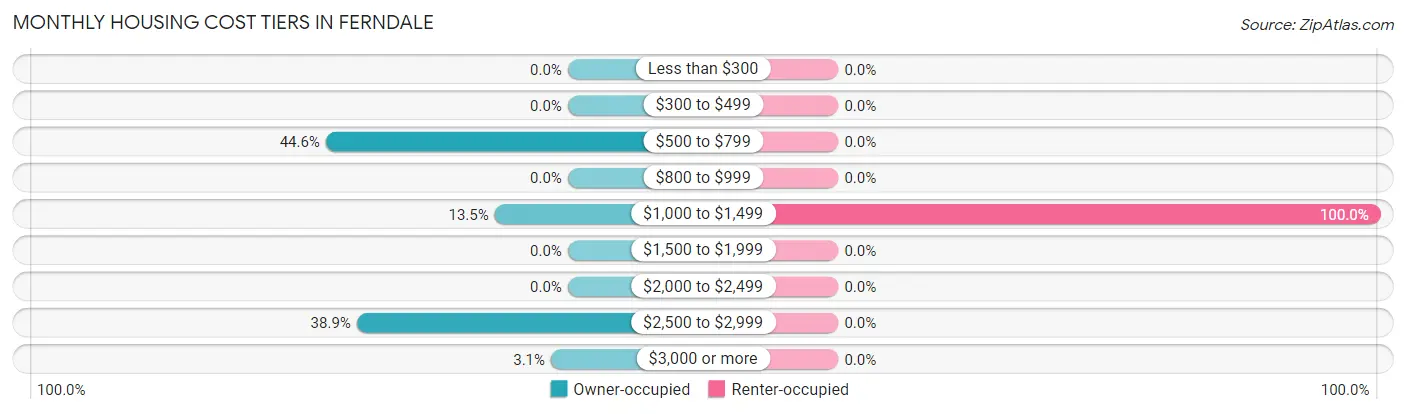
| Monthly Cost | Owner-occupied | Renter-occupied |
| Less than $300 | 0 (0.0%) | 0 (0.0%) |
| $300 to $499 | 0 (0.0%) | 0 (0.0%) |
| $500 to $799 | 86 (44.6%) | 0 (0.0%) |
| $800 to $999 | 0 (0.0%) | 0 (0.0%) |
| $1,000 to $1,499 | 26 (13.5%) | 15 (100.0%) |
| $1,500 to $1,999 | 0 (0.0%) | 0 (0.0%) |
| $2,000 to $2,499 | 0 (0.0%) | 0 (0.0%) |
| $2,500 to $2,999 | 75 (38.9%) | 0 (0.0%) |
| $3,000 or more | 6 (3.1%) | 0 (0.0%) |
| Total | 193 (100.0%) | 15 (100.0%) |
Physical Housing Characteristics in Ferndale
Housing Structures in Ferndale
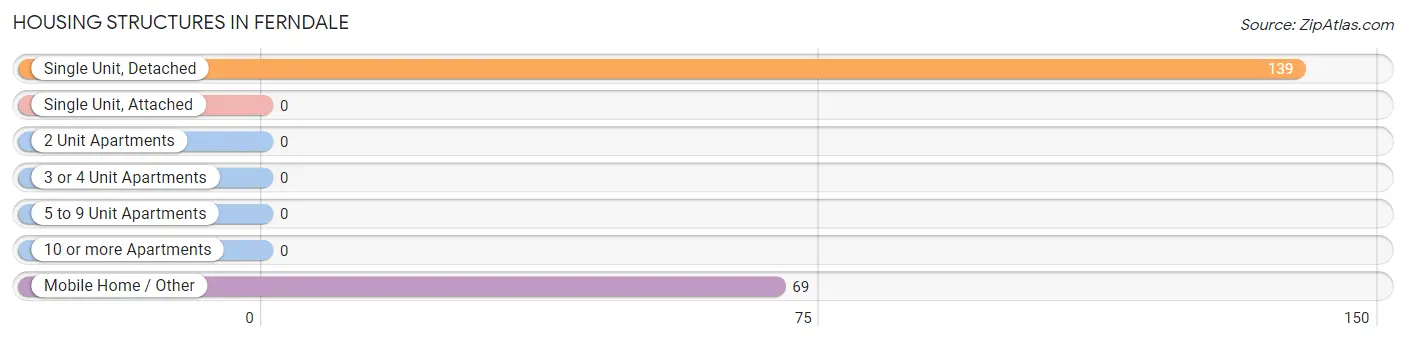
| Structure Type | # Housing Units | % Housing Units |
| Single Unit, Detached | 139 | 66.8% |
| Single Unit, Attached | 0 | 0.0% |
| 2 Unit Apartments | 0 | 0.0% |
| 3 or 4 Unit Apartments | 0 | 0.0% |
| 5 to 9 Unit Apartments | 0 | 0.0% |
| 10 or more Apartments | 0 | 0.0% |
| Mobile Home / Other | 69 | 33.2% |
| Total | 208 | 100.0% |
Housing Structures by Occupancy in Ferndale
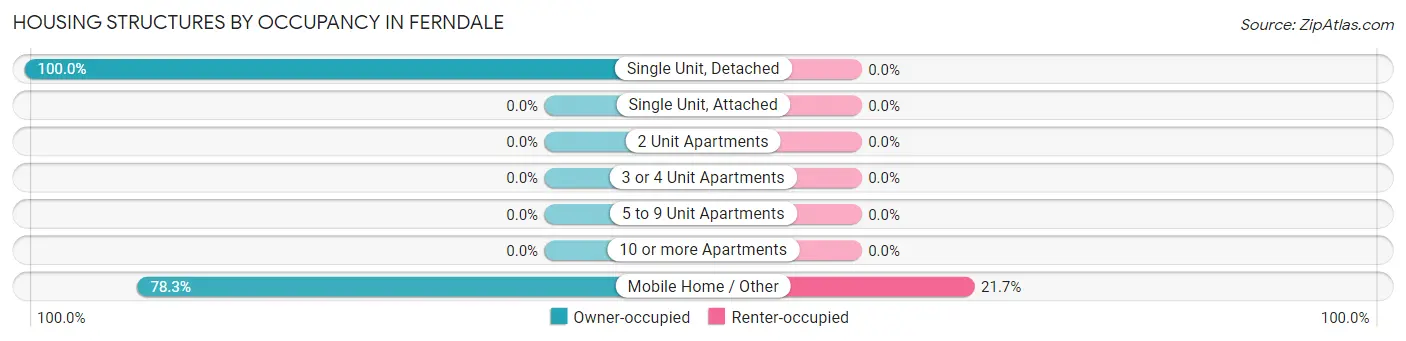
| Structure Type | Owner-occupied | Renter-occupied |
| Single Unit, Detached | 139 (100.0%) | 0 (0.0%) |
| Single Unit, Attached | 0 (0.0%) | 0 (0.0%) |
| 2 Unit Apartments | 0 (0.0%) | 0 (0.0%) |
| 3 or 4 Unit Apartments | 0 (0.0%) | 0 (0.0%) |
| 5 to 9 Unit Apartments | 0 (0.0%) | 0 (0.0%) |
| 10 or more Apartments | 0 (0.0%) | 0 (0.0%) |
| Mobile Home / Other | 54 (78.3%) | 15 (21.7%) |
| Total | 193 (92.8%) | 15 (7.2%) |
Housing Structures by Number of Rooms in Ferndale
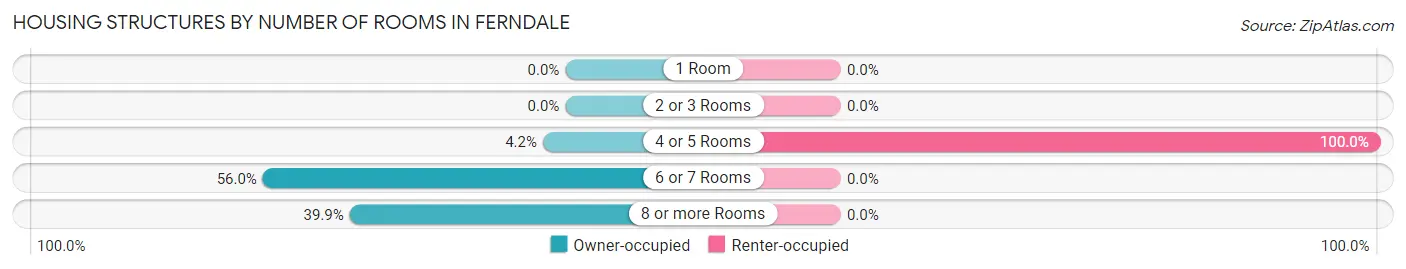
| Number of Rooms | Owner-occupied | Renter-occupied |
| 1 Room | 0 (0.0%) | 0 (0.0%) |
| 2 or 3 Rooms | 0 (0.0%) | 0 (0.0%) |
| 4 or 5 Rooms | 8 (4.2%) | 15 (100.0%) |
| 6 or 7 Rooms | 108 (56.0%) | 0 (0.0%) |
| 8 or more Rooms | 77 (39.9%) | 0 (0.0%) |
| Total | 193 (100.0%) | 15 (100.0%) |
Housing Structure by Heating Type in Ferndale
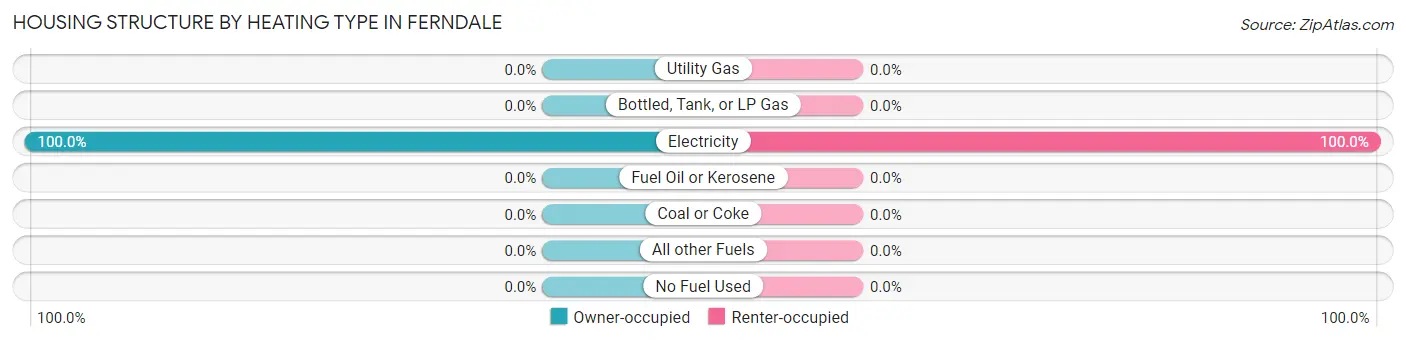
| Heating Type | Owner-occupied | Renter-occupied |
| Utility Gas | 0 (0.0%) | 0 (0.0%) |
| Bottled, Tank, or LP Gas | 0 (0.0%) | 0 (0.0%) |
| Electricity | 193 (100.0%) | 15 (100.0%) |
| Fuel Oil or Kerosene | 0 (0.0%) | 0 (0.0%) |
| Coal or Coke | 0 (0.0%) | 0 (0.0%) |
| All other Fuels | 0 (0.0%) | 0 (0.0%) |
| No Fuel Used | 0 (0.0%) | 0 (0.0%) |
| Total | 193 (100.0%) | 15 (100.0%) |
Household Vehicle Usage in Ferndale
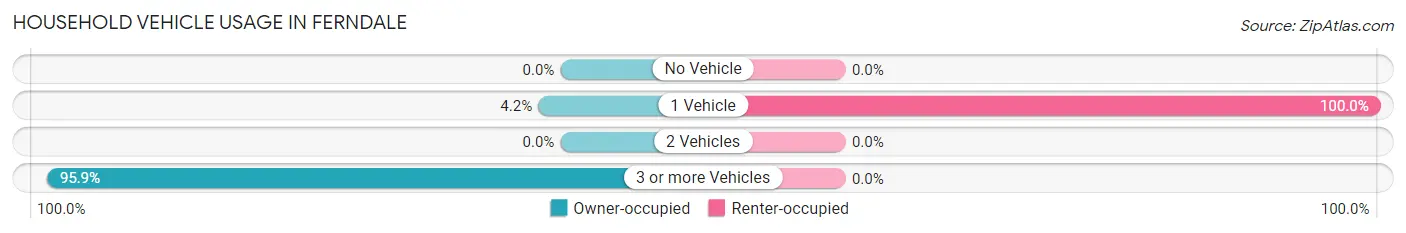
| Vehicles per Household | Owner-occupied | Renter-occupied |
| No Vehicle | 0 (0.0%) | 0 (0.0%) |
| 1 Vehicle | 8 (4.2%) | 15 (100.0%) |
| 2 Vehicles | 0 (0.0%) | 0 (0.0%) |
| 3 or more Vehicles | 185 (95.9%) | 0 (0.0%) |
| Total | 193 (100.0%) | 15 (100.0%) |
Real Estate & Mortgages in Ferndale
Real Estate and Mortgage Overview in Ferndale
| Characteristic | Without Mortgage | With Mortgage |
| Housing Units | 86 | 107 |
| Median Property Value | - | - |
| Median Household Income | $80,461 | $47 |
| Monthly Housing Costs | $658 | $6 |
| Real Estate Taxes | $2,184 | $0 |
Property Value by Mortgage Status in Ferndale
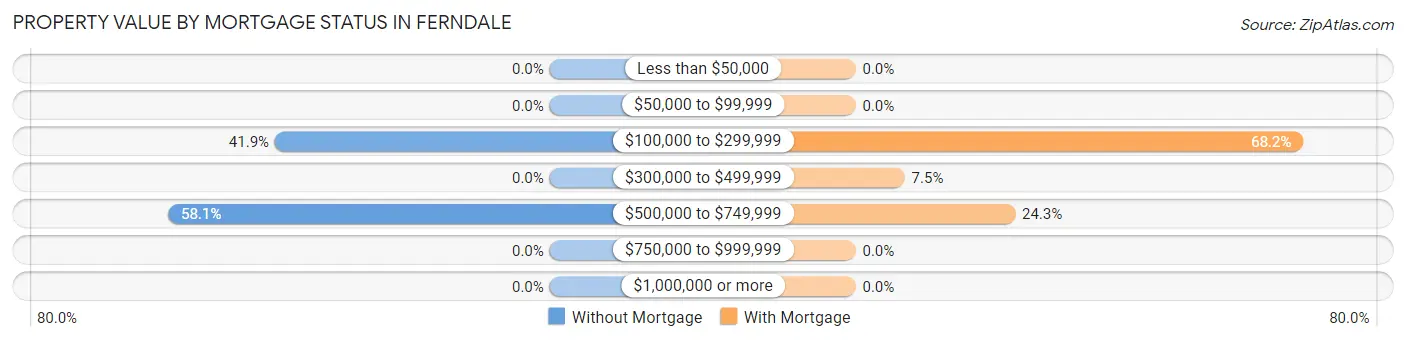
| Property Value | Without Mortgage | With Mortgage |
| Less than $50,000 | 0 (0.0%) | 0 (0.0%) |
| $50,000 to $99,999 | 0 (0.0%) | 0 (0.0%) |
| $100,000 to $299,999 | 36 (41.9%) | 73 (68.2%) |
| $300,000 to $499,999 | 0 (0.0%) | 8 (7.5%) |
| $500,000 to $749,999 | 50 (58.1%) | 26 (24.3%) |
| $750,000 to $999,999 | 0 (0.0%) | 0 (0.0%) |
| $1,000,000 or more | 0 (0.0%) | 0 (0.0%) |
| Total | 86 (100.0%) | 107 (100.0%) |
Household Income by Mortgage Status in Ferndale
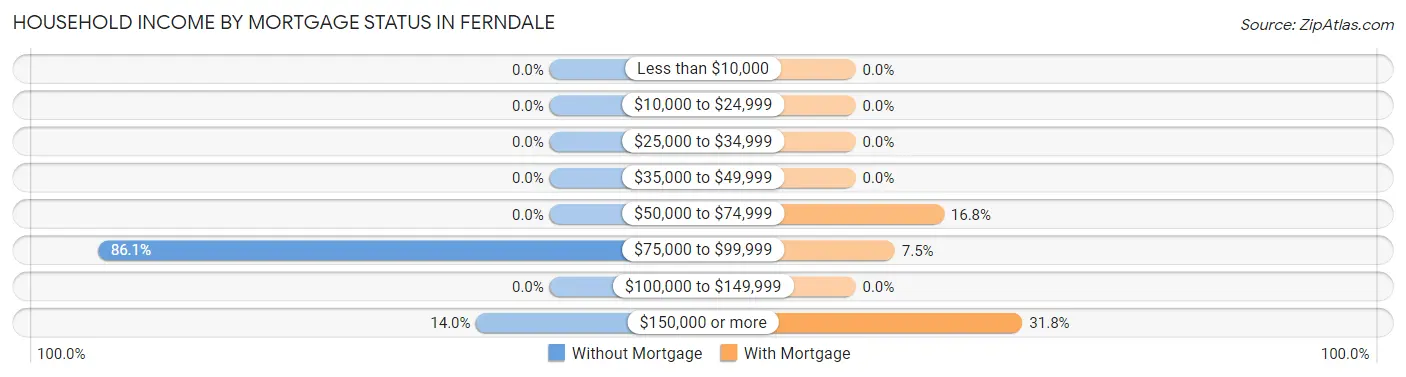
| Household Income | Without Mortgage | With Mortgage |
| Less than $10,000 | 0 (0.0%) | 0 (0.0%) |
| $10,000 to $24,999 | 0 (0.0%) | 0 (0.0%) |
| $25,000 to $34,999 | 0 (0.0%) | 0 (0.0%) |
| $35,000 to $49,999 | 0 (0.0%) | 0 (0.0%) |
| $50,000 to $74,999 | 0 (0.0%) | 18 (16.8%) |
| $75,000 to $99,999 | 74 (86.1%) | 8 (7.5%) |
| $100,000 to $149,999 | 0 (0.0%) | 0 (0.0%) |
| $150,000 or more | 12 (14.0%) | 34 (31.8%) |
| Total | 86 (100.0%) | 107 (100.0%) |
Property Value to Household Income Ratio in Ferndale
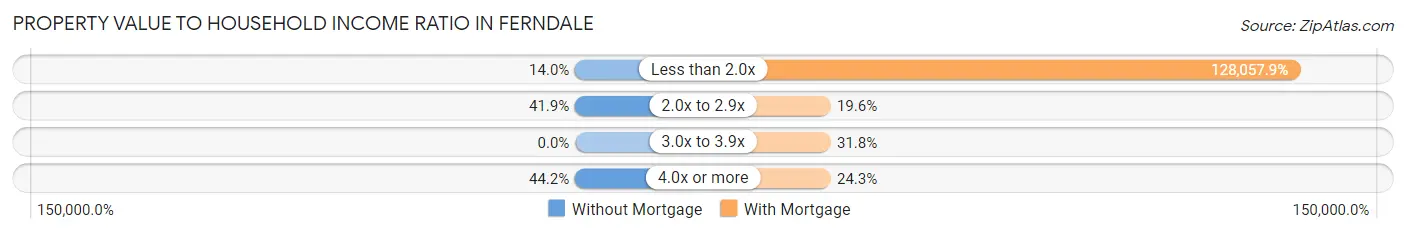
| Value-to-Income Ratio | Without Mortgage | With Mortgage |
| Less than 2.0x | 12 (14.0%) | 137,022 (128,057.9%) |
| 2.0x to 2.9x | 36 (41.9%) | 21 (19.6%) |
| 3.0x to 3.9x | 0 (0.0%) | 34 (31.8%) |
| 4.0x or more | 38 (44.2%) | 26 (24.3%) |
| Total | 86 (100.0%) | 107 (100.0%) |
Real Estate Taxes by Mortgage Status in Ferndale
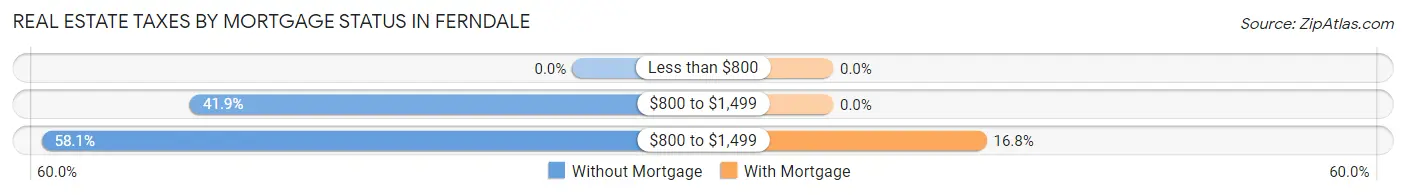
| Property Taxes | Without Mortgage | With Mortgage |
| Less than $800 | 0 (0.0%) | 0 (0.0%) |
| $800 to $1,499 | 36 (41.9%) | 0 (0.0%) |
| $800 to $1,499 | 50 (58.1%) | 18 (16.8%) |
| Total | 86 (100.0%) | 107 (100.0%) |
Health & Disability in Ferndale
Health Insurance Coverage by Age in Ferndale
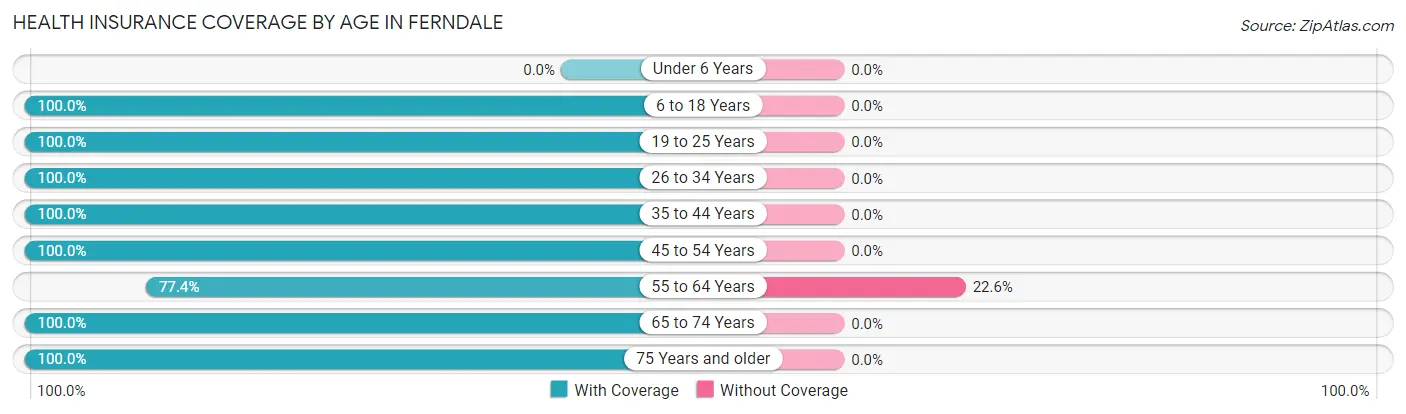
| Age Bracket | With Coverage | Without Coverage |
| Under 6 Years | 0 (0.0%) | 0 (0.0%) |
| 6 to 18 Years | 166 (100.0%) | 0 (0.0%) |
| 19 to 25 Years | 39 (100.0%) | 0 (0.0%) |
| 26 to 34 Years | 21 (100.0%) | 0 (0.0%) |
| 35 to 44 Years | 74 (100.0%) | 0 (0.0%) |
| 45 to 54 Years | 99 (100.0%) | 0 (0.0%) |
| 55 to 64 Years | 123 (77.4%) | 36 (22.6%) |
| 65 to 74 Years | 39 (100.0%) | 0 (0.0%) |
| 75 Years and older | 15 (100.0%) | 0 (0.0%) |
| Total | 576 (94.1%) | 36 (5.9%) |
Health Insurance Coverage by Citizenship Status in Ferndale
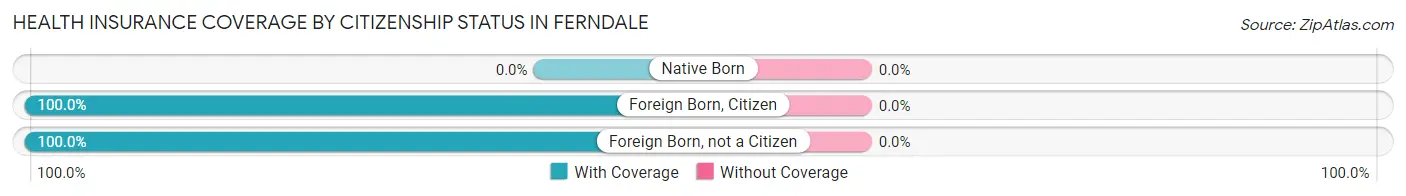
| Citizenship Status | With Coverage | Without Coverage |
| Native Born | 0 (0.0%) | 0 (0.0%) |
| Foreign Born, Citizen | 166 (100.0%) | 0 (0.0%) |
| Foreign Born, not a Citizen | 39 (100.0%) | 0 (0.0%) |
Health Insurance Coverage by Household Income in Ferndale
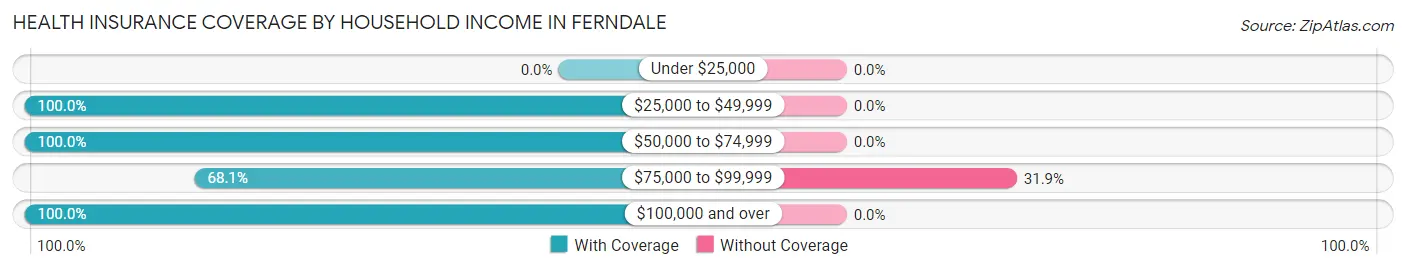
| Household Income | With Coverage | Without Coverage |
| Under $25,000 | 0 (0.0%) | 0 (0.0%) |
| $25,000 to $49,999 | 36 (100.0%) | 0 (0.0%) |
| $50,000 to $74,999 | 55 (100.0%) | 0 (0.0%) |
| $75,000 to $99,999 | 77 (68.1%) | 36 (31.9%) |
| $100,000 and over | 408 (100.0%) | 0 (0.0%) |
Public vs Private Health Insurance Coverage by Age in Ferndale
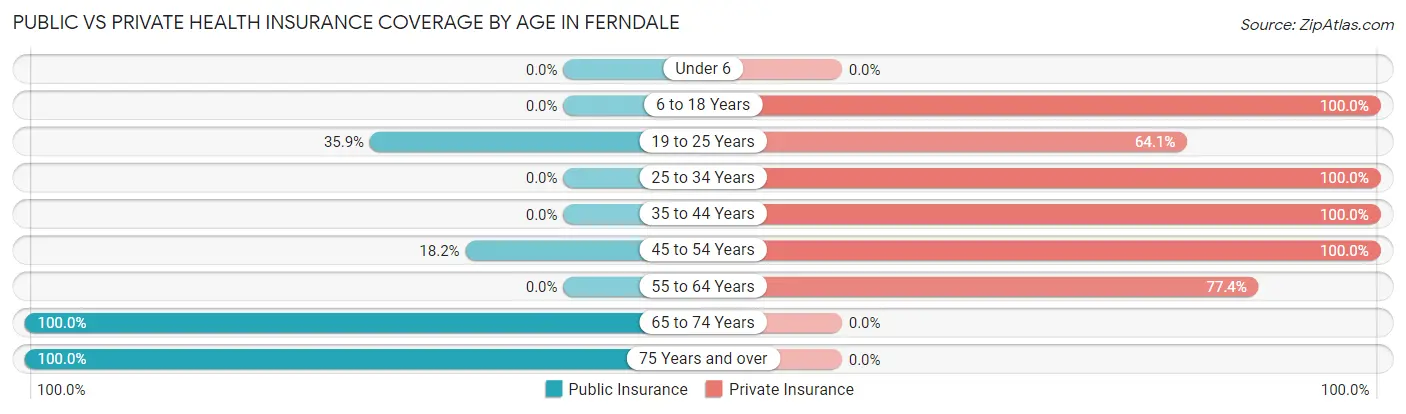
| Age Bracket | Public Insurance | Private Insurance |
| Under 6 | 0 (0.0%) | 0 (0.0%) |
| 6 to 18 Years | 0 (0.0%) | 166 (100.0%) |
| 19 to 25 Years | 14 (35.9%) | 25 (64.1%) |
| 25 to 34 Years | 0 (0.0%) | 21 (100.0%) |
| 35 to 44 Years | 0 (0.0%) | 74 (100.0%) |
| 45 to 54 Years | 18 (18.2%) | 99 (100.0%) |
| 55 to 64 Years | 0 (0.0%) | 123 (77.4%) |
| 65 to 74 Years | 39 (100.0%) | 0 (0.0%) |
| 75 Years and over | 15 (100.0%) | 0 (0.0%) |
| Total | 86 (14.1%) | 508 (83.0%) |
Disability Status by Sex by Age in Ferndale
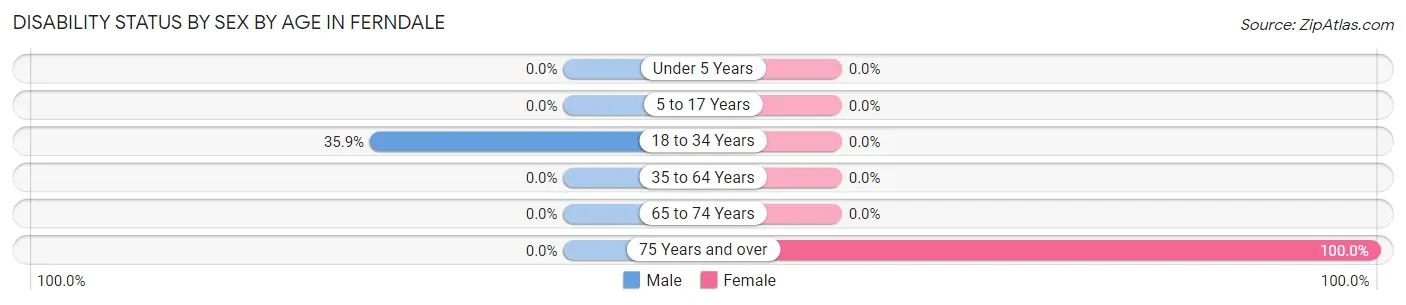
| Age Bracket | Male | Female |
| Under 5 Years | 0 (0.0%) | 0 (0.0%) |
| 5 to 17 Years | 0 (0.0%) | 0 (0.0%) |
| 18 to 34 Years | 14 (35.9%) | 0 (0.0%) |
| 35 to 64 Years | 0 (0.0%) | 0 (0.0%) |
| 65 to 74 Years | 0 (0.0%) | 0 (0.0%) |
| 75 Years and over | 0 (0.0%) | 15 (100.0%) |
Disability Class by Sex by Age in Ferndale
Disability Class: Hearing Difficulty
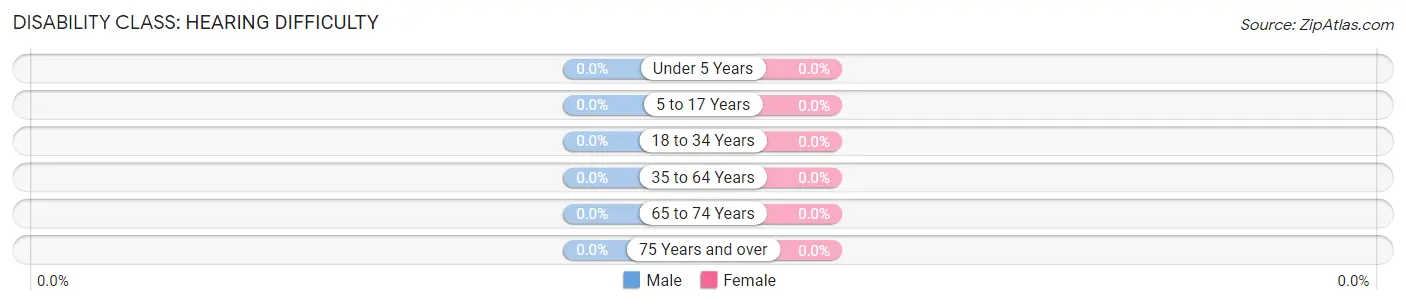
| Age Bracket | Male | Female |
| Under 5 Years | 0 (0.0%) | 0 (0.0%) |
| 5 to 17 Years | 0 (0.0%) | 0 (0.0%) |
| 18 to 34 Years | 0 (0.0%) | 0 (0.0%) |
| 35 to 64 Years | 0 (0.0%) | 0 (0.0%) |
| 65 to 74 Years | 0 (0.0%) | 0 (0.0%) |
| 75 Years and over | 0 (0.0%) | 0 (0.0%) |
Disability Class: Vision Difficulty
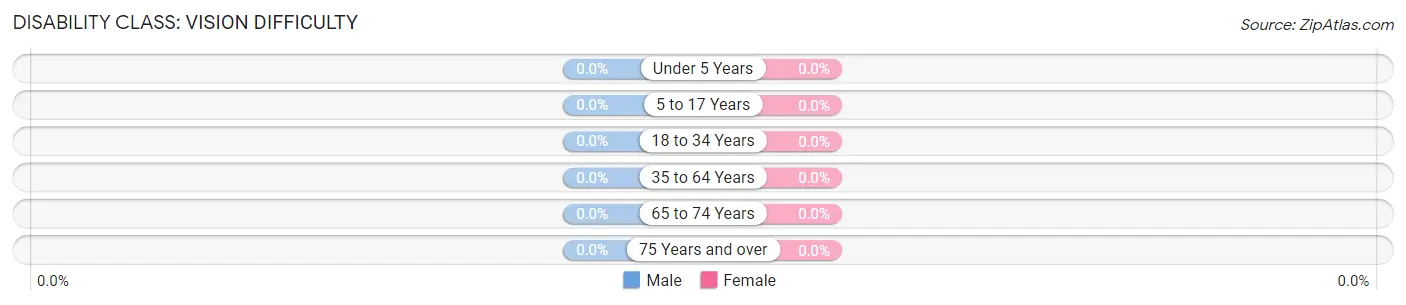
| Age Bracket | Male | Female |
| Under 5 Years | 0 (0.0%) | 0 (0.0%) |
| 5 to 17 Years | 0 (0.0%) | 0 (0.0%) |
| 18 to 34 Years | 0 (0.0%) | 0 (0.0%) |
| 35 to 64 Years | 0 (0.0%) | 0 (0.0%) |
| 65 to 74 Years | 0 (0.0%) | 0 (0.0%) |
| 75 Years and over | 0 (0.0%) | 0 (0.0%) |
Disability Class: Cognitive Difficulty
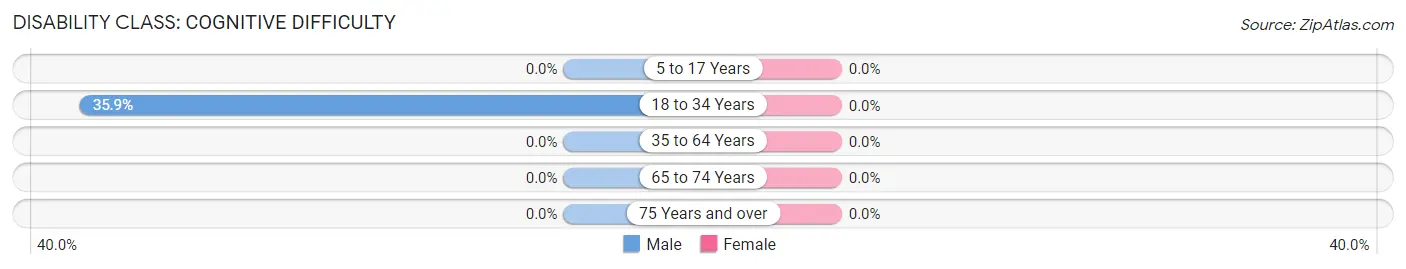
| Age Bracket | Male | Female |
| 5 to 17 Years | 0 (0.0%) | 0 (0.0%) |
| 18 to 34 Years | 14 (35.9%) | 0 (0.0%) |
| 35 to 64 Years | 0 (0.0%) | 0 (0.0%) |
| 65 to 74 Years | 0 (0.0%) | 0 (0.0%) |
| 75 Years and over | 0 (0.0%) | 0 (0.0%) |
Disability Class: Ambulatory Difficulty

| Age Bracket | Male | Female |
| 5 to 17 Years | 0 (0.0%) | 0 (0.0%) |
| 18 to 34 Years | 14 (35.9%) | 0 (0.0%) |
| 35 to 64 Years | 0 (0.0%) | 0 (0.0%) |
| 65 to 74 Years | 0 (0.0%) | 0 (0.0%) |
| 75 Years and over | 0 (0.0%) | 0 (0.0%) |
Disability Class: Self-Care Difficulty
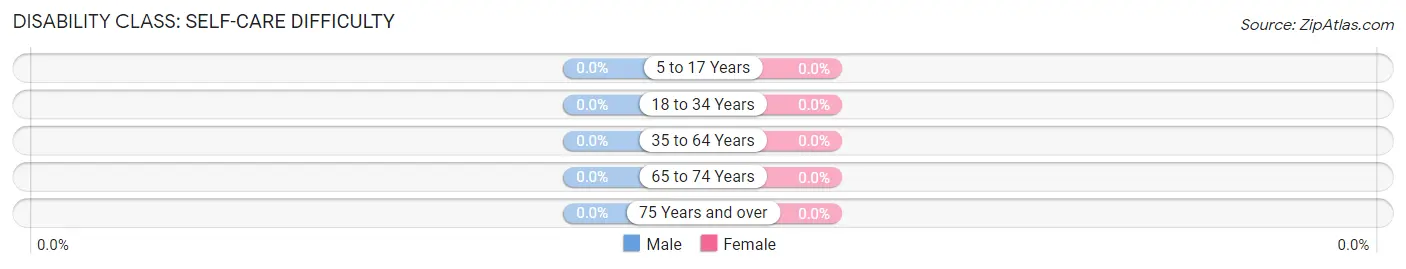
| Age Bracket | Male | Female |
| 5 to 17 Years | 0 (0.0%) | 0 (0.0%) |
| 18 to 34 Years | 0 (0.0%) | 0 (0.0%) |
| 35 to 64 Years | 0 (0.0%) | 0 (0.0%) |
| 65 to 74 Years | 0 (0.0%) | 0 (0.0%) |
| 75 Years and over | 0 (0.0%) | 0 (0.0%) |
Technology Access in Ferndale
Computing Device Access in Ferndale
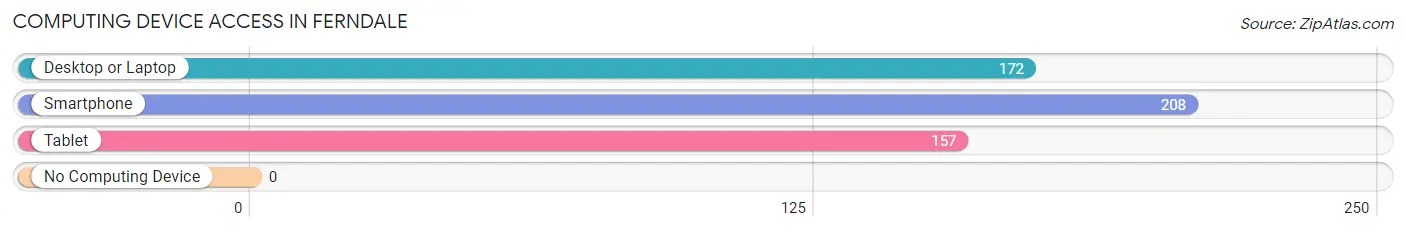
| Device Type | # Households | % Households |
| Desktop or Laptop | 172 | 82.7% |
| Smartphone | 208 | 100.0% |
| Tablet | 157 | 75.5% |
| No Computing Device | 0 | 0.0% |
| Total | 208 | 100.0% |
Internet Access in Ferndale
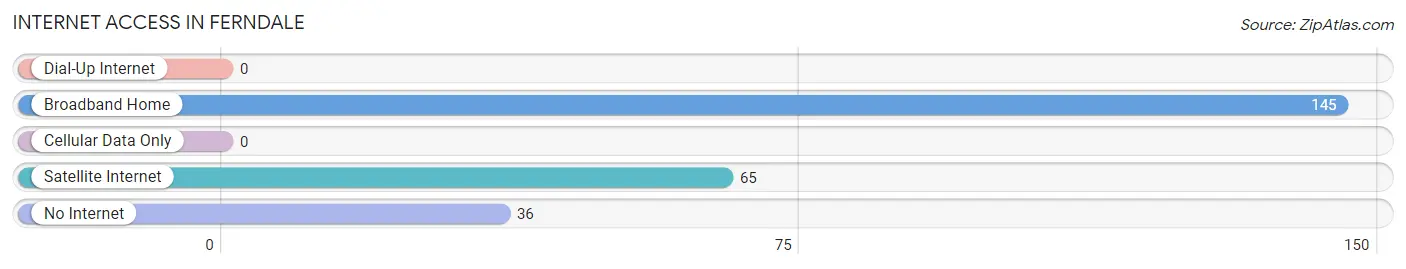
| Internet Type | # Households | % Households |
| Dial-Up Internet | 0 | 0.0% |
| Broadband Home | 145 | 69.7% |
| Cellular Data Only | 0 | 0.0% |
| Satellite Internet | 65 | 31.2% |
| No Internet | 36 | 17.3% |
| Total | 208 | 100.0% |
Ferndale Summary
Ferndale is a small town located in the state of Florida, United States. It is situated in the northern part of the state, in the county of Hillsborough. The town has a population of approximately 1,000 people, and is located about 25 miles north of Tampa.
History
Ferndale was founded in 1883 by a group of settlers from the nearby town of Plant City. The town was named after the nearby Ferndale Plantation, which was owned by the prominent local family of the same name. The town was originally a farming community, and the main crops grown were cotton, corn, and citrus.
In the early 1900s, the town began to grow and develop. The first school was built in 1910, and the first post office was established in 1911. The town also had a general store, a blacksmith shop, and a few other businesses.
In the 1920s, the town began to experience a period of growth and prosperity. The population increased, and new businesses opened up. The town also had a movie theater, a bank, and a few other businesses.
In the 1950s, the town began to decline. Many of the businesses closed, and the population began to decrease. The town was eventually annexed by the city of Plant City in the 1970s.
Geography
Ferndale is located in the northern part of Hillsborough County, Florida. It is situated about 25 miles north of Tampa. The town is located in a rural area, and is surrounded by farmland and forests. The town is located on the banks of the Hillsborough River, and is close to the Gulf of Mexico.
The climate in Ferndale is subtropical, with hot and humid summers and mild winters. The average temperature in the summer is around 90 degrees Fahrenheit, and the average temperature in the winter is around 60 degrees Fahrenheit.
Economy
The economy of Ferndale is largely based on agriculture. The town is surrounded by farmland, and the main crops grown are cotton, corn, and citrus. The town also has a few small businesses, including a general store, a bank, and a few other businesses.
Demographics
As of the 2010 census, the population of Ferndale was 1,000 people. The racial makeup of the town was 94.2% White, 2.2% African American, 0.2% Native American, 0.2% Asian, and 3.2% from other races. The median household income was $37,500, and the median family income was $41,250. The per capita income was $17,500.
Common Questions
What is Per Capita Income in Ferndale?
Per Capita income in Ferndale is $45,348.
What is the Median Family Income in Ferndale?
Median Family Income in Ferndale is $135,809.
What is Income or Wage Gap in Ferndale?
Income or Wage Gap in Ferndale is 5.1%.
Women in Ferndale earn 94.9 cents for every dollar earned by a man.
What is Inequality or Gini Index in Ferndale?
Inequality or Gini Index in Ferndale is 0.33.
What is the Total Population of Ferndale?
Total Population of Ferndale is 612.
What is the Total Male Population of Ferndale?
Total Male Population of Ferndale is 280.
What is the Total Female Population of Ferndale?
Total Female Population of Ferndale is 332.
What is the Ratio of Males per 100 Females in Ferndale?
There are 84.34 Males per 100 Females in Ferndale.
What is the Ratio of Females per 100 Males in Ferndale?
There are 118.57 Females per 100 Males in Ferndale.
What is the Median Population Age in Ferndale?
Median Population Age in Ferndale is 47.5 Years.
What is the Average Family Size in Ferndale
Average Family Size in Ferndale is 3.5 People.
What is the Average Household Size in Ferndale
Average Household Size in Ferndale is 2.9 People.
How Large is the Labor Force in Ferndale?
There are 407 People in the Labor Forcein in Ferndale.
What is the Percentage of People in the Labor Force in Ferndale?
75.9% of People are in the Labor Force in Ferndale.