Glencoe, FL Map & Demographics
Glencoe Map
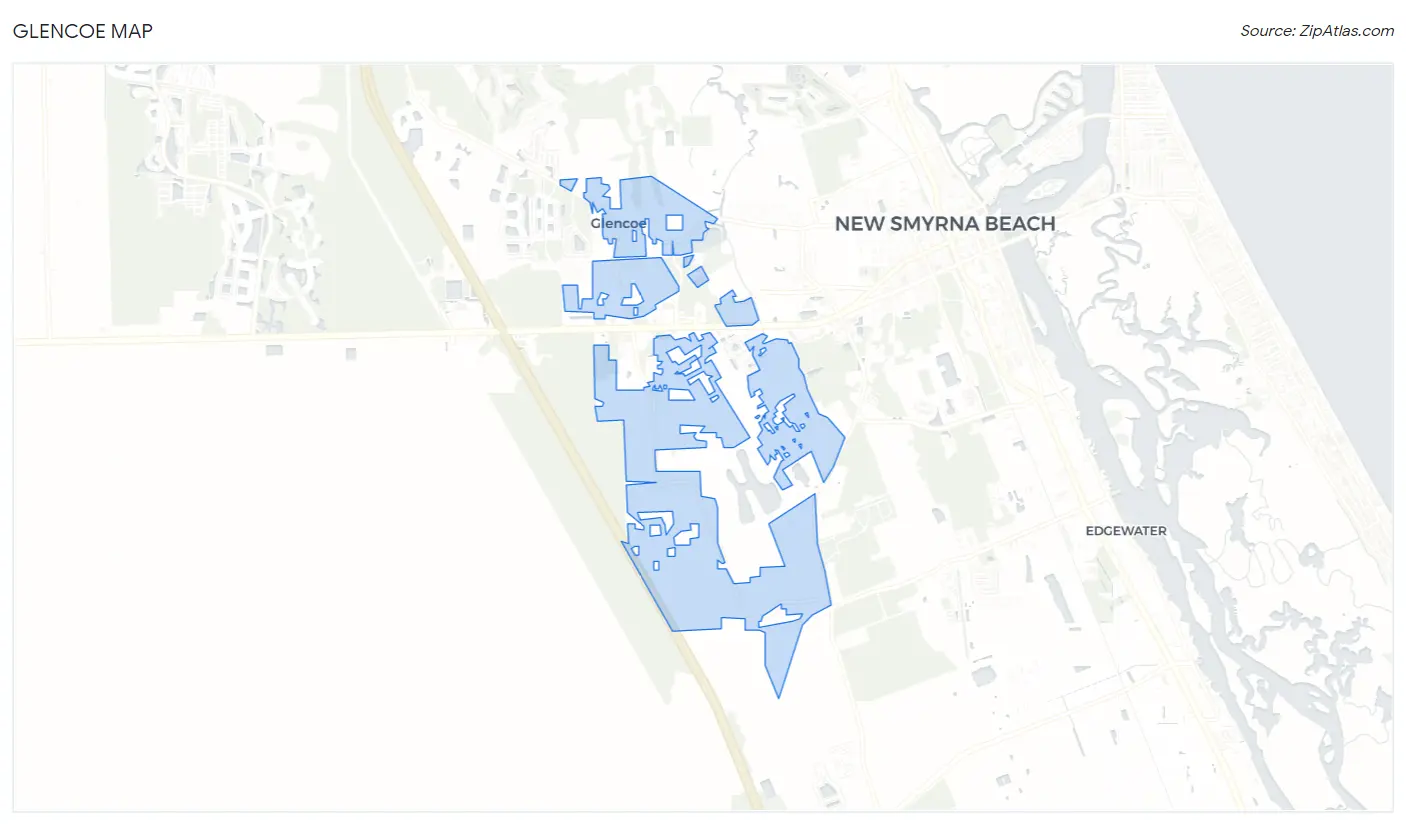
Glencoe Overview
$38,322
PER CAPITA INCOME
$77,778
AVG FAMILY INCOME
$51,192
AVG HOUSEHOLD INCOME
0.46
INEQUALITY / GINI INDEX
1,418
TOTAL POPULATION
673
MALE POPULATION
745
FEMALE POPULATION
90.34
MALES / 100 FEMALES
110.70
FEMALES / 100 MALES
41.8
MEDIAN AGE
3.0
AVG FAMILY SIZE
2.4
AVG HOUSEHOLD SIZE
833
LABOR FORCE [ PEOPLE ]
73.1%
PERCENT IN LABOR FORCE
2.3%
UNEMPLOYMENT RATE
Income in Glencoe
Income Overview in Glencoe
Per Capita Income in Glencoe is $38,322, while median incomes of families and households are $77,778 and $51,192 respectively.
| Characteristic | Number | Measure |
| Per Capita Income | 1,418 | $38,322 |
| Median Family Income | 392 | $77,778 |
| Mean Family Income | 392 | $108,410 |
| Median Household Income | 595 | $51,192 |
| Mean Household Income | 595 | $89,199 |
| Income Deficit | 392 | $0 |
| Wage / Income Gap (%) | 1,418 | 0.00% |
| Wage / Income Gap ($) | 1,418 | 100.00¢ per $1 |
| Gini / Inequality Index | 1,418 | 0.46 |
Earnings by Sex in Glencoe
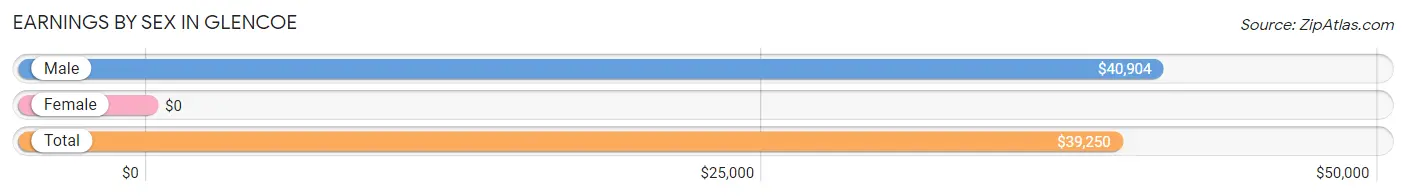
| Sex | Number | Average Earnings |
| Male | 502 (58.8%) | $40,904 |
| Female | 352 (41.2%) | $0 |
| Total | 854 (100.0%) | $39,250 |
Earnings by Sex by Income Bracket in Glencoe
The most common earnings brackets in Glencoe are $25,000 to $29,999 for men (86 | 17.1%) and $10,000 to $12,499 for women (66 | 18.8%).
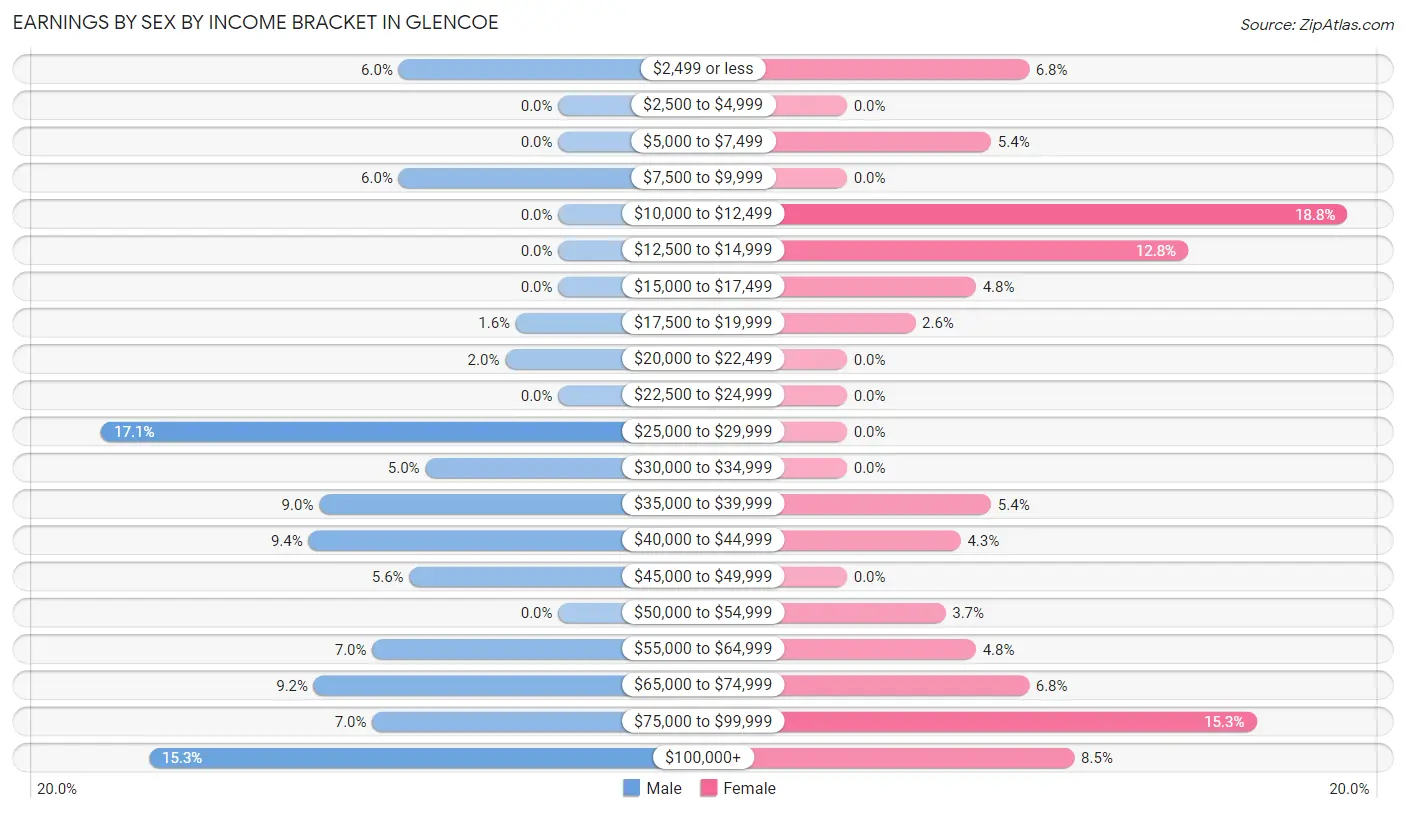
| Income | Male | Female |
| $2,499 or less | 30 (6.0%) | 24 (6.8%) |
| $2,500 to $4,999 | 0 (0.0%) | 0 (0.0%) |
| $5,000 to $7,499 | 0 (0.0%) | 19 (5.4%) |
| $7,500 to $9,999 | 30 (6.0%) | 0 (0.0%) |
| $10,000 to $12,499 | 0 (0.0%) | 66 (18.8%) |
| $12,500 to $14,999 | 0 (0.0%) | 45 (12.8%) |
| $15,000 to $17,499 | 0 (0.0%) | 17 (4.8%) |
| $17,500 to $19,999 | 8 (1.6%) | 9 (2.6%) |
| $20,000 to $22,499 | 10 (2.0%) | 0 (0.0%) |
| $22,500 to $24,999 | 0 (0.0%) | 0 (0.0%) |
| $25,000 to $29,999 | 86 (17.1%) | 0 (0.0%) |
| $30,000 to $34,999 | 25 (5.0%) | 0 (0.0%) |
| $35,000 to $39,999 | 45 (9.0%) | 19 (5.4%) |
| $40,000 to $44,999 | 47 (9.4%) | 15 (4.3%) |
| $45,000 to $49,999 | 28 (5.6%) | 0 (0.0%) |
| $50,000 to $54,999 | 0 (0.0%) | 13 (3.7%) |
| $55,000 to $64,999 | 35 (7.0%) | 17 (4.8%) |
| $65,000 to $74,999 | 46 (9.2%) | 24 (6.8%) |
| $75,000 to $99,999 | 35 (7.0%) | 54 (15.3%) |
| $100,000+ | 77 (15.3%) | 30 (8.5%) |
| Total | 502 (100.0%) | 352 (100.0%) |
Earnings by Sex by Educational Attainment in Glencoe
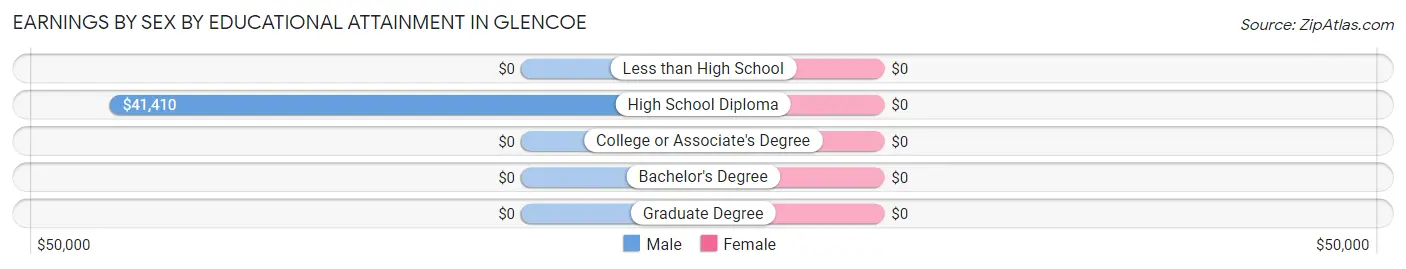
| Educational Attainment | Male Income | Female Income |
| Less than High School | - | - |
| High School Diploma | $41,410 | $0 |
| College or Associate's Degree | - | - |
| Bachelor's Degree | - | - |
| Graduate Degree | - | - |
| Total | $41,862 | $0 |
Family Income in Glencoe
Family Income Brackets in Glencoe
According to the Glencoe family income data, there are 134 families falling into the $35,000 to $49,999 income range, which is the most common income bracket and makes up 34.2% of all families.
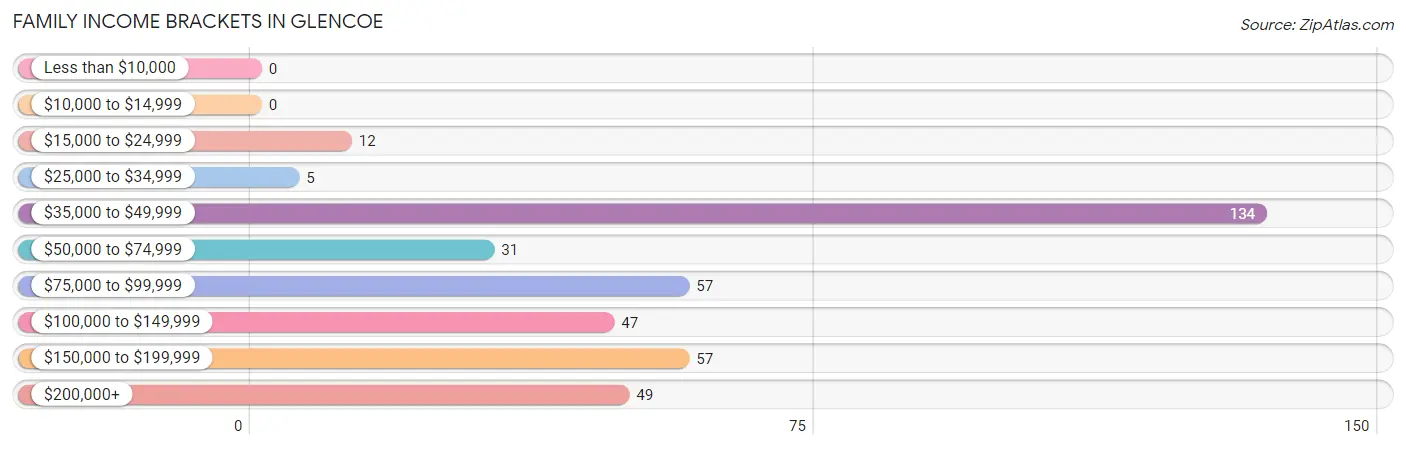
| Income Bracket | # Families | % Families |
| Less than $10,000 | 0 | 0.0% |
| $10,000 to $14,999 | 0 | 0.0% |
| $15,000 to $24,999 | 12 | 3.1% |
| $25,000 to $34,999 | 5 | 1.3% |
| $35,000 to $49,999 | 134 | 34.2% |
| $50,000 to $74,999 | 31 | 7.9% |
| $75,000 to $99,999 | 57 | 14.5% |
| $100,000 to $149,999 | 47 | 12.0% |
| $150,000 to $199,999 | 57 | 14.5% |
| $200,000+ | 49 | 12.5% |
Family Income by Famaliy Size in Glencoe
3-person families (63 | 16.1%) account for the highest median family income in Glencoe with $92,986 per family, while 3-person families (63 | 16.1%) have the highest median income of $30,995 per family member.
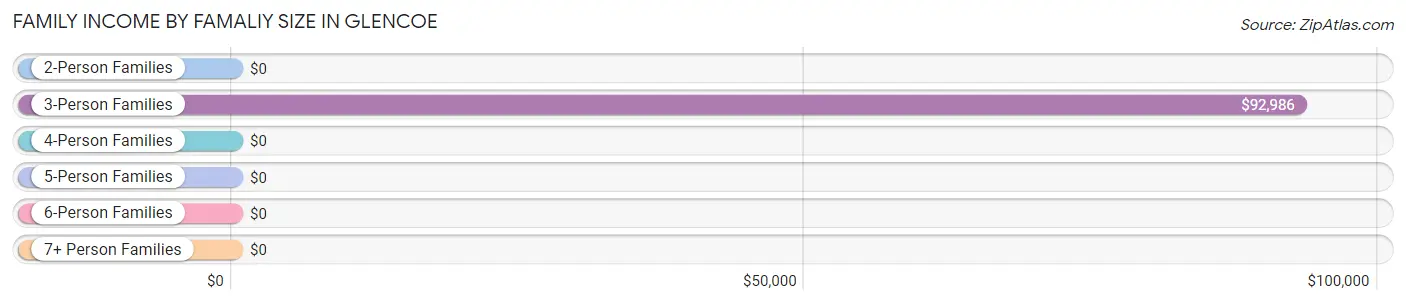
| Income Bracket | # Families | Median Income |
| 2-Person Families | 205 (52.3%) | $0 |
| 3-Person Families | 63 (16.1%) | $92,986 |
| 4-Person Families | 98 (25.0%) | $0 |
| 5-Person Families | 26 (6.6%) | $0 |
| 6-Person Families | 0 (0.0%) | $0 |
| 7+ Person Families | 0 (0.0%) | $0 |
| Total | 392 (100.0%) | $77,778 |
Family Income by Number of Earners in Glencoe
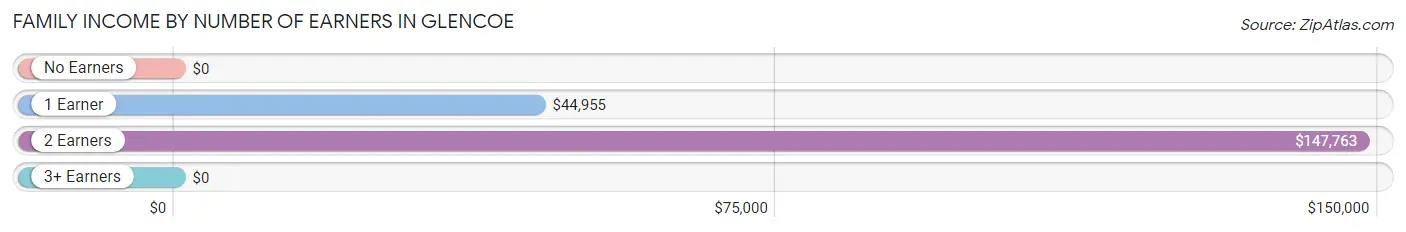
| Number of Earners | # Families | Median Income |
| No Earners | 25 (6.4%) | $0 |
| 1 Earner | 159 (40.6%) | $44,955 |
| 2 Earners | 166 (42.3%) | $147,763 |
| 3+ Earners | 42 (10.7%) | $0 |
| Total | 392 (100.0%) | $77,778 |
Household Income in Glencoe
Household Income Brackets in Glencoe
With 184 households falling in the category, the $35,000 to $49,999 income range is the most frequent in Glencoe, accounting for 30.9% of all households. In contrast, only 15 households (2.5%) fall into the $25,000 to $34,999 income bracket, making it the least populous group.
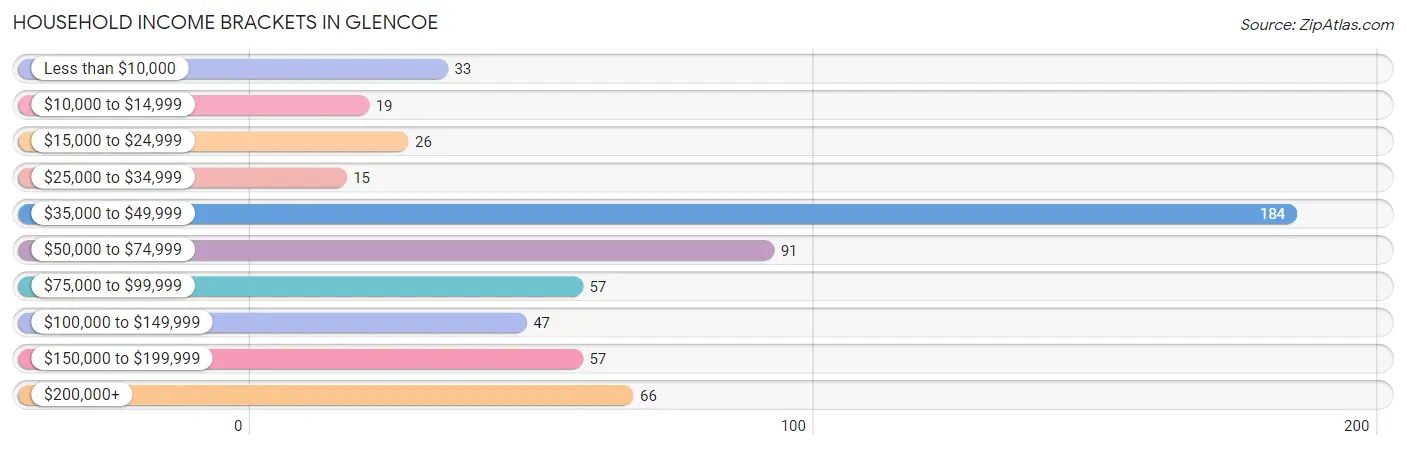
| Income Bracket | # Households | % Households |
| Less than $10,000 | 33 | 5.5% |
| $10,000 to $14,999 | 19 | 3.2% |
| $15,000 to $24,999 | 26 | 4.4% |
| $25,000 to $34,999 | 15 | 2.5% |
| $35,000 to $49,999 | 184 | 30.9% |
| $50,000 to $74,999 | 91 | 15.3% |
| $75,000 to $99,999 | 57 | 9.6% |
| $100,000 to $149,999 | 47 | 7.9% |
| $150,000 to $199,999 | 57 | 9.6% |
| $200,000+ | 66 | 11.1% |
Household Income by Householder Age in Glencoe
The median household income in Glencoe is $51,192, with the highest median household income of $94,514 found in the 45 to 64 years age bracket for the primary householder. A total of 237 households (39.8%) fall into this category.
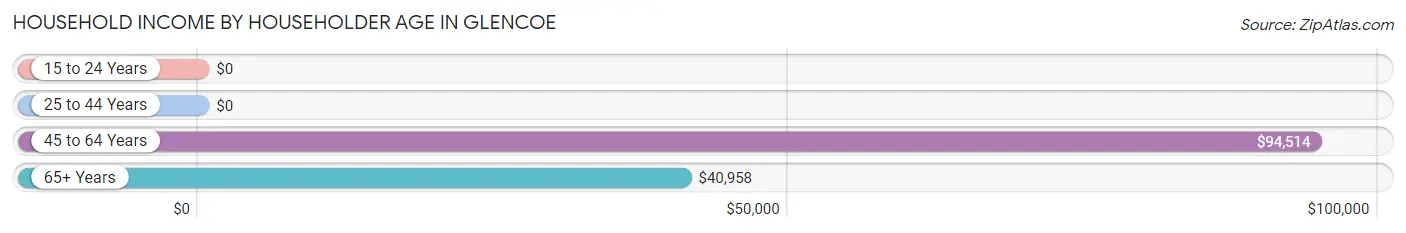
| Income Bracket | # Households | Median Income |
| 15 to 24 Years | 0 (0.0%) | $0 |
| 25 to 44 Years | 215 (36.1%) | $0 |
| 45 to 64 Years | 237 (39.8%) | $94,514 |
| 65+ Years | 143 (24.0%) | $40,958 |
| Total | 595 (100.0%) | $51,192 |
Poverty in Glencoe
Income Below Poverty by Sex and Age in Glencoe
With 6.7% poverty level for males and 8.7% for females among the residents of Glencoe, 18 to 24 year old males and 55 to 64 year old females are the most vulnerable to poverty, with 10 males (50.0%) and 21 females (27.6%) in their respective age groups living below the poverty level.
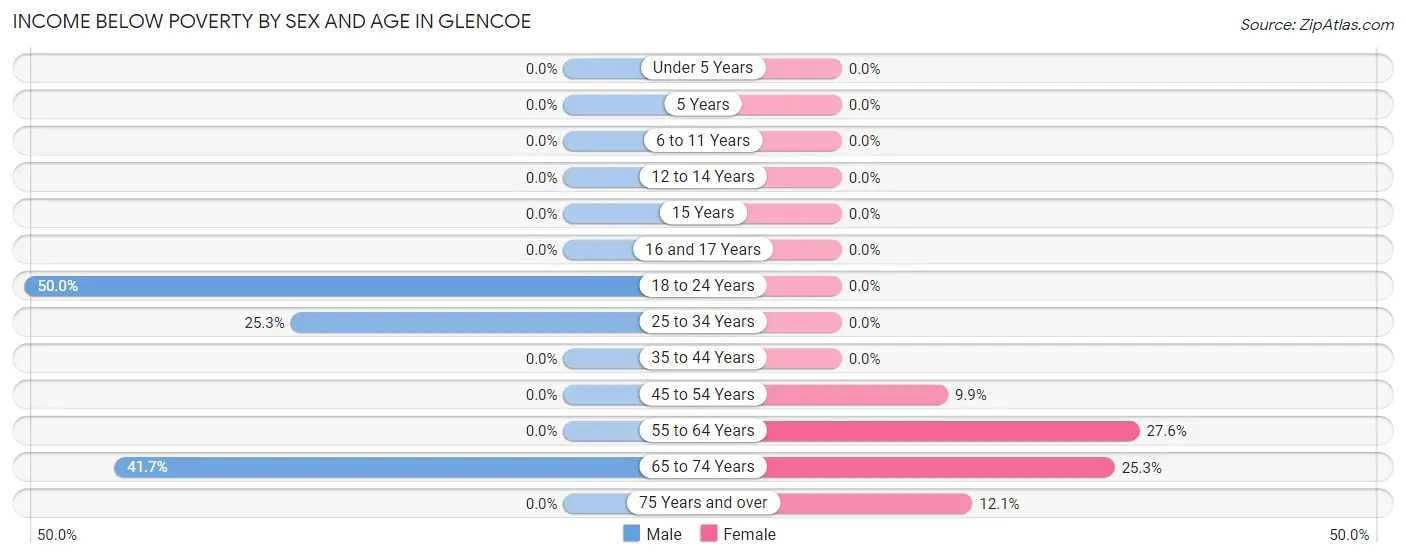
| Age Bracket | Male | Female |
| Under 5 Years | 0 (0.0%) | 0 (0.0%) |
| 5 Years | 0 (0.0%) | 0 (0.0%) |
| 6 to 11 Years | 0 (0.0%) | 0 (0.0%) |
| 12 to 14 Years | 0 (0.0%) | 0 (0.0%) |
| 15 Years | 0 (0.0%) | 0 (0.0%) |
| 16 and 17 Years | 0 (0.0%) | 0 (0.0%) |
| 18 to 24 Years | 10 (50.0%) | 0 (0.0%) |
| 25 to 34 Years | 20 (25.3%) | 0 (0.0%) |
| 35 to 44 Years | 0 (0.0%) | 0 (0.0%) |
| 45 to 54 Years | 0 (0.0%) | 13 (9.9%) |
| 55 to 64 Years | 0 (0.0%) | 21 (27.6%) |
| 65 to 74 Years | 15 (41.7%) | 19 (25.3%) |
| 75 Years and over | 0 (0.0%) | 12 (12.1%) |
| Total | 45 (6.7%) | 65 (8.7%) |
Income Above Poverty by Sex and Age in Glencoe
According to the poverty statistics in Glencoe, males aged 6 to 11 years and females aged 6 to 11 years are the age groups that are most secure financially, with 100.0% of males and 100.0% of females in these age groups living above the poverty line.
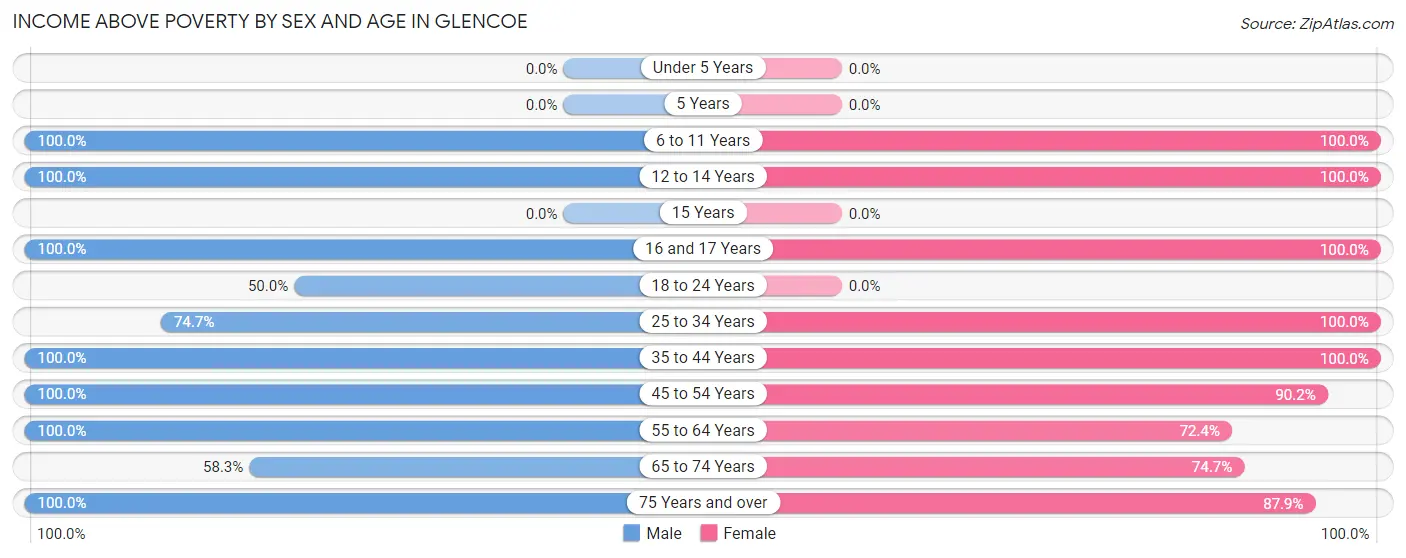
| Age Bracket | Male | Female |
| Under 5 Years | 0 (0.0%) | 0 (0.0%) |
| 5 Years | 0 (0.0%) | 0 (0.0%) |
| 6 to 11 Years | 87 (100.0%) | 79 (100.0%) |
| 12 to 14 Years | 19 (100.0%) | 93 (100.0%) |
| 15 Years | 0 (0.0%) | 0 (0.0%) |
| 16 and 17 Years | 19 (100.0%) | 69 (100.0%) |
| 18 to 24 Years | 10 (50.0%) | 0 (0.0%) |
| 25 to 34 Years | 59 (74.7%) | 35 (100.0%) |
| 35 to 44 Years | 155 (100.0%) | 87 (100.0%) |
| 45 to 54 Years | 68 (100.0%) | 119 (90.1%) |
| 55 to 64 Years | 155 (100.0%) | 55 (72.4%) |
| 65 to 74 Years | 21 (58.3%) | 56 (74.7%) |
| 75 Years and over | 35 (100.0%) | 87 (87.9%) |
| Total | 628 (93.3%) | 680 (91.3%) |
Income Below Poverty Among Married-Couple Families in Glencoe
| Children | Above Poverty | Below Poverty |
| No Children | 116 (100.0%) | 0 (0.0%) |
| 1 or 2 Children | 145 (100.0%) | 0 (0.0%) |
| 3 or 4 Children | 26 (100.0%) | 0 (0.0%) |
| 5 or more Children | 0 (0.0%) | 0 (0.0%) |
| Total | 287 (100.0%) | 0 (0.0%) |
Income Below Poverty Among Single-Parent Households in Glencoe
| Children | Single Father | Single Mother |
| No Children | 0 (0.0%) | 12 (70.6%) |
| 1 or 2 Children | 0 (0.0%) | 0 (0.0%) |
| 3 or 4 Children | 0 (0.0%) | 0 (0.0%) |
| 5 or more Children | 0 (0.0%) | 0 (0.0%) |
| Total | 0 (0.0%) | 12 (35.3%) |
Income Below Poverty Among Married-Couple vs Single-Parent Households in Glencoe
| Children | Married-Couple Families | Single-Parent Households |
| No Children | 0 (0.0%) | 12 (29.3%) |
| 1 or 2 Children | 0 (0.0%) | 0 (0.0%) |
| 3 or 4 Children | 0 (0.0%) | 0 (0.0%) |
| 5 or more Children | 0 (0.0%) | 0 (0.0%) |
| Total | 0 (0.0%) | 12 (11.4%) |
Race in Glencoe
The most populous races in Glencoe are White / Caucasian (1,413 | 99.7%), and Two or more Races (5 | 0.4%).
| Race | # Population | % Population |
| Asian | 0 | 0.0% |
| Black / African American | 0 | 0.0% |
| Hawaiian / Pacific | 0 | 0.0% |
| Hispanic or Latino | 0 | 0.0% |
| Native / Alaskan | 0 | 0.0% |
| White / Caucasian | 1,413 | 99.7% |
| Two or more Races | 5 | 0.4% |
| Some other Race | 0 | 0.0% |
| Total | 1,418 | 100.0% |
Ancestry in Glencoe
The most populous ancestries reported in Glencoe are Irish (322 | 22.7%), English (246 | 17.3%), German (220 | 15.5%), Italian (137 | 9.7%), and Scottish (82 | 5.8%), together accounting for 71.0% of all Glencoe residents.
| Ancestry | # Population | % Population |
| American | 19 | 1.3% |
| Belgian | 14 | 1.0% |
| Dutch | 14 | 1.0% |
| Eastern European | 4 | 0.3% |
| English | 246 | 17.3% |
| French | 15 | 1.1% |
| French Canadian | 27 | 1.9% |
| German | 220 | 15.5% |
| Hungarian | 15 | 1.1% |
| Irish | 322 | 22.7% |
| Italian | 137 | 9.7% |
| Polish | 33 | 2.3% |
| Scottish | 82 | 5.8% |
| Slovak | 19 | 1.3% |
| South African | 17 | 1.2% |
| Subsaharan African | 17 | 1.2% |
| Swedish | 9 | 0.6% |
| Swiss | 15 | 1.1% |
| Welsh | 10 | 0.7% | View All 19 Rows |
Immigrants in Glencoe

| Immigration Origin | # Population | % Population | View All 0 Rows |
Sex and Age in Glencoe
Sex and Age in Glencoe
The most populous age groups in Glencoe are 40 to 44 Years (103 | 15.3%) for men and 10 to 14 Years (146 | 19.6%) for women.
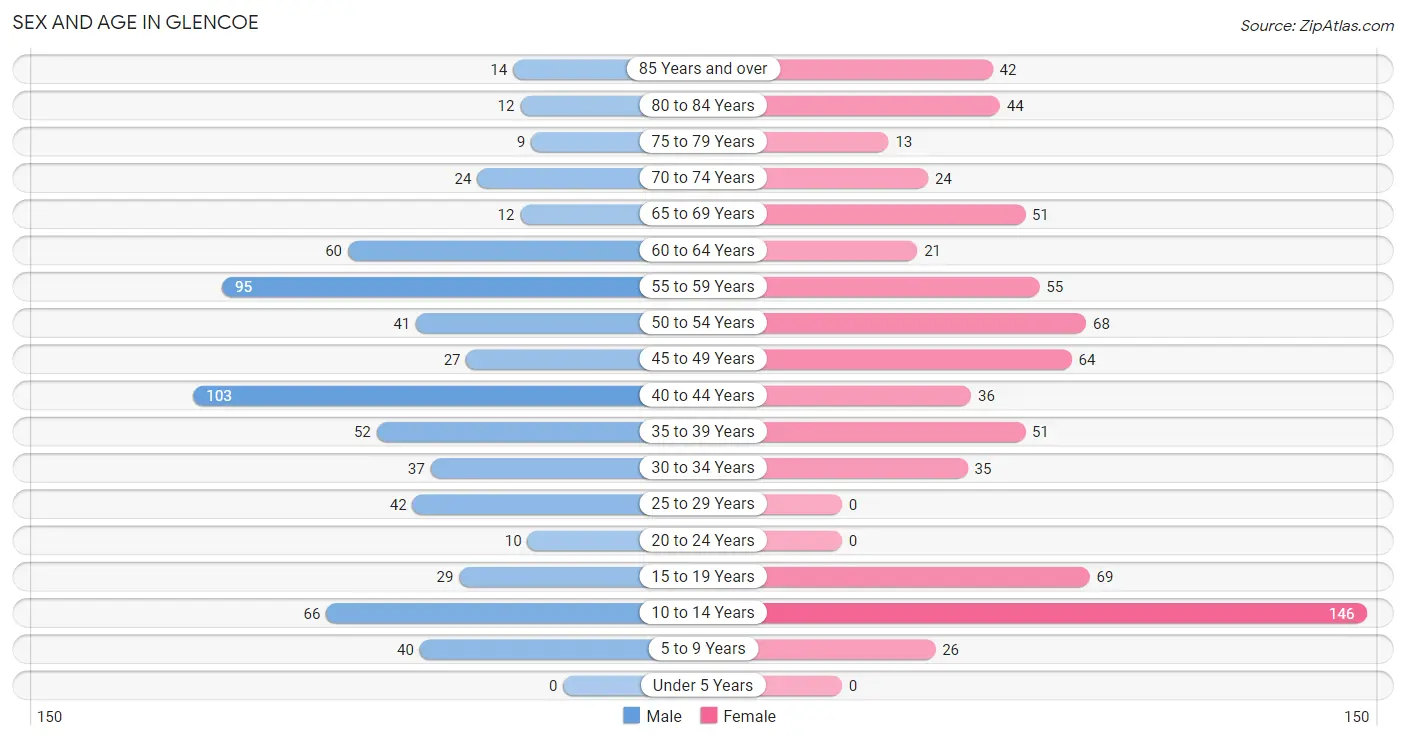
| Age Bracket | Male | Female |
| Under 5 Years | 0 (0.0%) | 0 (0.0%) |
| 5 to 9 Years | 40 (5.9%) | 26 (3.5%) |
| 10 to 14 Years | 66 (9.8%) | 146 (19.6%) |
| 15 to 19 Years | 29 (4.3%) | 69 (9.3%) |
| 20 to 24 Years | 10 (1.5%) | 0 (0.0%) |
| 25 to 29 Years | 42 (6.2%) | 0 (0.0%) |
| 30 to 34 Years | 37 (5.5%) | 35 (4.7%) |
| 35 to 39 Years | 52 (7.7%) | 51 (6.9%) |
| 40 to 44 Years | 103 (15.3%) | 36 (4.8%) |
| 45 to 49 Years | 27 (4.0%) | 64 (8.6%) |
| 50 to 54 Years | 41 (6.1%) | 68 (9.1%) |
| 55 to 59 Years | 95 (14.1%) | 55 (7.4%) |
| 60 to 64 Years | 60 (8.9%) | 21 (2.8%) |
| 65 to 69 Years | 12 (1.8%) | 51 (6.9%) |
| 70 to 74 Years | 24 (3.6%) | 24 (3.2%) |
| 75 to 79 Years | 9 (1.3%) | 13 (1.7%) |
| 80 to 84 Years | 12 (1.8%) | 44 (5.9%) |
| 85 Years and over | 14 (2.1%) | 42 (5.6%) |
| Total | 673 (100.0%) | 745 (100.0%) |
Families and Households in Glencoe
Median Family Size in Glencoe
The median family size in Glencoe is 2.97 persons per family, with married-couple families (287 | 73.2%) accounting for the largest median family size of 3.27 persons per family. On the other hand, single male/father families (71 | 18.1%) represent the smallest median family size with 2.08 persons per family.
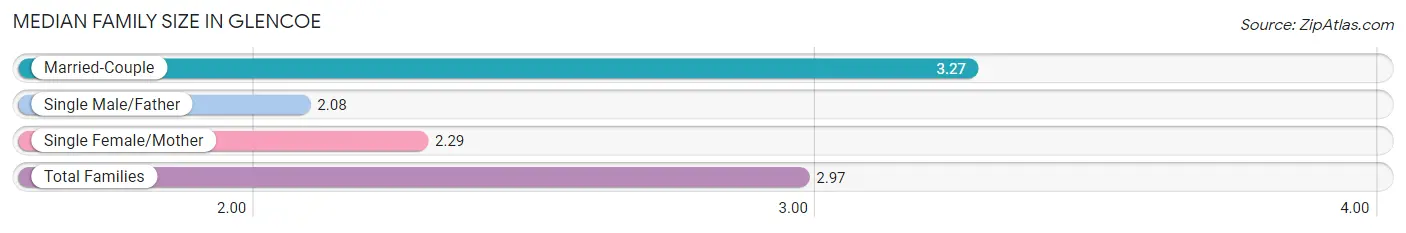
| Family Type | # Families | Family Size |
| Married-Couple | 287 (73.2%) | 3.27 |
| Single Male/Father | 71 (18.1%) | 2.08 |
| Single Female/Mother | 34 (8.7%) | 2.29 |
| Total Families | 392 (100.0%) | 2.97 |
Median Household Size in Glencoe
The median household size in Glencoe is 2.38 persons per household, with married-couple households (287 | 48.2%) accounting for the largest median household size of 3.27 persons per household. non-family households (203 | 34.1%) represent the smallest median household size with 1.20 persons per household.
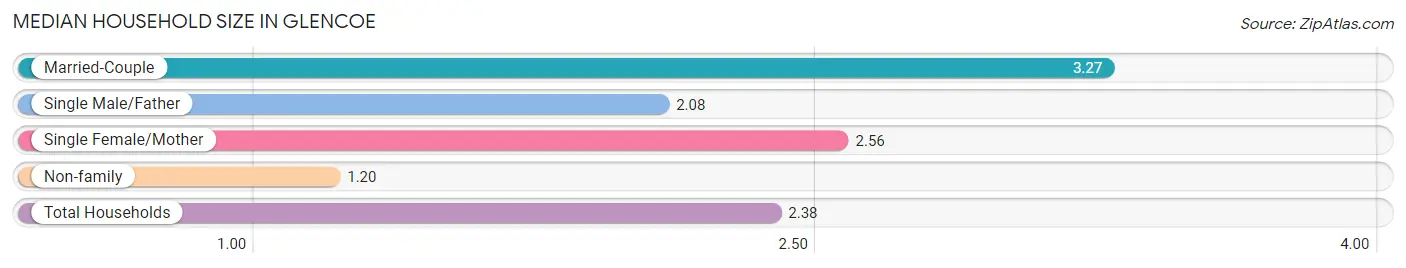
| Household Type | # Households | Household Size |
| Married-Couple | 287 (48.2%) | 3.27 |
| Single Male/Father | 71 (11.9%) | 2.08 |
| Single Female/Mother | 34 (5.7%) | 2.56 |
| Non-family | 203 (34.1%) | 1.20 |
| Total Households | 595 (100.0%) | 2.38 |
Household Size by Marriage Status in Glencoe
Out of a total of 595 households in Glencoe, 392 (65.9%) are family households, while 203 (34.1%) are nonfamily households. The most numerous type of family households are 2-person households, comprising 200, and the most common type of nonfamily households are 1-person households, comprising 172.
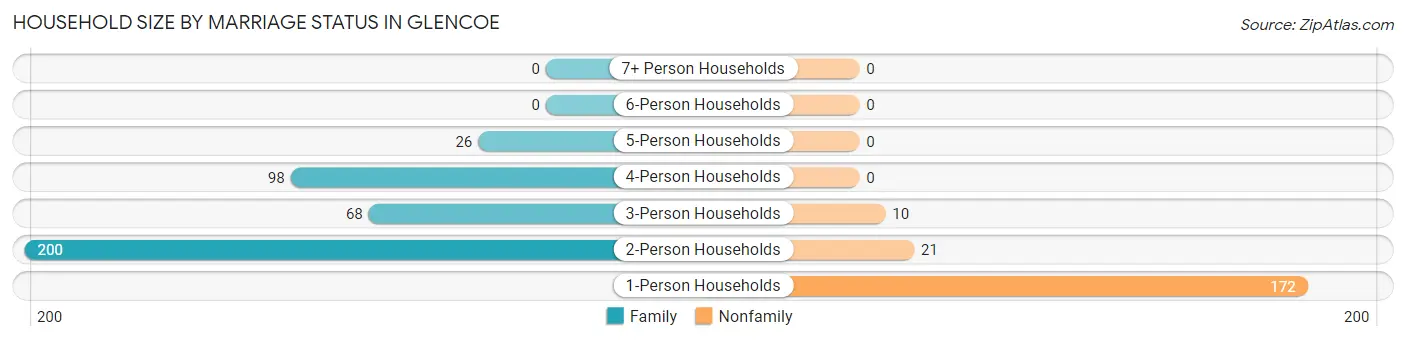
| Household Size | Family Households | Nonfamily Households |
| 1-Person Households | - | 172 (28.9%) |
| 2-Person Households | 200 (33.6%) | 21 (3.5%) |
| 3-Person Households | 68 (11.4%) | 10 (1.7%) |
| 4-Person Households | 98 (16.5%) | 0 (0.0%) |
| 5-Person Households | 26 (4.4%) | 0 (0.0%) |
| 6-Person Households | 0 (0.0%) | 0 (0.0%) |
| 7+ Person Households | 0 (0.0%) | 0 (0.0%) |
| Total | 392 (65.9%) | 203 (34.1%) |
Female Fertility in Glencoe
Fertility by Age in Glencoe
| Age Bracket | Women with Births | Births / 1,000 Women |
| 15 to 19 years | 0 (0.0%) | 0.0 |
| 20 to 34 years | 0 (0.0%) | 0.0 |
| 35 to 50 years | 0 (0.0%) | 0.0 |
| Total | 0 (0.0%) | 0.0 |
Fertility by Age by Marriage Status in Glencoe
| Age Bracket | Married | Unmarried |
| 15 to 19 years | 0 (0.0%) | 0 (0.0%) |
| 20 to 34 years | 0 (0.0%) | 0 (0.0%) |
| 35 to 50 years | 0 (0.0%) | 0 (0.0%) |
| Total | 0 (0.0%) | 0 (0.0%) |
Fertility by Education in Glencoe
| Educational Attainment | Women with Births | Births / 1,000 Women |
| Less than High School | 0 (0.0%) | 0.0 |
| High School Diploma | 0 (0.0%) | 0.0 |
| College or Associate's Degree | 0 (0.0%) | 0.0 |
| Bachelor's Degree | 0 (0.0%) | 0.0 |
| Graduate Degree | 0 (0.0%) | 0.0 |
| Total | 0 (0.0%) | 0.0 |
Fertility by Education by Marriage Status in Glencoe
| Educational Attainment | Married | Unmarried |
| Less than High School | 0 (0.0%) | 0 (0.0%) |
| High School Diploma | 0 (0.0%) | 0 (0.0%) |
| College or Associate's Degree | 0 (0.0%) | 0 (0.0%) |
| Bachelor's Degree | 0 (0.0%) | 0 (0.0%) |
| Graduate Degree | 0 (0.0%) | 0 (0.0%) |
| Total | 0 (0.0%) | 0 (0.0%) |
Employment Characteristics in Glencoe
Employment by Class of Employer in Glencoe
Among the 814 employed individuals in Glencoe, private company employees (431 | 52.9%), self-employed (incorporated) (104 | 12.8%), and local government employees (90 | 11.1%) make up the most common classes of employment.
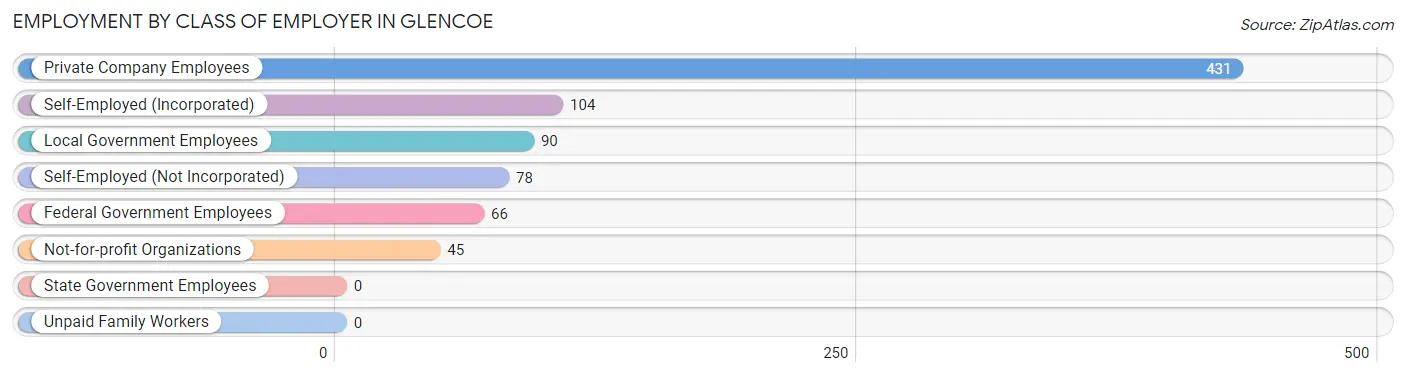
| Employer Class | # Employees | % Employees |
| Private Company Employees | 431 | 52.9% |
| Self-Employed (Incorporated) | 104 | 12.8% |
| Self-Employed (Not Incorporated) | 78 | 9.6% |
| Not-for-profit Organizations | 45 | 5.5% |
| Local Government Employees | 90 | 11.1% |
| State Government Employees | 0 | 0.0% |
| Federal Government Employees | 66 | 8.1% |
| Unpaid Family Workers | 0 | 0.0% |
| Total | 814 | 100.0% |
Employment Status by Age in Glencoe
According to the labor force statistics for Glencoe, out of the total population over 16 years of age (1,140), 73.1% or 833 individuals are in the labor force, with 2.3% or 19 of them unemployed. The age group with the highest labor force participation rate is 20 to 24 years, with 100.0% or 10 individuals in the labor force. Within the labor force, the 35 to 44 years age range has the highest percentage of unemployed individuals, with 7.9% or 19 of them being unemployed.
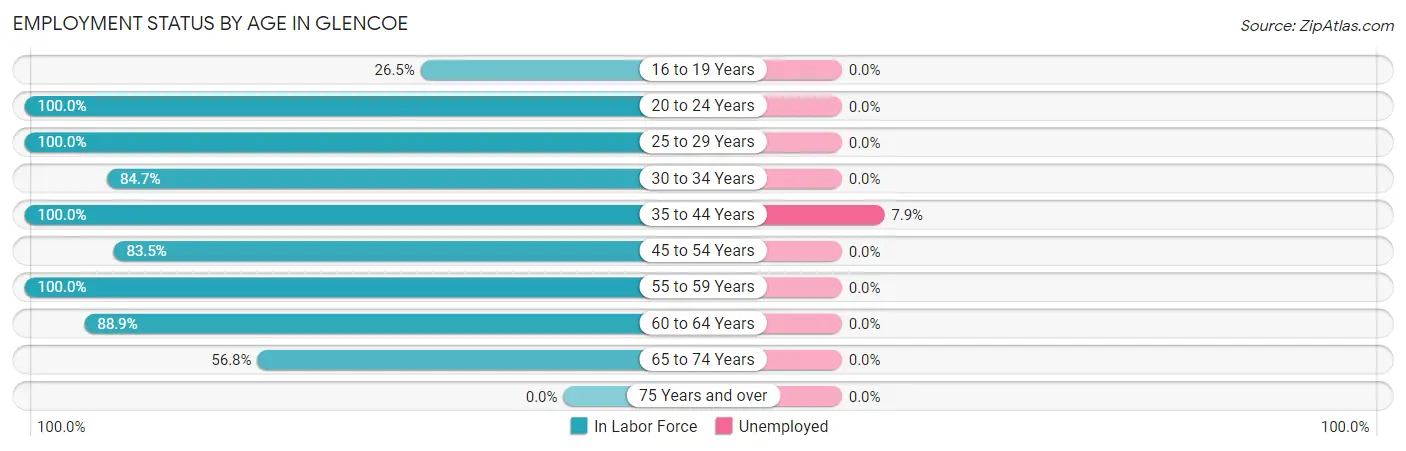
| Age Bracket | In Labor Force | Unemployed |
| 16 to 19 Years | 26 (26.5%) | 0 (0.0%) |
| 20 to 24 Years | 10 (100.0%) | 0 (0.0%) |
| 25 to 29 Years | 42 (100.0%) | 0 (0.0%) |
| 30 to 34 Years | 61 (84.7%) | 0 (0.0%) |
| 35 to 44 Years | 242 (100.0%) | 19 (7.9%) |
| 45 to 54 Years | 167 (83.5%) | 0 (0.0%) |
| 55 to 59 Years | 150 (100.0%) | 0 (0.0%) |
| 60 to 64 Years | 72 (88.9%) | 0 (0.0%) |
| 65 to 74 Years | 63 (56.8%) | 0 (0.0%) |
| 75 Years and over | 0 (0.0%) | 0 (0.0%) |
| Total | 833 (73.1%) | 19 (2.3%) |
Employment Status by Educational Attainment in Glencoe
According to labor force statistics for Glencoe, 93.3% of individuals (734) out of the total population between 25 and 64 years of age (787) are in the labor force, with 2.6% or 19 of them being unemployed. The group with the highest labor force participation rate are those with the educational attainment of bachelor's degree or higher, with 100.0% or 169 individuals in the labor force. Within the labor force, individuals with bachelor's degree or higher education have the highest percentage of unemployment, with 11.2% or 19 of them being unemployed.
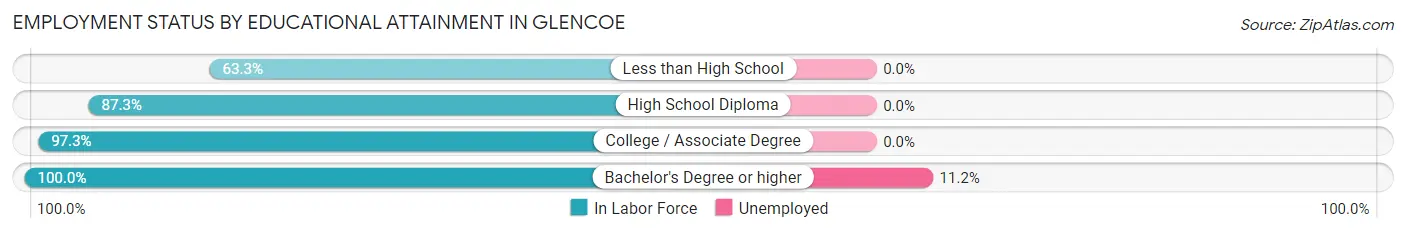
| Educational Attainment | In Labor Force | Unemployed |
| Less than High School | 19 (63.3%) | 0 (0.0%) |
| High School Diploma | 227 (87.3%) | 0 (0.0%) |
| College / Associate Degree | 319 (97.3%) | 0 (0.0%) |
| Bachelor's Degree or higher | 169 (100.0%) | 19 (11.2%) |
| Total | 734 (93.3%) | 20 (2.6%) |
Employment Occupations by Sex in Glencoe
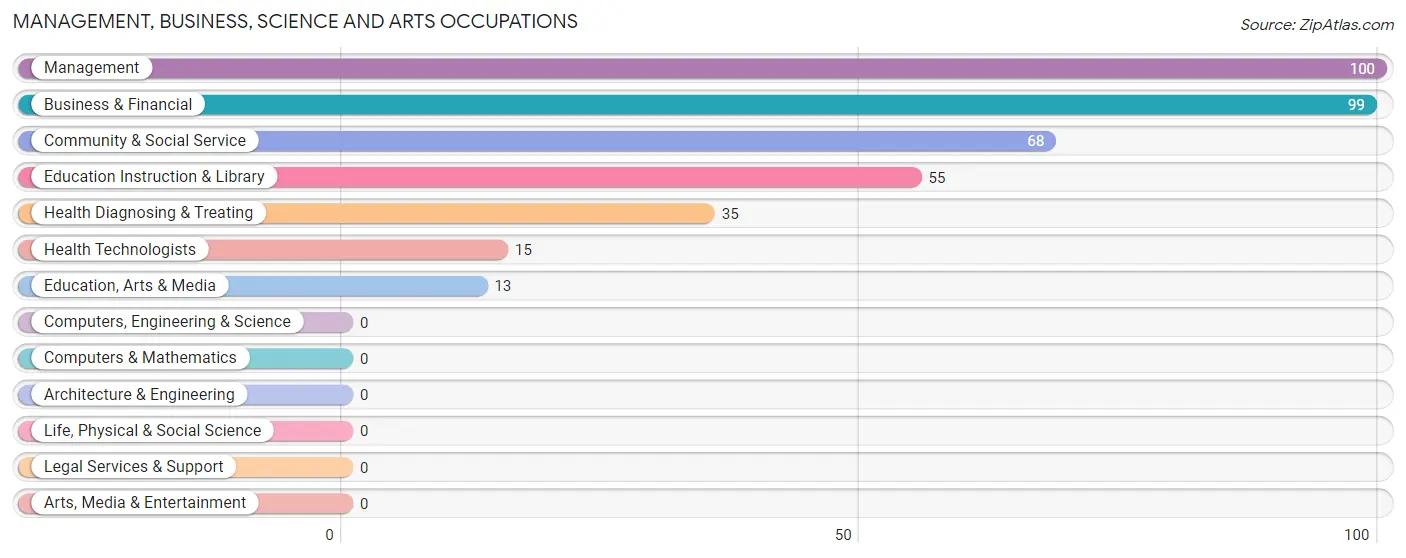
Management, Business, Science and Arts Occupations
The most common Management, Business, Science and Arts occupations in Glencoe are Management (100 | 12.3%), Business & Financial (99 | 12.2%), Community & Social Service (68 | 8.4%), Education Instruction & Library (55 | 6.8%), and Health Diagnosing & Treating (35 | 4.3%).
Management, Business, Science and Arts Occupations by Sex
Within the Management, Business, Science and Arts occupations in Glencoe, the most male-oriented occupations are Business & Financial (73.7%), Management (63.0%), and Health Diagnosing & Treating (57.1%), while the most female-oriented occupations are Community & Social Service (100.0%), Education, Arts & Media (100.0%), and Education Instruction & Library (100.0%).
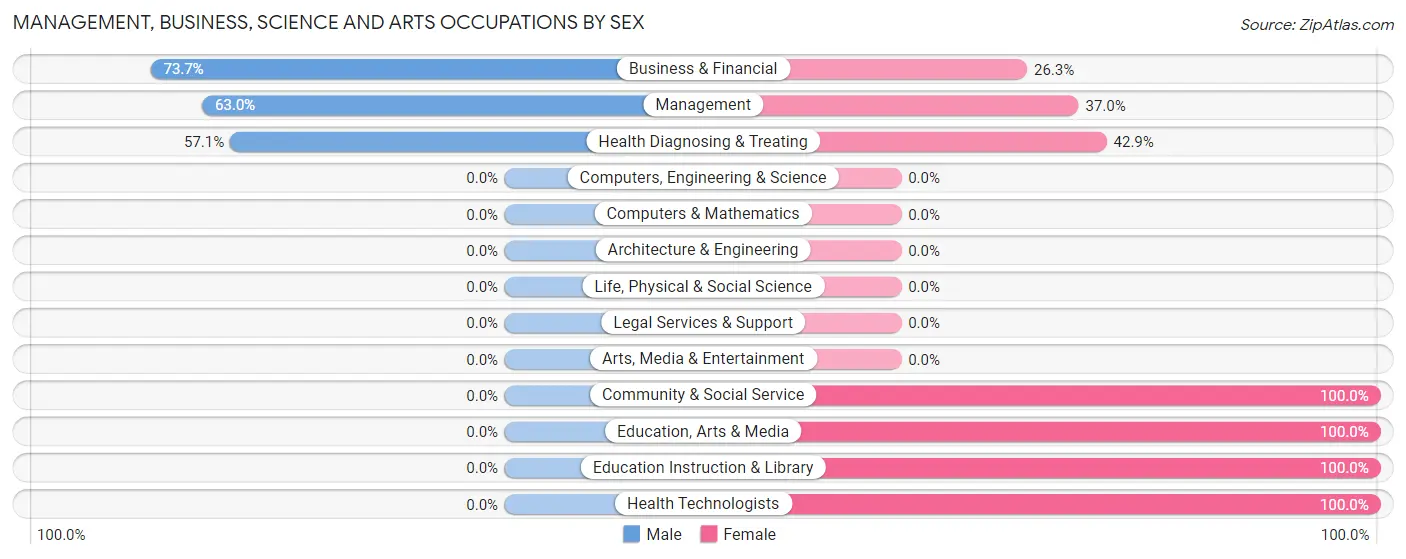
| Occupation | Male | Female |
| Management | 63 (63.0%) | 37 (37.0%) |
| Business & Financial | 73 (73.7%) | 26 (26.3%) |
| Computers, Engineering & Science | 0 (0.0%) | 0 (0.0%) |
| Computers & Mathematics | 0 (0.0%) | 0 (0.0%) |
| Architecture & Engineering | 0 (0.0%) | 0 (0.0%) |
| Life, Physical & Social Science | 0 (0.0%) | 0 (0.0%) |
| Community & Social Service | 0 (0.0%) | 68 (100.0%) |
| Education, Arts & Media | 0 (0.0%) | 13 (100.0%) |
| Legal Services & Support | 0 (0.0%) | 0 (0.0%) |
| Education Instruction & Library | 0 (0.0%) | 55 (100.0%) |
| Arts, Media & Entertainment | 0 (0.0%) | 0 (0.0%) |
| Health Diagnosing & Treating | 20 (57.1%) | 15 (42.9%) |
| Health Technologists | 0 (0.0%) | 15 (100.0%) |
| Total (Category) | 156 (51.7%) | 146 (48.3%) |
| Total (Overall) | 488 (60.0%) | 326 (40.1%) |
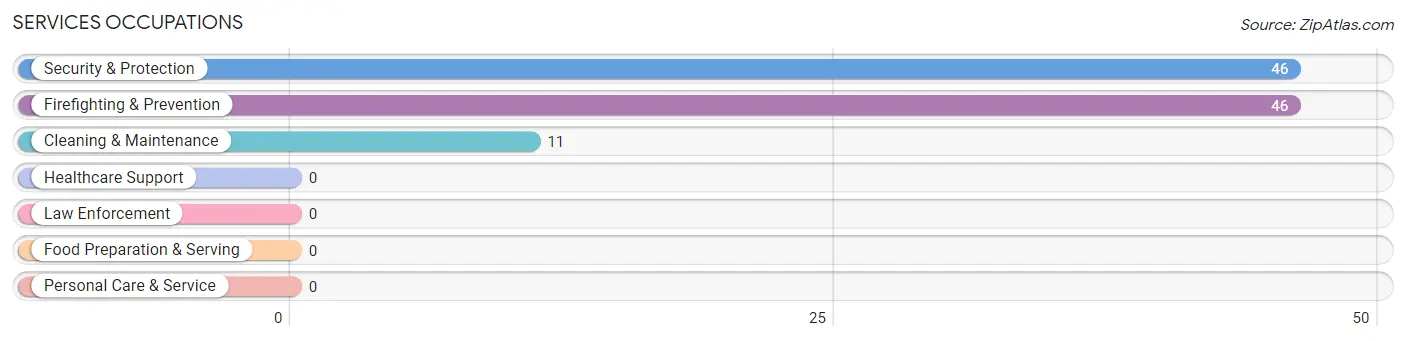
Services Occupations
The most common Services occupations in Glencoe are Security & Protection (46 | 5.7%), Firefighting & Prevention (46 | 5.7%), and Cleaning & Maintenance (11 | 1.3%).
Services Occupations by Sex
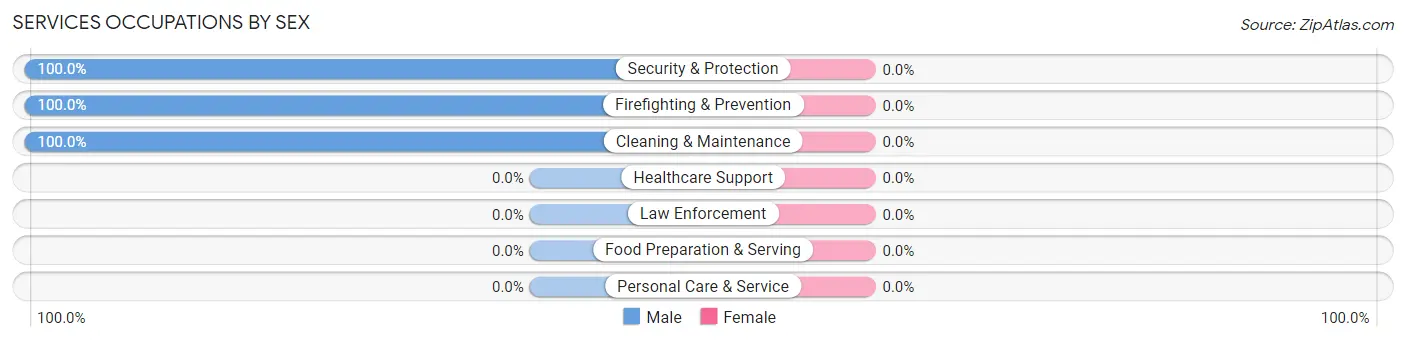
| Occupation | Male | Female |
| Healthcare Support | 0 (0.0%) | 0 (0.0%) |
| Security & Protection | 46 (100.0%) | 0 (0.0%) |
| Firefighting & Prevention | 46 (100.0%) | 0 (0.0%) |
| Law Enforcement | 0 (0.0%) | 0 (0.0%) |
| Food Preparation & Serving | 0 (0.0%) | 0 (0.0%) |
| Cleaning & Maintenance | 11 (100.0%) | 0 (0.0%) |
| Personal Care & Service | 0 (0.0%) | 0 (0.0%) |
| Total (Category) | 57 (100.0%) | 0 (0.0%) |
| Total (Overall) | 488 (60.0%) | 326 (40.1%) |
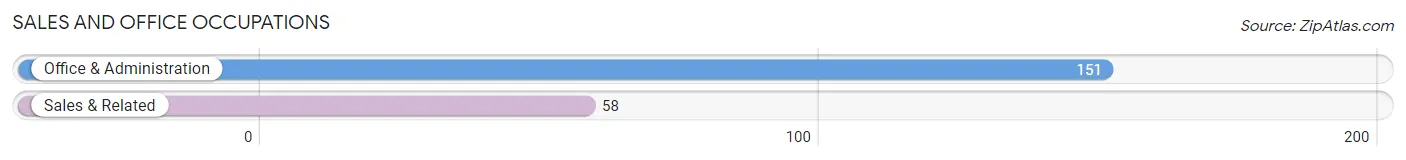
Sales and Office Occupations
The most common Sales and Office occupations in Glencoe are Office & Administration (151 | 18.5%), and Sales & Related (58 | 7.1%).
Sales and Office Occupations by Sex
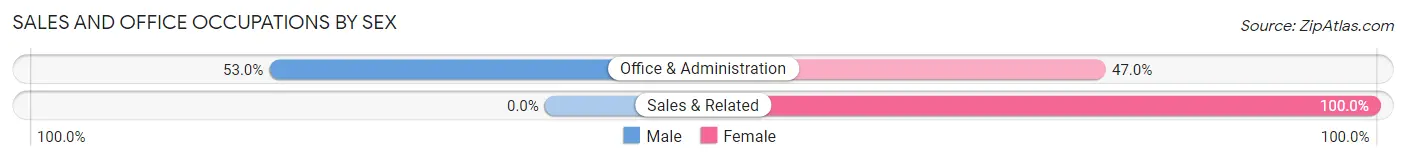
| Occupation | Male | Female |
| Sales & Related | 0 (0.0%) | 58 (100.0%) |
| Office & Administration | 80 (53.0%) | 71 (47.0%) |
| Total (Category) | 80 (38.3%) | 129 (61.7%) |
| Total (Overall) | 488 (60.0%) | 326 (40.1%) |
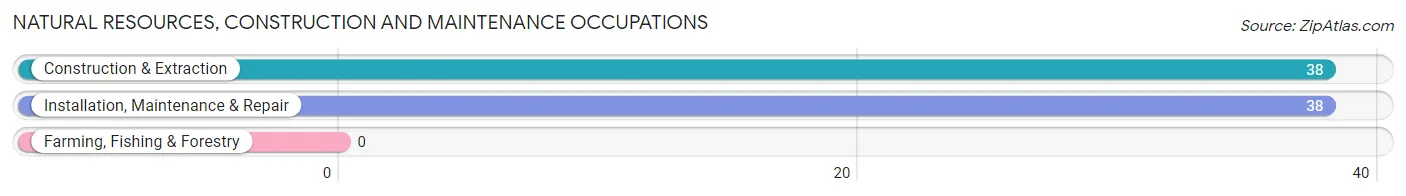
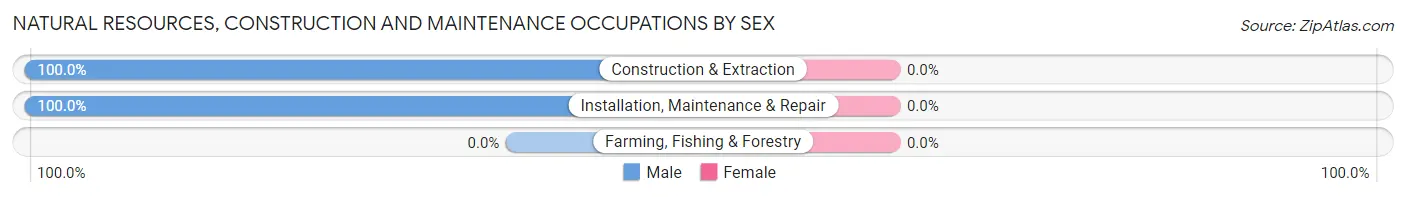
Natural Resources, Construction and Maintenance Occupations
The most common Natural Resources, Construction and Maintenance occupations in Glencoe are Construction & Extraction (38 | 4.7%), and Installation, Maintenance & Repair (38 | 4.7%).
Natural Resources, Construction and Maintenance Occupations by Sex
| Occupation | Male | Female |
| Farming, Fishing & Forestry | 0 (0.0%) | 0 (0.0%) |
| Construction & Extraction | 38 (100.0%) | 0 (0.0%) |
| Installation, Maintenance & Repair | 38 (100.0%) | 0 (0.0%) |
| Total (Category) | 76 (100.0%) | 0 (0.0%) |
| Total (Overall) | 488 (60.0%) | 326 (40.1%) |
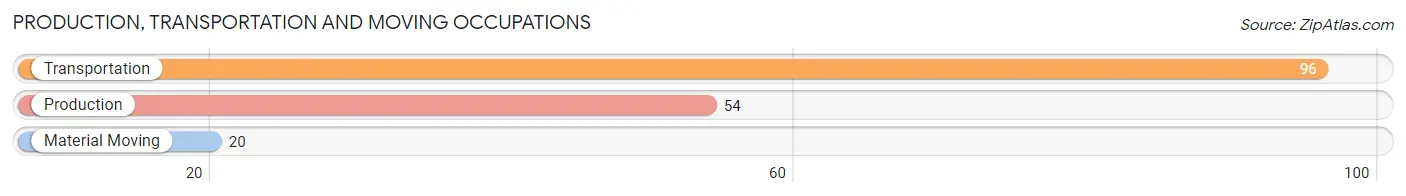
Production, Transportation and Moving Occupations
The most common Production, Transportation and Moving occupations in Glencoe are Transportation (96 | 11.8%), Production (54 | 6.6%), and Material Moving (20 | 2.5%).
Production, Transportation and Moving Occupations by Sex
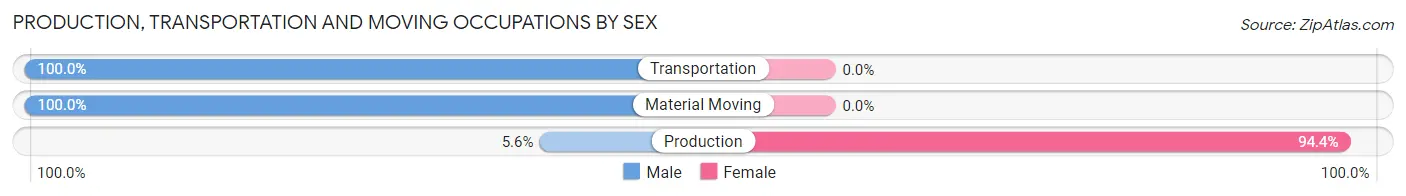
| Occupation | Male | Female |
| Production | 3 (5.6%) | 51 (94.4%) |
| Transportation | 96 (100.0%) | 0 (0.0%) |
| Material Moving | 20 (100.0%) | 0 (0.0%) |
| Total (Category) | 119 (70.0%) | 51 (30.0%) |
| Total (Overall) | 488 (60.0%) | 326 (40.1%) |
Employment Industries by Sex in Glencoe
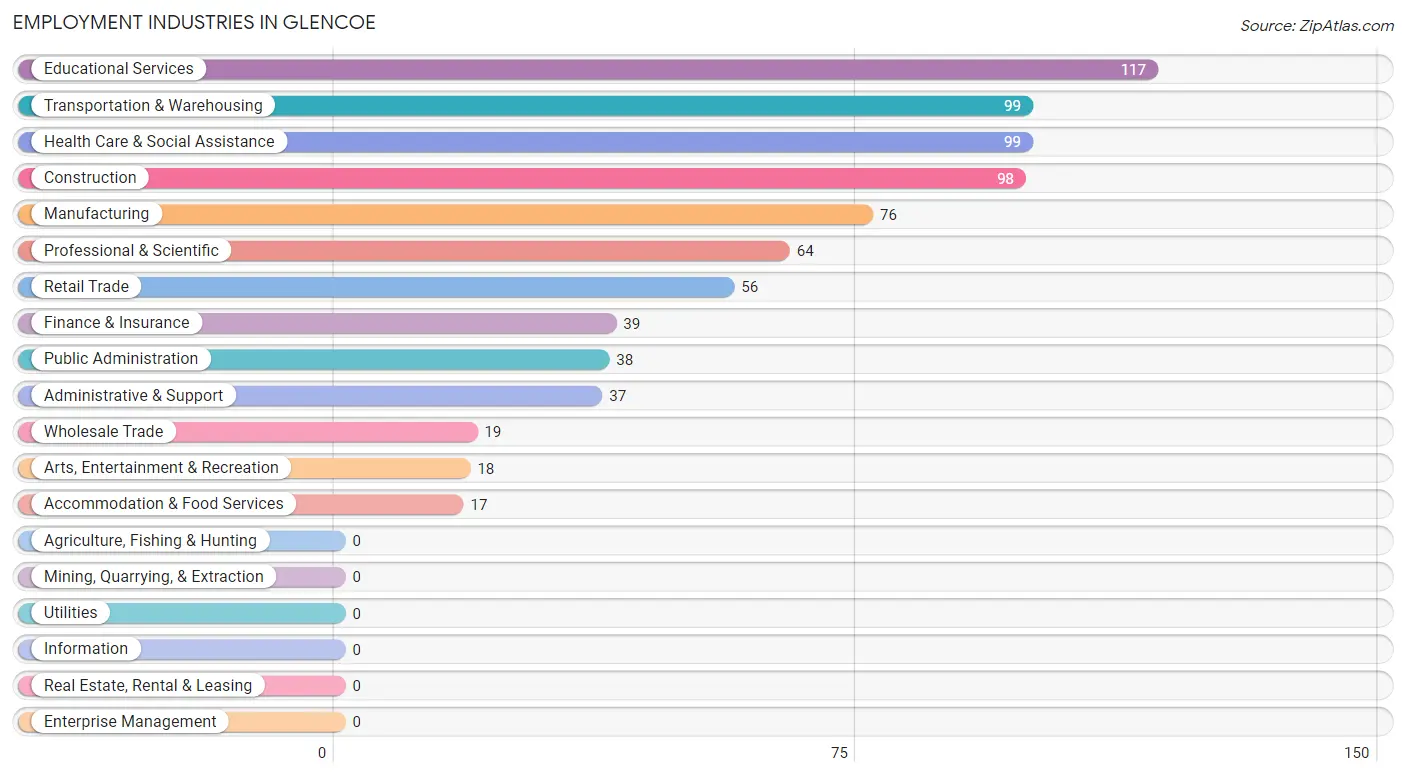
Employment Industries in Glencoe
The major employment industries in Glencoe include Educational Services (117 | 14.4%), Transportation & Warehousing (99 | 12.2%), Health Care & Social Assistance (99 | 12.2%), Construction (98 | 12.0%), and Manufacturing (76 | 9.3%).
Employment Industries by Sex in Glencoe
The Glencoe industries that see more men than women are Professional & Scientific (100.0%), Public Administration (100.0%), and Transportation & Warehousing (92.9%), whereas the industries that tend to have a higher number of women are Wholesale Trade (100.0%), Arts, Entertainment & Recreation (100.0%), and Accommodation & Food Services (100.0%).
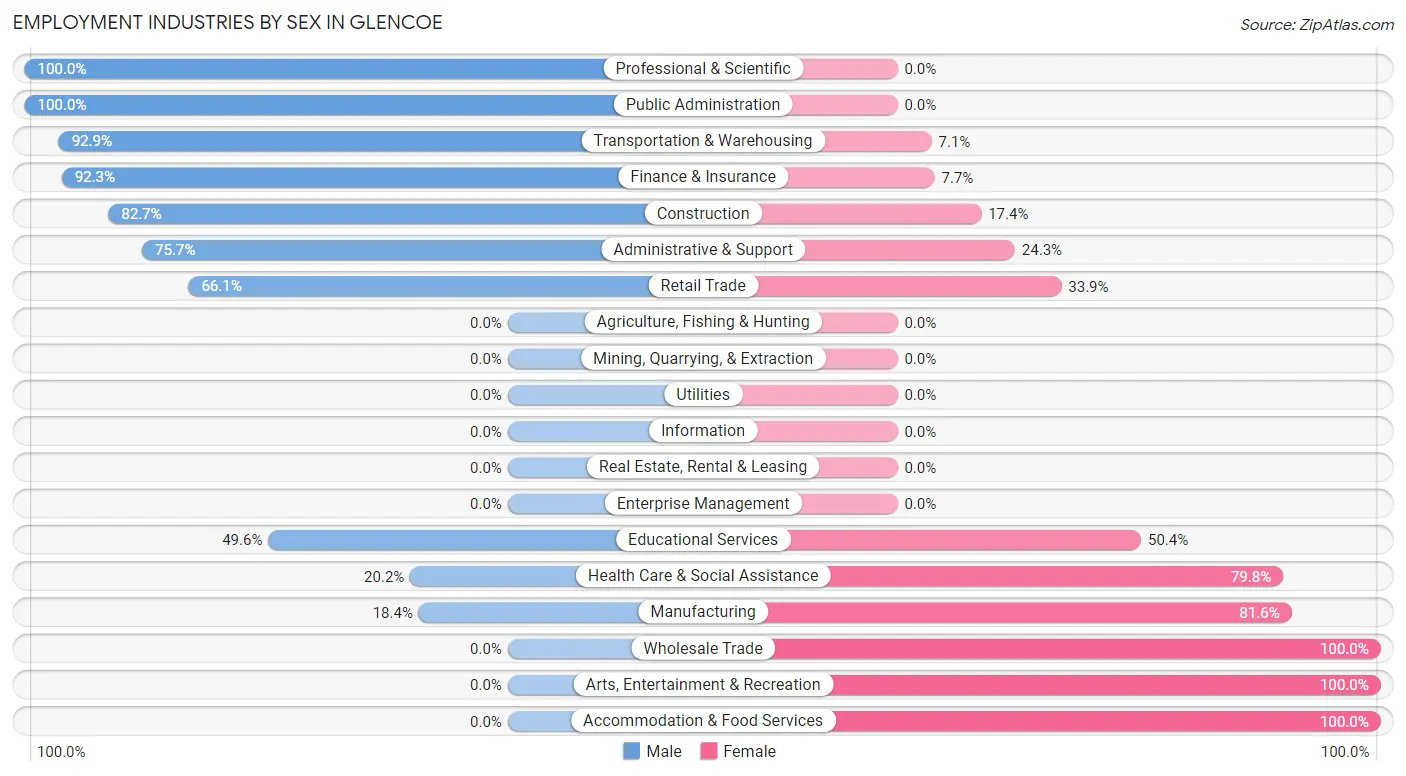
| Industry | Male | Female |
| Agriculture, Fishing & Hunting | 0 (0.0%) | 0 (0.0%) |
| Mining, Quarrying, & Extraction | 0 (0.0%) | 0 (0.0%) |
| Construction | 81 (82.7%) | 17 (17.3%) |
| Manufacturing | 14 (18.4%) | 62 (81.6%) |
| Wholesale Trade | 0 (0.0%) | 19 (100.0%) |
| Retail Trade | 37 (66.1%) | 19 (33.9%) |
| Transportation & Warehousing | 92 (92.9%) | 7 (7.1%) |
| Utilities | 0 (0.0%) | 0 (0.0%) |
| Information | 0 (0.0%) | 0 (0.0%) |
| Finance & Insurance | 36 (92.3%) | 3 (7.7%) |
| Real Estate, Rental & Leasing | 0 (0.0%) | 0 (0.0%) |
| Professional & Scientific | 64 (100.0%) | 0 (0.0%) |
| Enterprise Management | 0 (0.0%) | 0 (0.0%) |
| Administrative & Support | 28 (75.7%) | 9 (24.3%) |
| Educational Services | 58 (49.6%) | 59 (50.4%) |
| Health Care & Social Assistance | 20 (20.2%) | 79 (79.8%) |
| Arts, Entertainment & Recreation | 0 (0.0%) | 18 (100.0%) |
| Accommodation & Food Services | 0 (0.0%) | 17 (100.0%) |
| Public Administration | 38 (100.0%) | 0 (0.0%) |
| Total | 488 (60.0%) | 326 (40.1%) |
Education in Glencoe
School Enrollment in Glencoe
The most common levels of schooling among the 390 students in Glencoe are middle school (137 | 35.1%), high school (134 | 34.4%), and elementary school (95 | 24.4%).
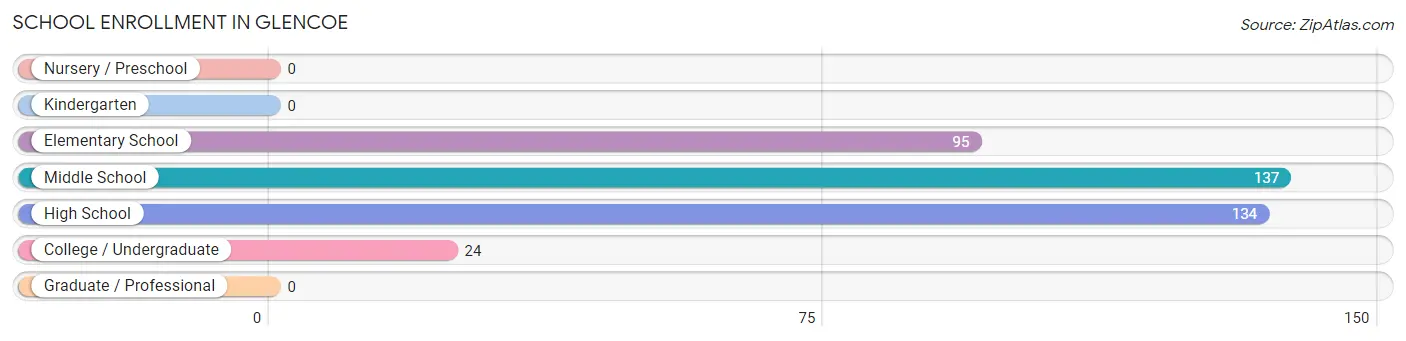
| School Level | # Students | % Students |
| Nursery / Preschool | 0 | 0.0% |
| Kindergarten | 0 | 0.0% |
| Elementary School | 95 | 24.4% |
| Middle School | 137 | 35.1% |
| High School | 134 | 34.4% |
| College / Undergraduate | 24 | 6.1% |
| Graduate / Professional | 0 | 0.0% |
| Total | 390 | 100.0% |
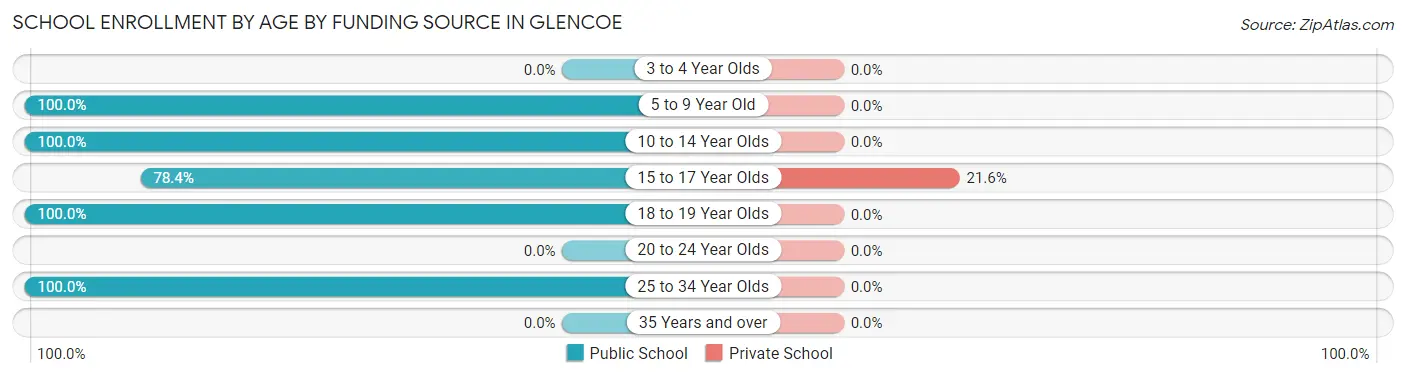
School Enrollment by Age by Funding Source in Glencoe
Out of a total of 390 students who are enrolled in schools in Glencoe, 19 (4.9%) attend a private institution, while the remaining 371 (95.1%) are enrolled in public schools. The age group of 15 to 17 year olds has the highest likelihood of being enrolled in private schools, with 19 (21.6% in the age bracket) enrolled. Conversely, the age group of 5 to 9 year old has the lowest likelihood of being enrolled in a private school, with 66 (100.0% in the age bracket) attending a public institution.
| Age Bracket | Public School | Private School |
| 3 to 4 Year Olds | 0 (0.0%) | 0 (0.0%) |
| 5 to 9 Year Old | 66 (100.0%) | 0 (0.0%) |
| 10 to 14 Year Olds | 212 (100.0%) | 0 (0.0%) |
| 15 to 17 Year Olds | 69 (78.4%) | 19 (21.6%) |
| 18 to 19 Year Olds | 10 (100.0%) | 0 (0.0%) |
| 20 to 24 Year Olds | 0 (0.0%) | 0 (0.0%) |
| 25 to 34 Year Olds | 14 (100.0%) | 0 (0.0%) |
| 35 Years and over | 0 (0.0%) | 0 (0.0%) |
| Total | 371 (95.1%) | 19 (4.9%) |
Educational Attainment by Field of Study in Glencoe
Business (61 | 26.8%), social sciences (51 | 22.4%), education (35 | 15.3%), science & technology (34 | 14.9%), and engineering (17 | 7.5%) are the most common fields of study among 228 individuals in Glencoe who have obtained a bachelor's degree or higher.
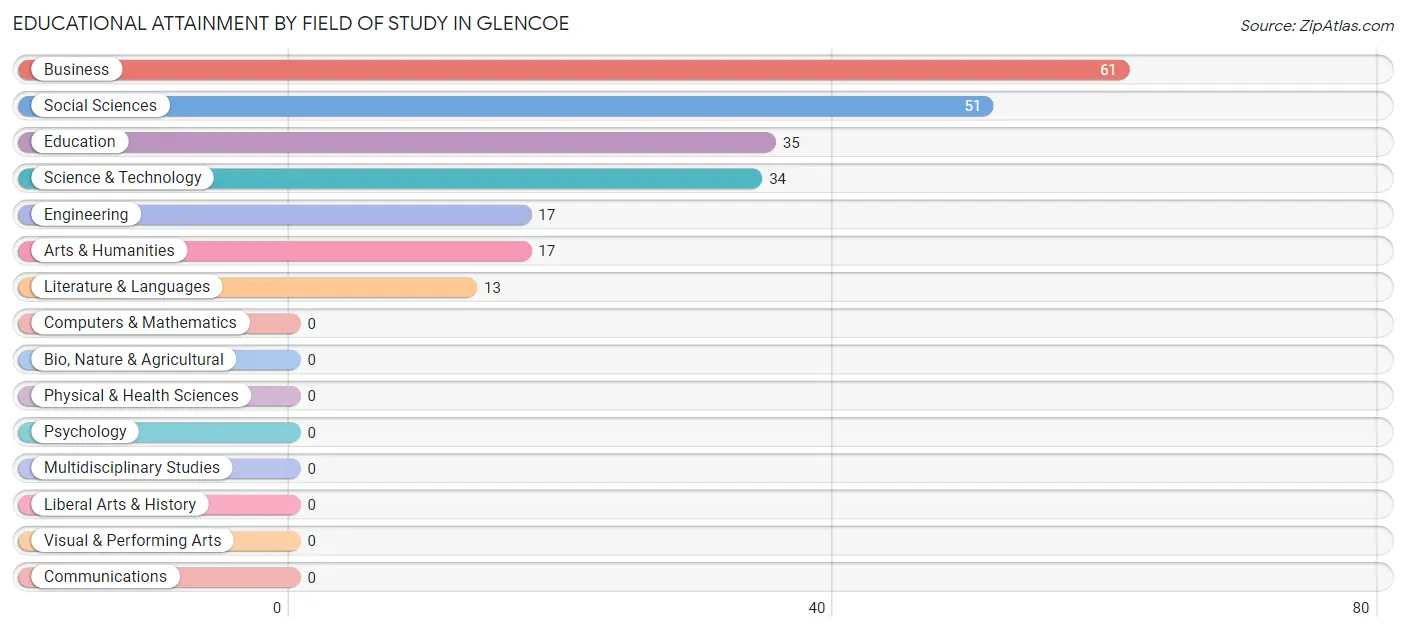
| Field of Study | # Graduates | % Graduates |
| Computers & Mathematics | 0 | 0.0% |
| Bio, Nature & Agricultural | 0 | 0.0% |
| Physical & Health Sciences | 0 | 0.0% |
| Psychology | 0 | 0.0% |
| Social Sciences | 51 | 22.4% |
| Engineering | 17 | 7.5% |
| Multidisciplinary Studies | 0 | 0.0% |
| Science & Technology | 34 | 14.9% |
| Business | 61 | 26.8% |
| Education | 35 | 15.3% |
| Literature & Languages | 13 | 5.7% |
| Liberal Arts & History | 0 | 0.0% |
| Visual & Performing Arts | 0 | 0.0% |
| Communications | 0 | 0.0% |
| Arts & Humanities | 17 | 7.5% |
| Total | 228 | 100.0% |
Transportation & Commute in Glencoe
Vehicle Availability by Sex in Glencoe
The most prevalent vehicle ownership categories in Glencoe are males with 2 vehicles (157, accounting for 32.2%) and females with 2 vehicles (78, making up 48.2%).
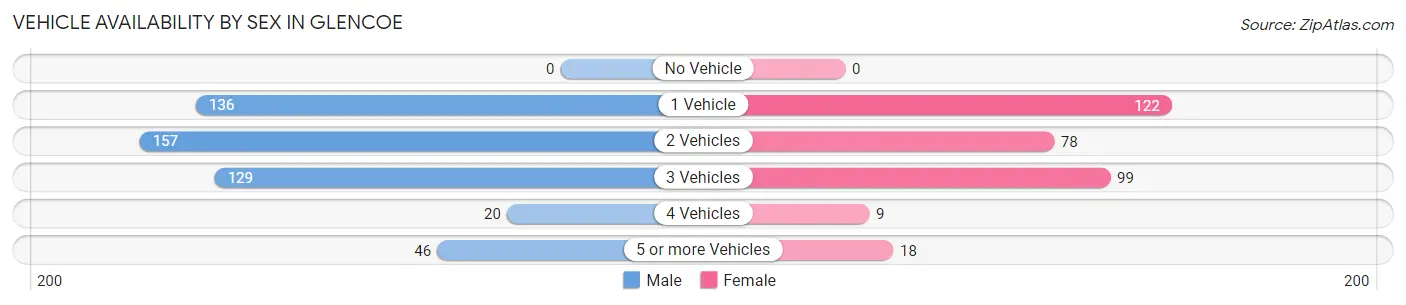
| Vehicles Available | Male | Female |
| No Vehicle | 0 (0.0%) | 0 (0.0%) |
| 1 Vehicle | 136 (27.9%) | 122 (37.4%) |
| 2 Vehicles | 157 (32.2%) | 78 (23.9%) |
| 3 Vehicles | 129 (26.4%) | 99 (30.4%) |
| 4 Vehicles | 20 (4.1%) | 9 (2.8%) |
| 5 or more Vehicles | 46 (9.4%) | 18 (5.5%) |
| Total | 488 (100.0%) | 326 (100.0%) |
Commute Time in Glencoe
The most frequently occuring commute durations in Glencoe are 30 to 34 minutes (173 commuters, 22.4%), 15 to 19 minutes (138 commuters, 17.8%), and 5 to 9 minutes (79 commuters, 10.2%).
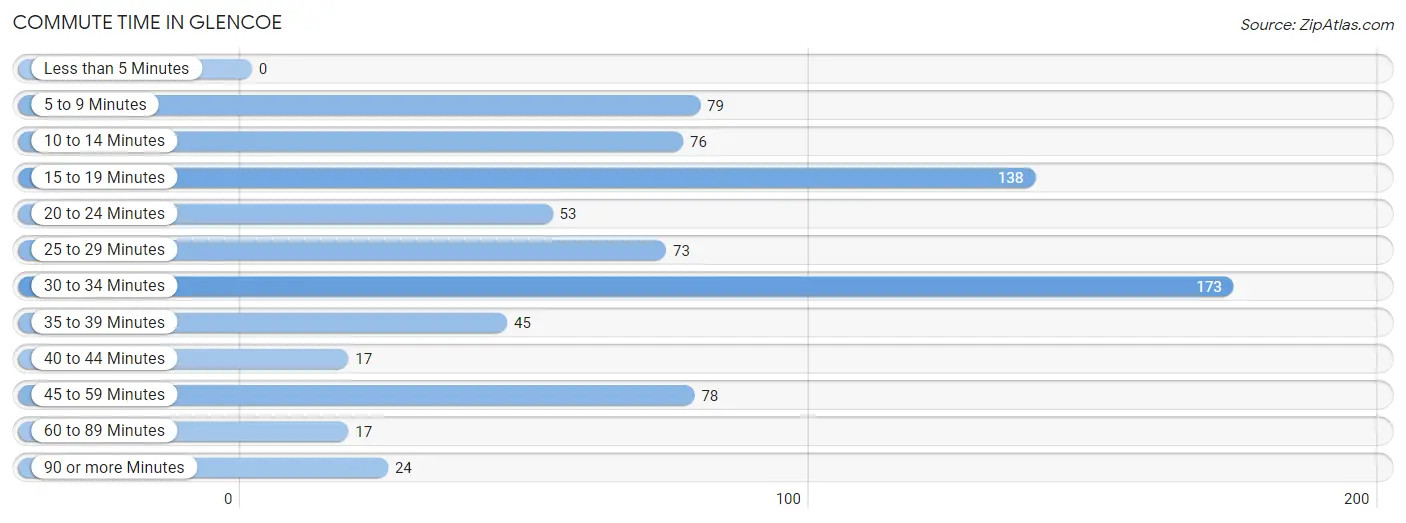
| Commute Time | # Commuters | % Commuters |
| Less than 5 Minutes | 0 | 0.0% |
| 5 to 9 Minutes | 79 | 10.2% |
| 10 to 14 Minutes | 76 | 9.8% |
| 15 to 19 Minutes | 138 | 17.8% |
| 20 to 24 Minutes | 53 | 6.9% |
| 25 to 29 Minutes | 73 | 9.4% |
| 30 to 34 Minutes | 173 | 22.4% |
| 35 to 39 Minutes | 45 | 5.8% |
| 40 to 44 Minutes | 17 | 2.2% |
| 45 to 59 Minutes | 78 | 10.1% |
| 60 to 89 Minutes | 17 | 2.2% |
| 90 or more Minutes | 24 | 3.1% |
Commute Time by Sex in Glencoe
The most common commute times in Glencoe are 15 to 19 minutes (99 commuters, 21.0%) for males and 30 to 34 minutes (94 commuters, 31.2%) for females.
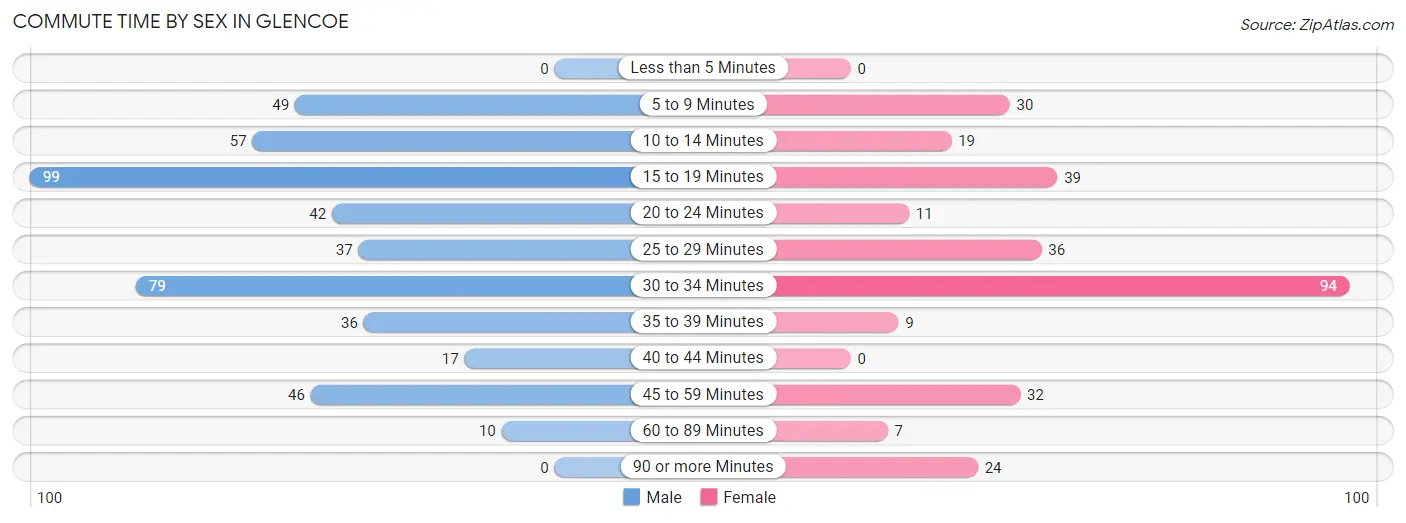
| Commute Time | Male | Female |
| Less than 5 Minutes | 0 (0.0%) | 0 (0.0%) |
| 5 to 9 Minutes | 49 (10.4%) | 30 (10.0%) |
| 10 to 14 Minutes | 57 (12.1%) | 19 (6.3%) |
| 15 to 19 Minutes | 99 (21.0%) | 39 (13.0%) |
| 20 to 24 Minutes | 42 (8.9%) | 11 (3.6%) |
| 25 to 29 Minutes | 37 (7.8%) | 36 (12.0%) |
| 30 to 34 Minutes | 79 (16.7%) | 94 (31.2%) |
| 35 to 39 Minutes | 36 (7.6%) | 9 (3.0%) |
| 40 to 44 Minutes | 17 (3.6%) | 0 (0.0%) |
| 45 to 59 Minutes | 46 (9.8%) | 32 (10.6%) |
| 60 to 89 Minutes | 10 (2.1%) | 7 (2.3%) |
| 90 or more Minutes | 0 (0.0%) | 24 (8.0%) |
Time of Departure to Work by Sex in Glencoe
The most frequent times of departure to work in Glencoe are 7:30 AM to 7:59 AM (121, 25.6%) for males and 8:00 AM to 8:29 AM (69, 22.9%) for females.
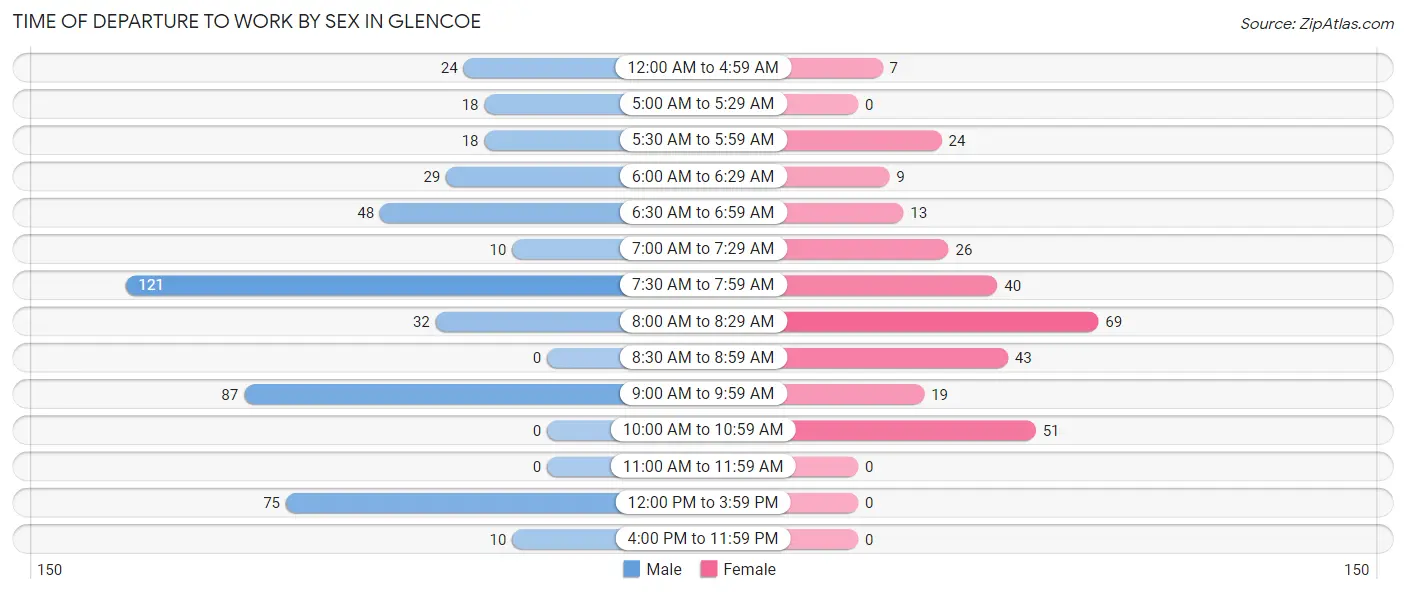
| Time of Departure | Male | Female |
| 12:00 AM to 4:59 AM | 24 (5.1%) | 7 (2.3%) |
| 5:00 AM to 5:29 AM | 18 (3.8%) | 0 (0.0%) |
| 5:30 AM to 5:59 AM | 18 (3.8%) | 24 (8.0%) |
| 6:00 AM to 6:29 AM | 29 (6.1%) | 9 (3.0%) |
| 6:30 AM to 6:59 AM | 48 (10.2%) | 13 (4.3%) |
| 7:00 AM to 7:29 AM | 10 (2.1%) | 26 (8.6%) |
| 7:30 AM to 7:59 AM | 121 (25.6%) | 40 (13.3%) |
| 8:00 AM to 8:29 AM | 32 (6.8%) | 69 (22.9%) |
| 8:30 AM to 8:59 AM | 0 (0.0%) | 43 (14.3%) |
| 9:00 AM to 9:59 AM | 87 (18.4%) | 19 (6.3%) |
| 10:00 AM to 10:59 AM | 0 (0.0%) | 51 (16.9%) |
| 11:00 AM to 11:59 AM | 0 (0.0%) | 0 (0.0%) |
| 12:00 PM to 3:59 PM | 75 (15.9%) | 0 (0.0%) |
| 4:00 PM to 11:59 PM | 10 (2.1%) | 0 (0.0%) |
| Total | 472 (100.0%) | 301 (100.0%) |
Housing Occupancy in Glencoe
Occupancy by Ownership in Glencoe
Of the total 595 dwellings in Glencoe, owner-occupied units account for 575 (96.6%), while renter-occupied units make up 20 (3.4%).
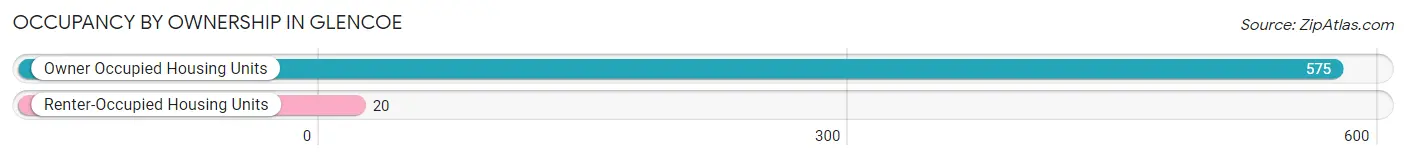
| Occupancy | # Housing Units | % Housing Units |
| Owner Occupied Housing Units | 575 | 96.6% |
| Renter-Occupied Housing Units | 20 | 3.4% |
| Total Occupied Housing Units | 595 | 100.0% |
Occupancy by Household Size in Glencoe

| Household Size | # Housing Units | % Housing Units |
| 1-Person Household | 172 | 28.9% |
| 2-Person Household | 221 | 37.1% |
| 3-Person Household | 78 | 13.1% |
| 4+ Person Household | 124 | 20.8% |
| Total Housing Units | 595 | 100.0% |
Occupancy by Ownership by Household Size in Glencoe
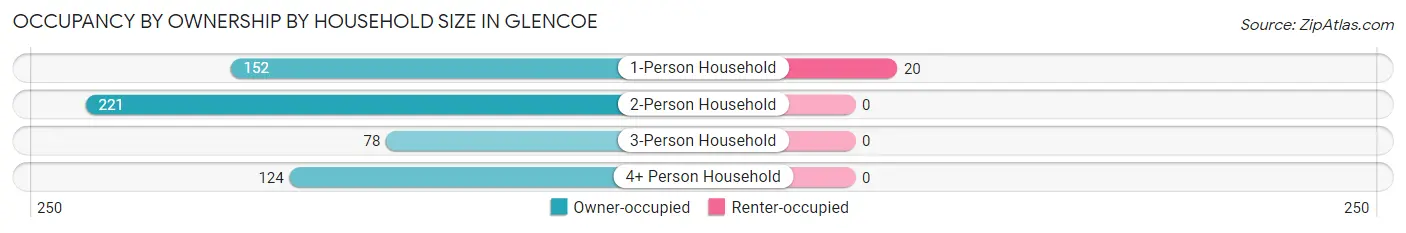
| Household Size | Owner-occupied | Renter-occupied |
| 1-Person Household | 152 (88.4%) | 20 (11.6%) |
| 2-Person Household | 221 (100.0%) | 0 (0.0%) |
| 3-Person Household | 78 (100.0%) | 0 (0.0%) |
| 4+ Person Household | 124 (100.0%) | 0 (0.0%) |
| Total Housing Units | 575 (96.6%) | 20 (3.4%) |
Occupancy by Educational Attainment in Glencoe
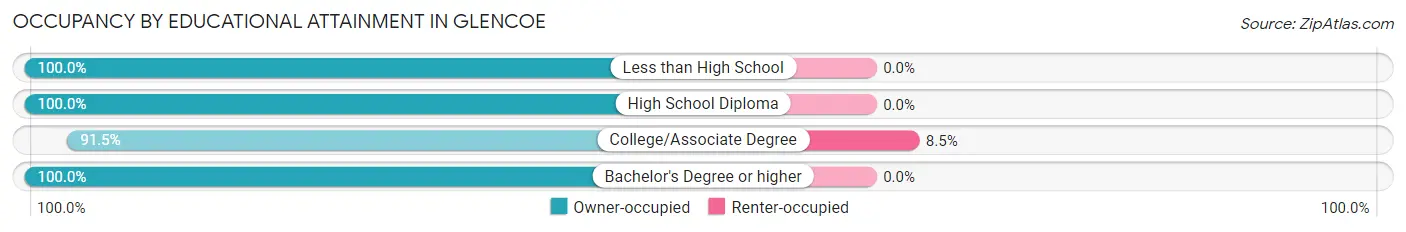
| Household Size | Owner-occupied | Renter-occupied |
| Less than High School | 14 (100.0%) | 0 (0.0%) |
| High School Diploma | 192 (100.0%) | 0 (0.0%) |
| College/Associate Degree | 216 (91.5%) | 20 (8.5%) |
| Bachelor's Degree or higher | 153 (100.0%) | 0 (0.0%) |
Occupancy by Age of Householder in Glencoe
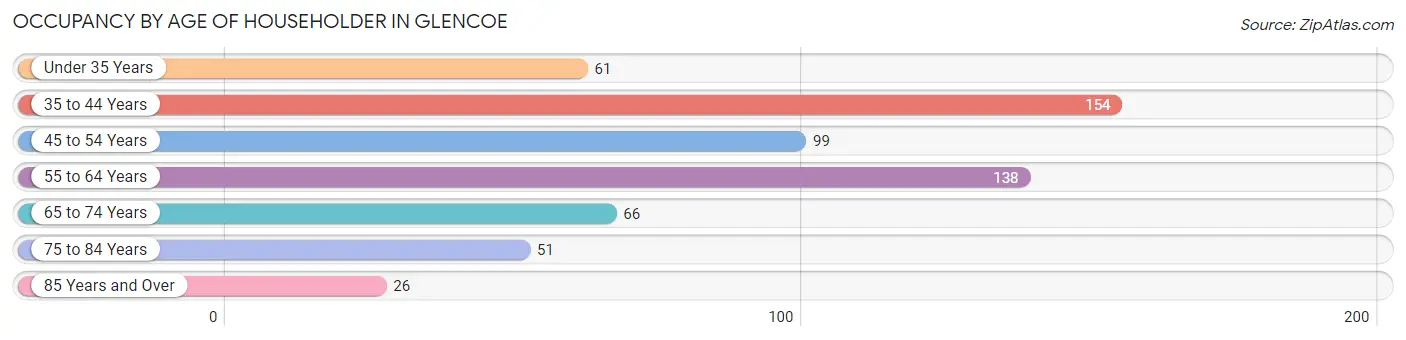
| Age Bracket | # Households | % Households |
| Under 35 Years | 61 | 10.2% |
| 35 to 44 Years | 154 | 25.9% |
| 45 to 54 Years | 99 | 16.6% |
| 55 to 64 Years | 138 | 23.2% |
| 65 to 74 Years | 66 | 11.1% |
| 75 to 84 Years | 51 | 8.6% |
| 85 Years and Over | 26 | 4.4% |
| Total | 595 | 100.0% |
Housing Finances in Glencoe
Median Income by Occupancy in Glencoe
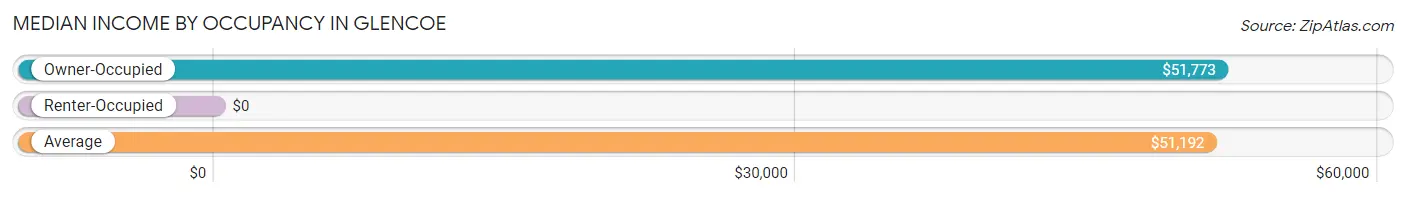
| Occupancy Type | # Households | Median Income |
| Owner-Occupied | 575 (96.6%) | $51,773 |
| Renter-Occupied | 20 (3.4%) | $0 |
| Average | 595 (100.0%) | $51,192 |
Occupancy by Householder Income Bracket in Glencoe
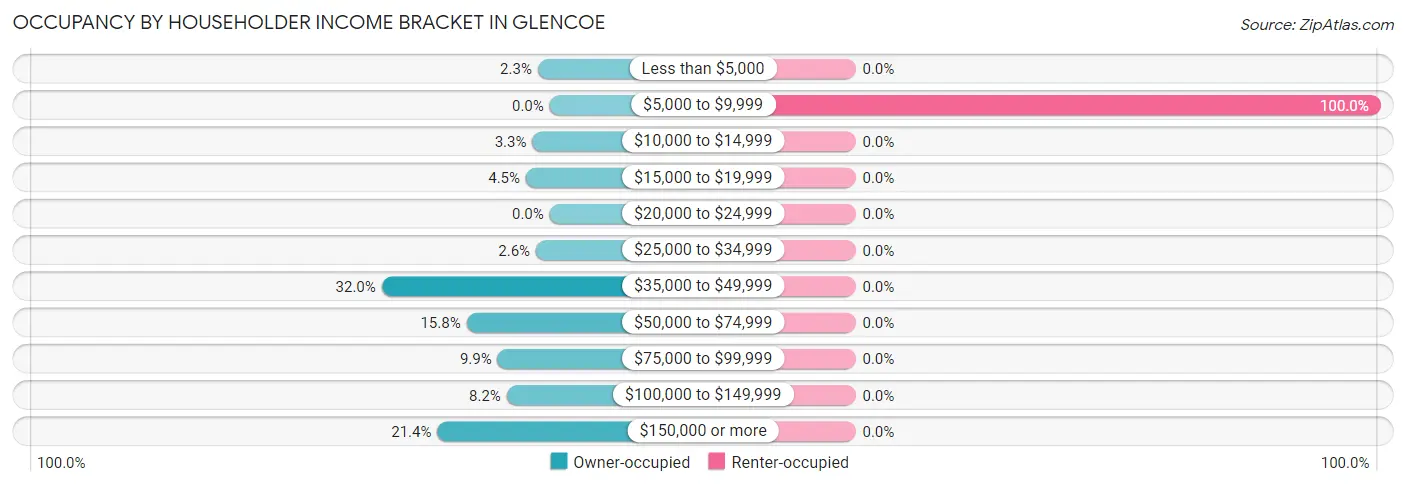
| Income Bracket | Owner-occupied | Renter-occupied |
| Less than $5,000 | 13 (2.3%) | 0 (0.0%) |
| $5,000 to $9,999 | 0 (0.0%) | 20 (100.0%) |
| $10,000 to $14,999 | 19 (3.3%) | 0 (0.0%) |
| $15,000 to $19,999 | 26 (4.5%) | 0 (0.0%) |
| $20,000 to $24,999 | 0 (0.0%) | 0 (0.0%) |
| $25,000 to $34,999 | 15 (2.6%) | 0 (0.0%) |
| $35,000 to $49,999 | 184 (32.0%) | 0 (0.0%) |
| $50,000 to $74,999 | 91 (15.8%) | 0 (0.0%) |
| $75,000 to $99,999 | 57 (9.9%) | 0 (0.0%) |
| $100,000 to $149,999 | 47 (8.2%) | 0 (0.0%) |
| $150,000 or more | 123 (21.4%) | 0 (0.0%) |
| Total | 575 (100.0%) | 20 (100.0%) |
Monthly Housing Cost Tiers in Glencoe
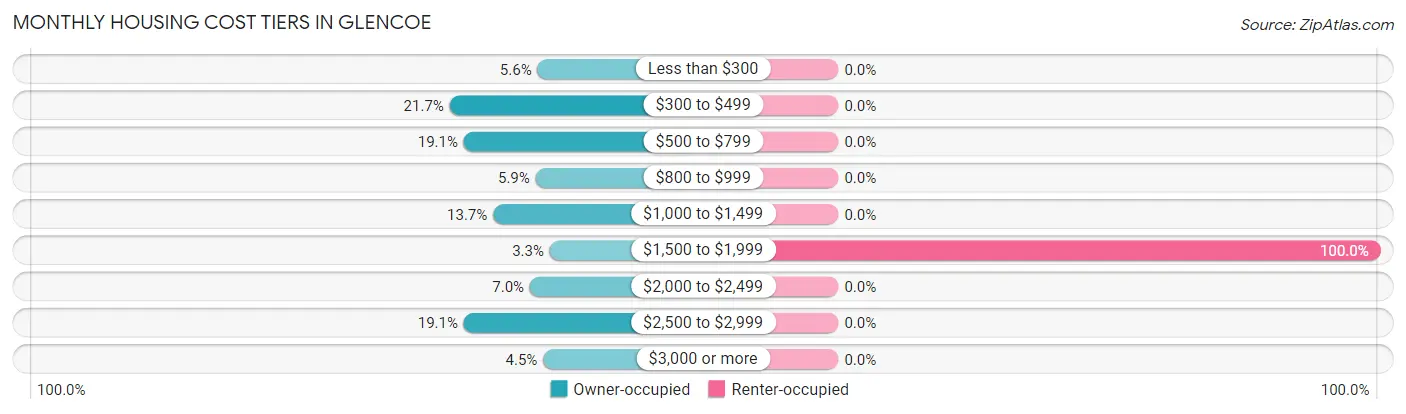
| Monthly Cost | Owner-occupied | Renter-occupied |
| Less than $300 | 32 (5.6%) | 0 (0.0%) |
| $300 to $499 | 125 (21.7%) | 0 (0.0%) |
| $500 to $799 | 110 (19.1%) | 0 (0.0%) |
| $800 to $999 | 34 (5.9%) | 0 (0.0%) |
| $1,000 to $1,499 | 79 (13.7%) | 0 (0.0%) |
| $1,500 to $1,999 | 19 (3.3%) | 20 (100.0%) |
| $2,000 to $2,499 | 40 (7.0%) | 0 (0.0%) |
| $2,500 to $2,999 | 110 (19.1%) | 0 (0.0%) |
| $3,000 or more | 26 (4.5%) | 0 (0.0%) |
| Total | 575 (100.0%) | 20 (100.0%) |
Physical Housing Characteristics in Glencoe
Housing Structures in Glencoe
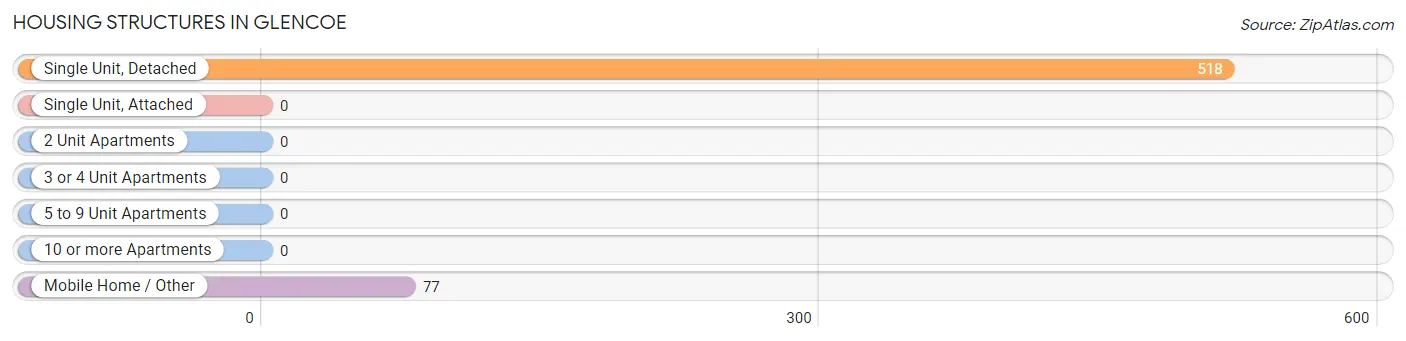
| Structure Type | # Housing Units | % Housing Units |
| Single Unit, Detached | 518 | 87.1% |
| Single Unit, Attached | 0 | 0.0% |
| 2 Unit Apartments | 0 | 0.0% |
| 3 or 4 Unit Apartments | 0 | 0.0% |
| 5 to 9 Unit Apartments | 0 | 0.0% |
| 10 or more Apartments | 0 | 0.0% |
| Mobile Home / Other | 77 | 12.9% |
| Total | 595 | 100.0% |
Housing Structures by Occupancy in Glencoe
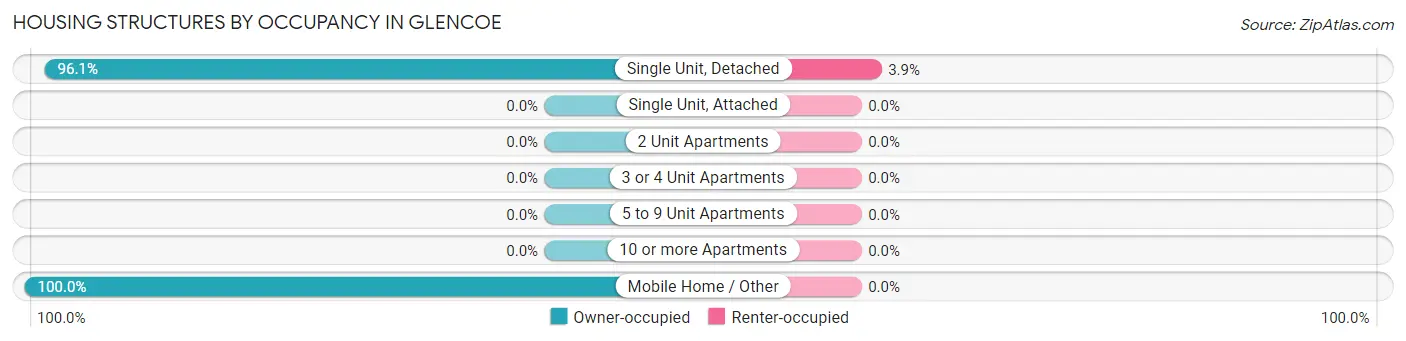
| Structure Type | Owner-occupied | Renter-occupied |
| Single Unit, Detached | 498 (96.1%) | 20 (3.9%) |
| Single Unit, Attached | 0 (0.0%) | 0 (0.0%) |
| 2 Unit Apartments | 0 (0.0%) | 0 (0.0%) |
| 3 or 4 Unit Apartments | 0 (0.0%) | 0 (0.0%) |
| 5 to 9 Unit Apartments | 0 (0.0%) | 0 (0.0%) |
| 10 or more Apartments | 0 (0.0%) | 0 (0.0%) |
| Mobile Home / Other | 77 (100.0%) | 0 (0.0%) |
| Total | 575 (96.6%) | 20 (3.4%) |
Housing Structures by Number of Rooms in Glencoe
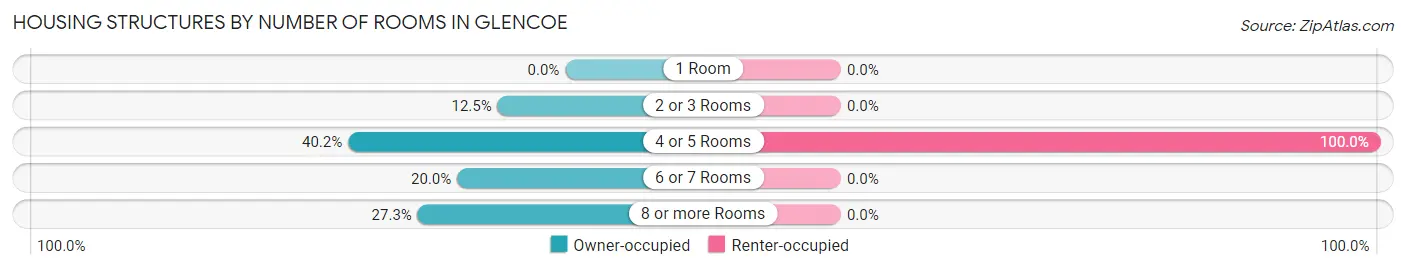
| Number of Rooms | Owner-occupied | Renter-occupied |
| 1 Room | 0 (0.0%) | 0 (0.0%) |
| 2 or 3 Rooms | 72 (12.5%) | 0 (0.0%) |
| 4 or 5 Rooms | 231 (40.2%) | 20 (100.0%) |
| 6 or 7 Rooms | 115 (20.0%) | 0 (0.0%) |
| 8 or more Rooms | 157 (27.3%) | 0 (0.0%) |
| Total | 575 (100.0%) | 20 (100.0%) |
Housing Structure by Heating Type in Glencoe
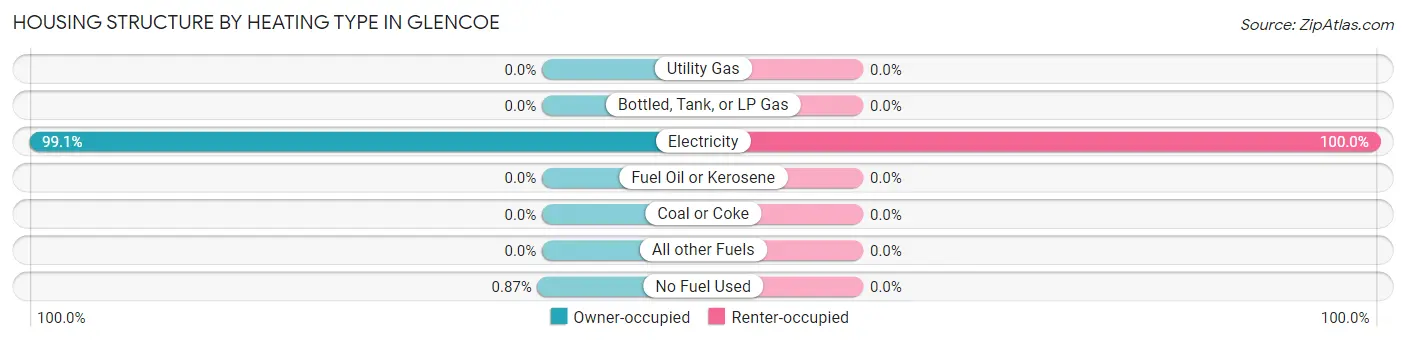
| Heating Type | Owner-occupied | Renter-occupied |
| Utility Gas | 0 (0.0%) | 0 (0.0%) |
| Bottled, Tank, or LP Gas | 0 (0.0%) | 0 (0.0%) |
| Electricity | 570 (99.1%) | 20 (100.0%) |
| Fuel Oil or Kerosene | 0 (0.0%) | 0 (0.0%) |
| Coal or Coke | 0 (0.0%) | 0 (0.0%) |
| All other Fuels | 0 (0.0%) | 0 (0.0%) |
| No Fuel Used | 5 (0.9%) | 0 (0.0%) |
| Total | 575 (100.0%) | 20 (100.0%) |
Household Vehicle Usage in Glencoe
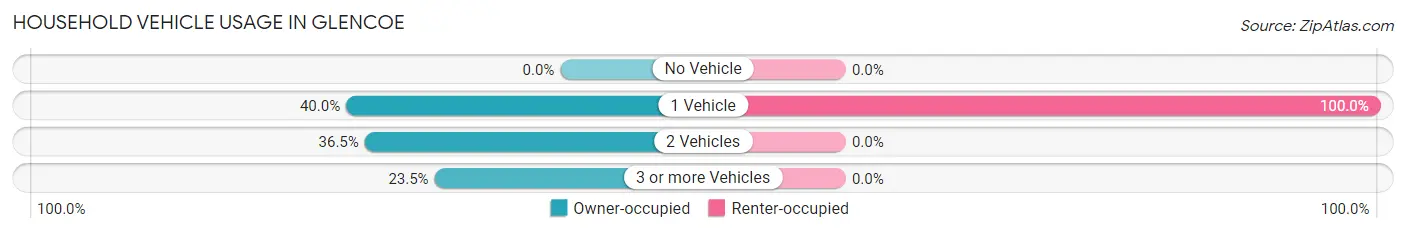
| Vehicles per Household | Owner-occupied | Renter-occupied |
| No Vehicle | 0 (0.0%) | 0 (0.0%) |
| 1 Vehicle | 230 (40.0%) | 20 (100.0%) |
| 2 Vehicles | 210 (36.5%) | 0 (0.0%) |
| 3 or more Vehicles | 135 (23.5%) | 0 (0.0%) |
| Total | 575 (100.0%) | 20 (100.0%) |
Real Estate & Mortgages in Glencoe
Real Estate and Mortgage Overview in Glencoe
| Characteristic | Without Mortgage | With Mortgage |
| Housing Units | 241 | 334 |
| Median Property Value | $187,000 | $408,400 |
| Median Household Income | $40,417 | $123 |
| Monthly Housing Costs | $518 | $26 |
| Real Estate Taxes | $2,519 | $0 |
Property Value by Mortgage Status in Glencoe
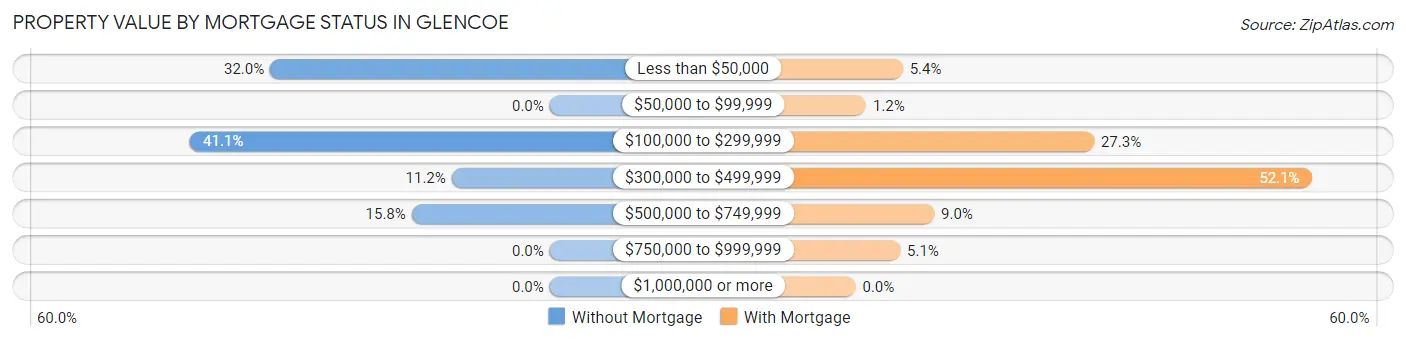
| Property Value | Without Mortgage | With Mortgage |
| Less than $50,000 | 77 (32.0%) | 18 (5.4%) |
| $50,000 to $99,999 | 0 (0.0%) | 4 (1.2%) |
| $100,000 to $299,999 | 99 (41.1%) | 91 (27.3%) |
| $300,000 to $499,999 | 27 (11.2%) | 174 (52.1%) |
| $500,000 to $749,999 | 38 (15.8%) | 30 (9.0%) |
| $750,000 to $999,999 | 0 (0.0%) | 17 (5.1%) |
| $1,000,000 or more | 0 (0.0%) | 0 (0.0%) |
| Total | 241 (100.0%) | 334 (100.0%) |
Household Income by Mortgage Status in Glencoe
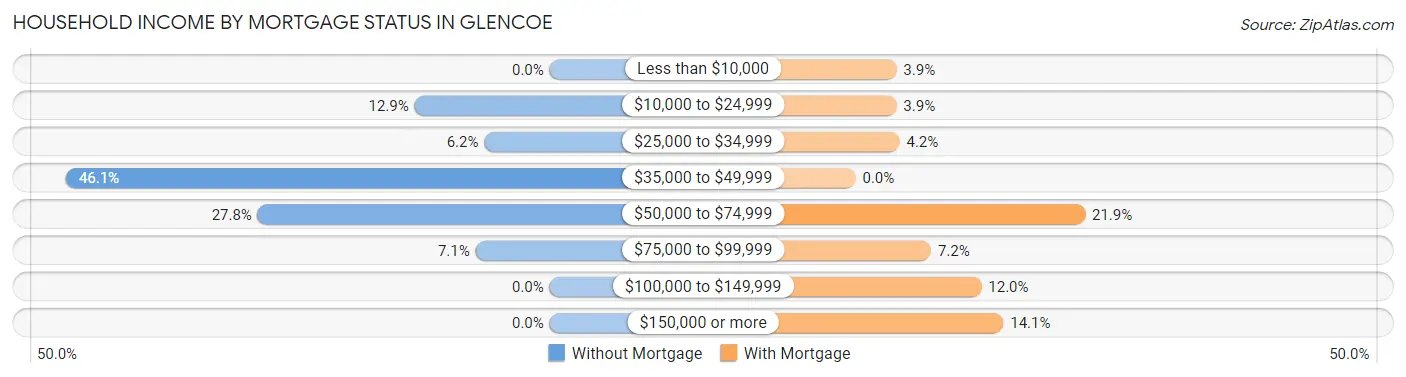
| Household Income | Without Mortgage | With Mortgage |
| Less than $10,000 | 0 (0.0%) | 13 (3.9%) |
| $10,000 to $24,999 | 31 (12.9%) | 13 (3.9%) |
| $25,000 to $34,999 | 15 (6.2%) | 14 (4.2%) |
| $35,000 to $49,999 | 111 (46.1%) | 0 (0.0%) |
| $50,000 to $74,999 | 67 (27.8%) | 73 (21.9%) |
| $75,000 to $99,999 | 17 (7.0%) | 24 (7.2%) |
| $100,000 to $149,999 | 0 (0.0%) | 40 (12.0%) |
| $150,000 or more | 0 (0.0%) | 47 (14.1%) |
| Total | 241 (100.0%) | 334 (100.0%) |
Property Value to Household Income Ratio in Glencoe
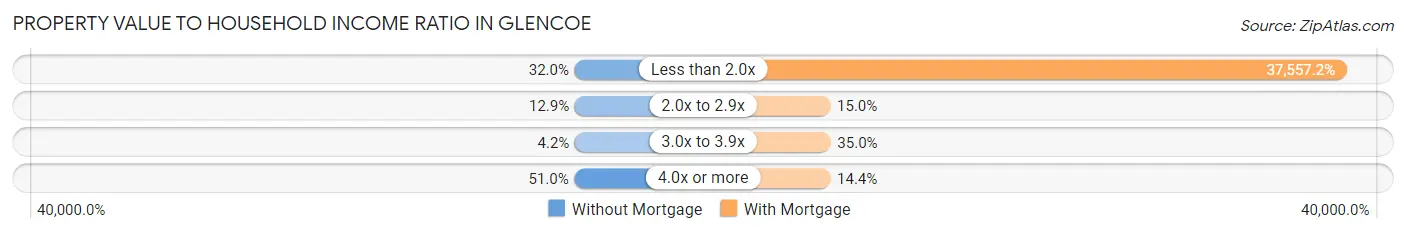
| Value-to-Income Ratio | Without Mortgage | With Mortgage |
| Less than 2.0x | 77 (32.0%) | 125,441 (37,557.2%) |
| 2.0x to 2.9x | 31 (12.9%) | 50 (15.0%) |
| 3.0x to 3.9x | 10 (4.2%) | 117 (35.0%) |
| 4.0x or more | 123 (51.0%) | 48 (14.4%) |
| Total | 241 (100.0%) | 334 (100.0%) |
Real Estate Taxes by Mortgage Status in Glencoe
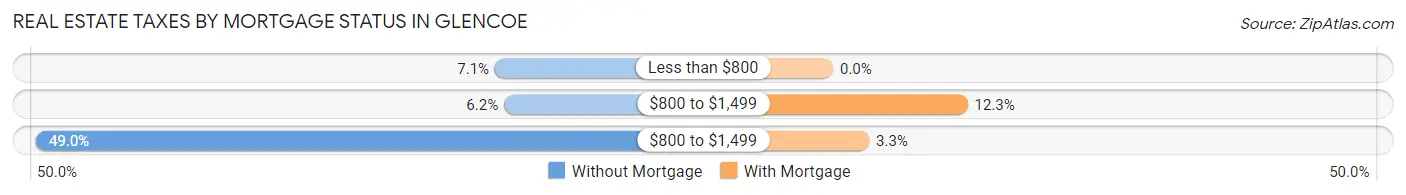
| Property Taxes | Without Mortgage | With Mortgage |
| Less than $800 | 17 (7.0%) | 0 (0.0%) |
| $800 to $1,499 | 15 (6.2%) | 41 (12.3%) |
| $800 to $1,499 | 118 (49.0%) | 11 (3.3%) |
| Total | 241 (100.0%) | 334 (100.0%) |
Health & Disability in Glencoe
Health Insurance Coverage by Age in Glencoe
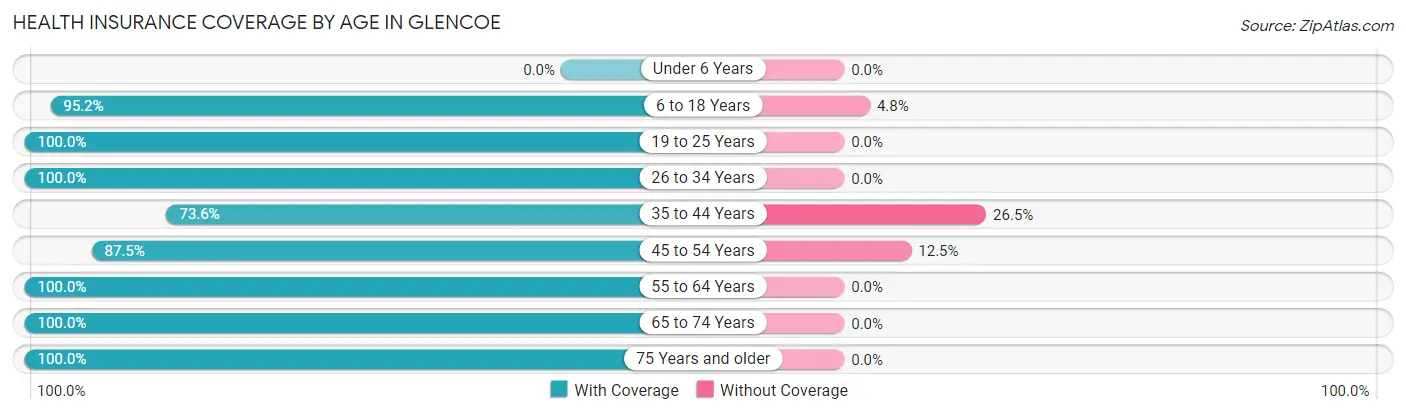
| Age Bracket | With Coverage | Without Coverage |
| Under 6 Years | 0 (0.0%) | 0 (0.0%) |
| 6 to 18 Years | 358 (95.2%) | 18 (4.8%) |
| 19 to 25 Years | 10 (100.0%) | 0 (0.0%) |
| 26 to 34 Years | 114 (100.0%) | 0 (0.0%) |
| 35 to 44 Years | 178 (73.6%) | 64 (26.5%) |
| 45 to 54 Years | 175 (87.5%) | 25 (12.5%) |
| 55 to 64 Years | 231 (100.0%) | 0 (0.0%) |
| 65 to 74 Years | 111 (100.0%) | 0 (0.0%) |
| 75 Years and older | 134 (100.0%) | 0 (0.0%) |
| Total | 1,311 (92.4%) | 107 (7.5%) |
Health Insurance Coverage by Citizenship Status in Glencoe
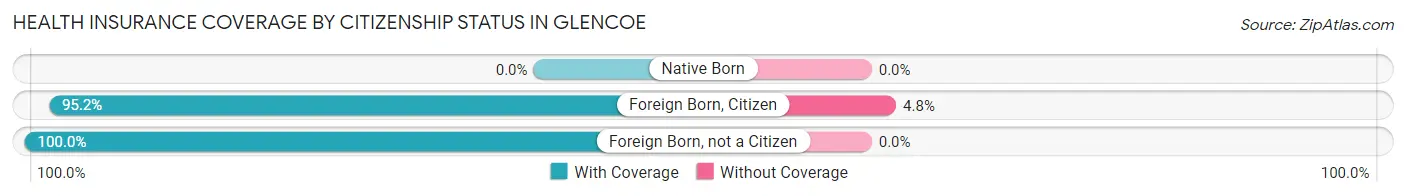
| Citizenship Status | With Coverage | Without Coverage |
| Native Born | 0 (0.0%) | 0 (0.0%) |
| Foreign Born, Citizen | 358 (95.2%) | 18 (4.8%) |
| Foreign Born, not a Citizen | 10 (100.0%) | 0 (0.0%) |
Health Insurance Coverage by Household Income in Glencoe
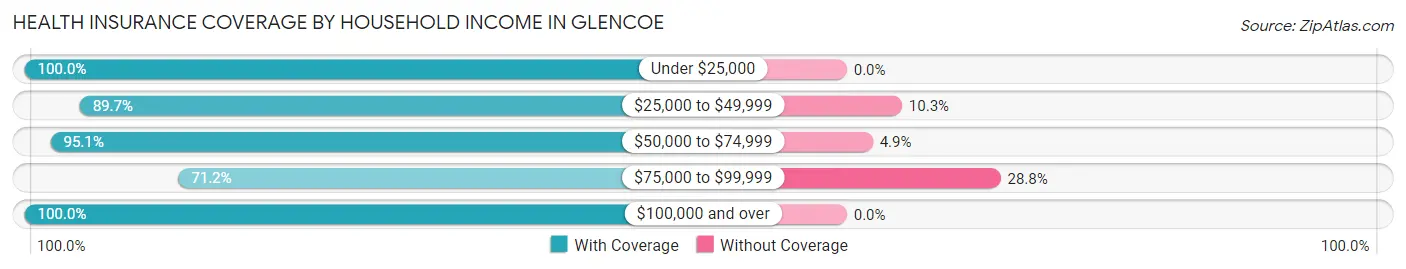
| Household Income | With Coverage | Without Coverage |
| Under $25,000 | 93 (100.0%) | 0 (0.0%) |
| $25,000 to $49,999 | 408 (89.7%) | 47 (10.3%) |
| $50,000 to $74,999 | 176 (95.1%) | 9 (4.9%) |
| $75,000 to $99,999 | 126 (71.2%) | 51 (28.8%) |
| $100,000 and over | 508 (100.0%) | 0 (0.0%) |
Public vs Private Health Insurance Coverage by Age in Glencoe
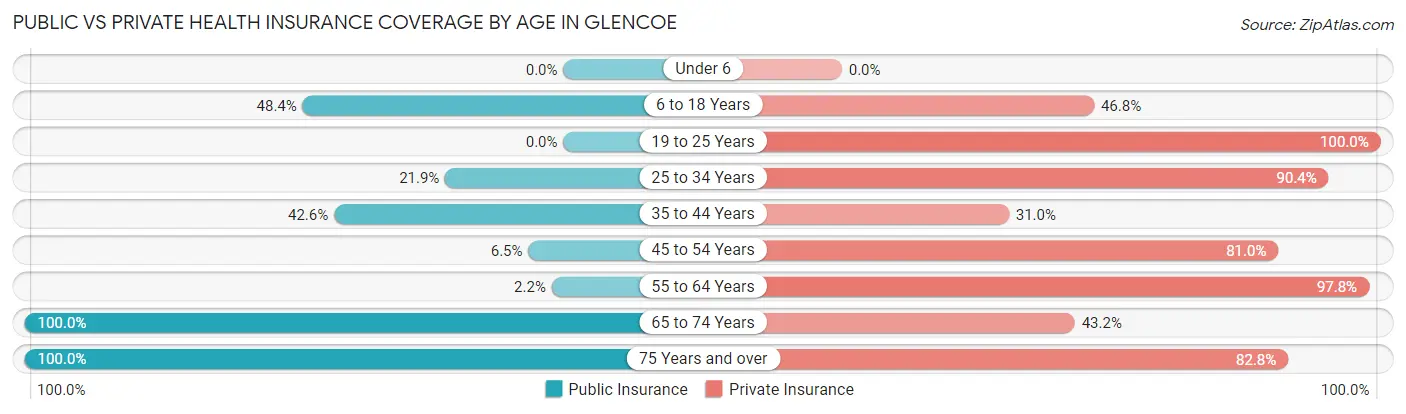
| Age Bracket | Public Insurance | Private Insurance |
| Under 6 | 0 (0.0%) | 0 (0.0%) |
| 6 to 18 Years | 182 (48.4%) | 176 (46.8%) |
| 19 to 25 Years | 0 (0.0%) | 10 (100.0%) |
| 25 to 34 Years | 25 (21.9%) | 103 (90.3%) |
| 35 to 44 Years | 103 (42.6%) | 75 (31.0%) |
| 45 to 54 Years | 13 (6.5%) | 162 (81.0%) |
| 55 to 64 Years | 5 (2.2%) | 226 (97.8%) |
| 65 to 74 Years | 111 (100.0%) | 48 (43.2%) |
| 75 Years and over | 134 (100.0%) | 111 (82.8%) |
| Total | 573 (40.4%) | 911 (64.2%) |
Disability Status by Sex by Age in Glencoe
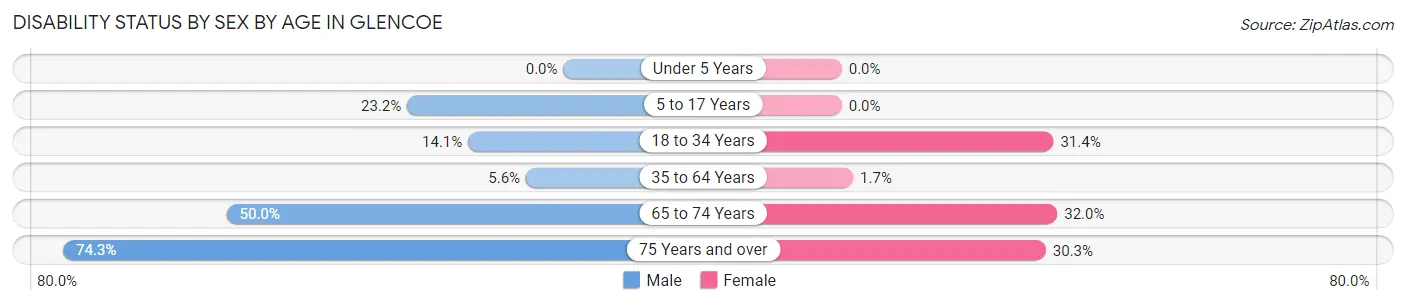
| Age Bracket | Male | Female |
| Under 5 Years | 0 (0.0%) | 0 (0.0%) |
| 5 to 17 Years | 29 (23.2%) | 0 (0.0%) |
| 18 to 34 Years | 14 (14.1%) | 11 (31.4%) |
| 35 to 64 Years | 21 (5.6%) | 5 (1.7%) |
| 65 to 74 Years | 18 (50.0%) | 24 (32.0%) |
| 75 Years and over | 26 (74.3%) | 30 (30.3%) |
Disability Class by Sex by Age in Glencoe
Disability Class: Hearing Difficulty
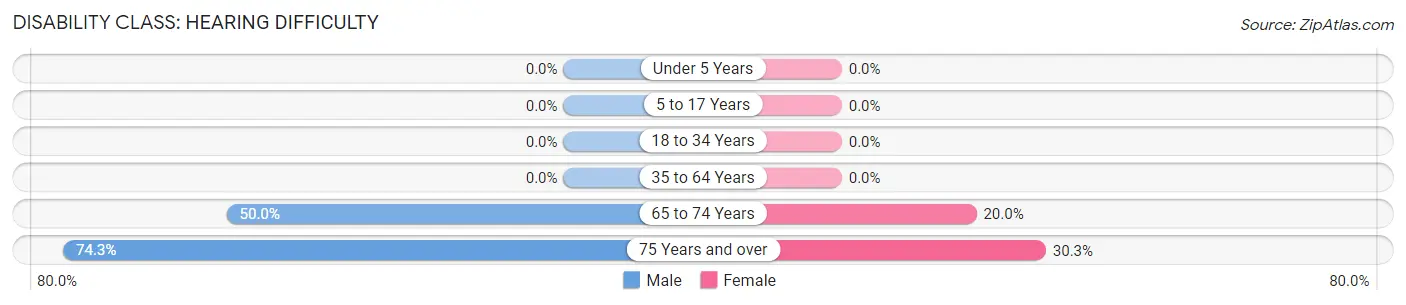
| Age Bracket | Male | Female |
| Under 5 Years | 0 (0.0%) | 0 (0.0%) |
| 5 to 17 Years | 0 (0.0%) | 0 (0.0%) |
| 18 to 34 Years | 0 (0.0%) | 0 (0.0%) |
| 35 to 64 Years | 0 (0.0%) | 0 (0.0%) |
| 65 to 74 Years | 18 (50.0%) | 15 (20.0%) |
| 75 Years and over | 26 (74.3%) | 30 (30.3%) |
Disability Class: Vision Difficulty
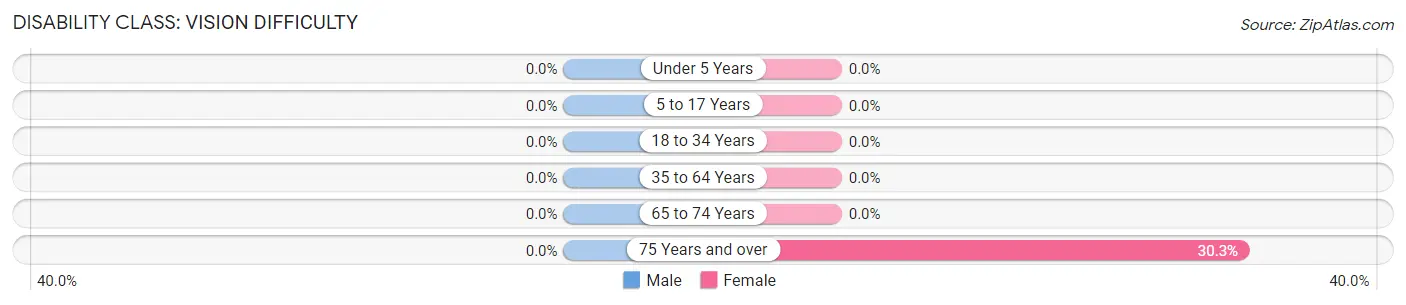
| Age Bracket | Male | Female |
| Under 5 Years | 0 (0.0%) | 0 (0.0%) |
| 5 to 17 Years | 0 (0.0%) | 0 (0.0%) |
| 18 to 34 Years | 0 (0.0%) | 0 (0.0%) |
| 35 to 64 Years | 0 (0.0%) | 0 (0.0%) |
| 65 to 74 Years | 0 (0.0%) | 0 (0.0%) |
| 75 Years and over | 0 (0.0%) | 30 (30.3%) |
Disability Class: Cognitive Difficulty
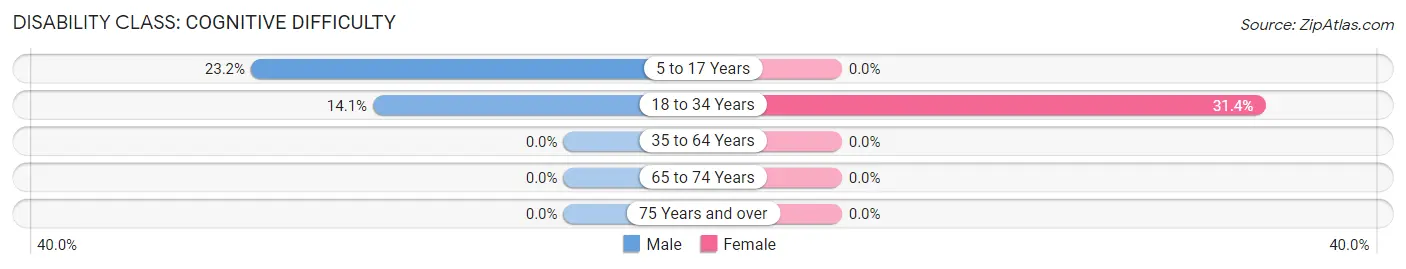
| Age Bracket | Male | Female |
| 5 to 17 Years | 29 (23.2%) | 0 (0.0%) |
| 18 to 34 Years | 14 (14.1%) | 11 (31.4%) |
| 35 to 64 Years | 0 (0.0%) | 0 (0.0%) |
| 65 to 74 Years | 0 (0.0%) | 0 (0.0%) |
| 75 Years and over | 0 (0.0%) | 0 (0.0%) |
Disability Class: Ambulatory Difficulty
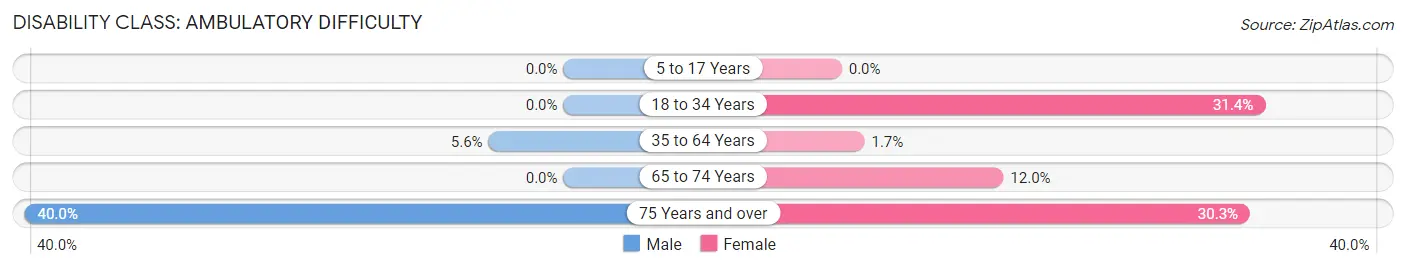
| Age Bracket | Male | Female |
| 5 to 17 Years | 0 (0.0%) | 0 (0.0%) |
| 18 to 34 Years | 0 (0.0%) | 11 (31.4%) |
| 35 to 64 Years | 21 (5.6%) | 5 (1.7%) |
| 65 to 74 Years | 0 (0.0%) | 9 (12.0%) |
| 75 Years and over | 14 (40.0%) | 30 (30.3%) |
Disability Class: Self-Care Difficulty
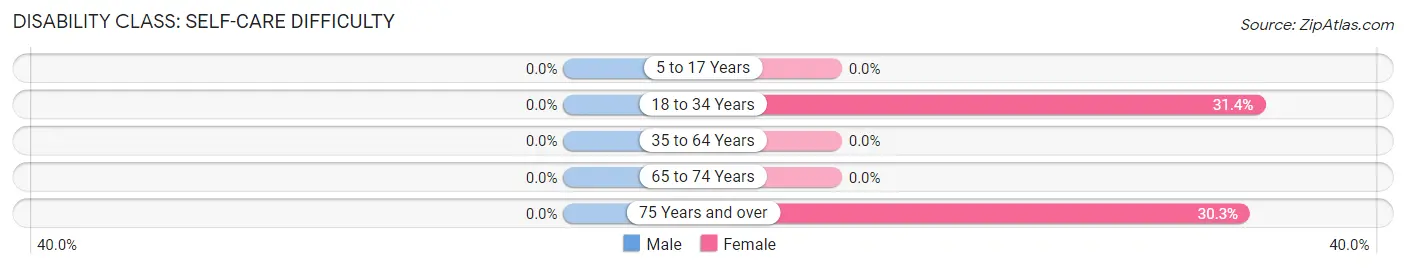
| Age Bracket | Male | Female |
| 5 to 17 Years | 0 (0.0%) | 0 (0.0%) |
| 18 to 34 Years | 0 (0.0%) | 11 (31.4%) |
| 35 to 64 Years | 0 (0.0%) | 0 (0.0%) |
| 65 to 74 Years | 0 (0.0%) | 0 (0.0%) |
| 75 Years and over | 0 (0.0%) | 30 (30.3%) |
Technology Access in Glencoe
Computing Device Access in Glencoe
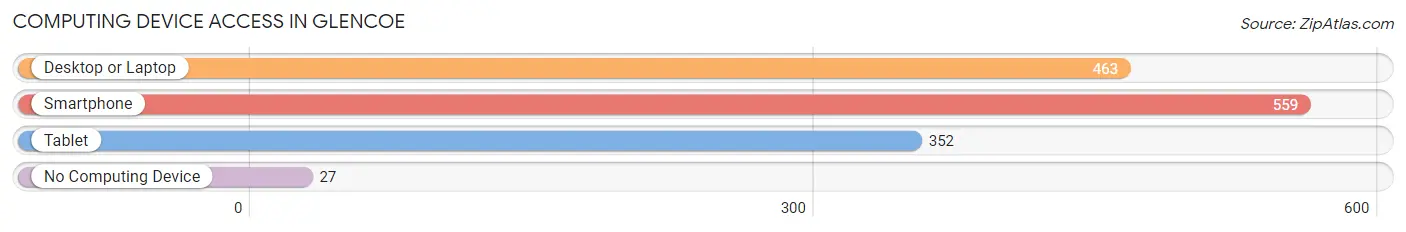
| Device Type | # Households | % Households |
| Desktop or Laptop | 463 | 77.8% |
| Smartphone | 559 | 94.0% |
| Tablet | 352 | 59.2% |
| No Computing Device | 27 | 4.5% |
| Total | 595 | 100.0% |
Internet Access in Glencoe
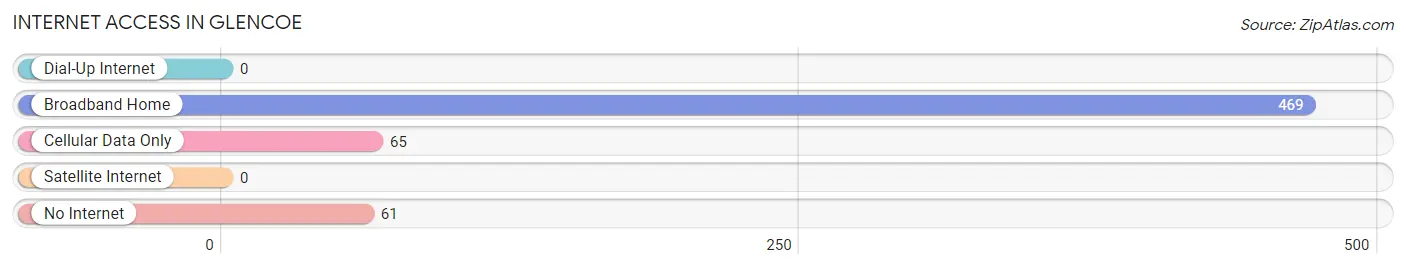
| Internet Type | # Households | % Households |
| Dial-Up Internet | 0 | 0.0% |
| Broadband Home | 469 | 78.8% |
| Cellular Data Only | 65 | 10.9% |
| Satellite Internet | 0 | 0.0% |
| No Internet | 61 | 10.2% |
| Total | 595 | 100.0% |
Glencoe Summary
Glencoe is a small unincorporated community located in the northern part of Okaloosa County, Florida. It is situated on the western shore of Choctawhatchee Bay, approximately 10 miles east of the city of Crestview. The community is bordered by the towns of Niceville and Valparaiso to the south, and the city of Destin to the east.
History
The area that is now Glencoe was originally inhabited by Native American tribes, including the Choctaw and Creek. The first European settlers arrived in the area in the early 1800s, and the community was officially established in 1845. The town was named after the Glencoe Plantation, which was owned by the prominent local family of the same name.
The town grew slowly over the next few decades, and by the early 1900s, it had become a popular destination for tourists and fishermen. The town was also home to a number of businesses, including a general store, a post office, and a sawmill.
In the 1950s, the town began to experience a period of rapid growth, as more and more people moved to the area to take advantage of the area’s natural beauty and recreational opportunities. The town was incorporated in 1959, and by the 1970s, it had become a popular destination for retirees.
Geography
Glencoe is located in the northern part of Okaloosa County, Florida. It is situated on the western shore of Choctawhatchee Bay, approximately 10 miles east of the city of Crestview. The community is bordered by the towns of Niceville and Valparaiso to the south, and the city of Destin to the east.
The town is located in a region of Florida known as the Emerald Coast, which is known for its white sand beaches and crystal clear waters. The area is also home to a number of state parks and wildlife preserves, including the Blackwater River State Forest and the Eglin Air Force Base.
Economy
The economy of Glencoe is largely based on tourism and recreation. The town is home to a number of resorts and hotels, as well as a variety of restaurants and shops. The town is also home to a number of marinas, which provide access to the bay for fishing and other water activities.
The town is also home to a number of businesses, including a general store, a post office, and a sawmill. The town is also home to a number of small manufacturing companies, which produce a variety of products, including furniture and clothing.
Demographics
As of the 2010 census, the population of Glencoe was 1,845. The racial makeup of the town was 94.3% White, 2.2% African American, 0.7% Native American, 0.4% Asian, 0.1% Pacific Islander, and 2.3% from other races. The median household income was $41,250, and the median family income was $50,000.
The town is home to a number of churches, including the First Baptist Church of Glencoe, the Church of Jesus Christ of Latter-day Saints, and the Glencoe United Methodist Church. The town is also home to a number of schools, including the Glencoe Elementary School, the Glencoe Middle School, and the Glencoe High School.
Common Questions
What is Per Capita Income in Glencoe?
Per Capita income in Glencoe is $38,322.
What is the Median Family Income in Glencoe?
Median Family Income in Glencoe is $77,778.
What is the Median Household income in Glencoe?
Median Household Income in Glencoe is $51,192.
What is Inequality or Gini Index in Glencoe?
Inequality or Gini Index in Glencoe is 0.46.
What is the Total Population of Glencoe?
Total Population of Glencoe is 1,418.
What is the Total Male Population of Glencoe?
Total Male Population of Glencoe is 673.
What is the Total Female Population of Glencoe?
Total Female Population of Glencoe is 745.
What is the Ratio of Males per 100 Females in Glencoe?
There are 90.34 Males per 100 Females in Glencoe.
What is the Ratio of Females per 100 Males in Glencoe?
There are 110.70 Females per 100 Males in Glencoe.
What is the Median Population Age in Glencoe?
Median Population Age in Glencoe is 41.8 Years.
What is the Average Family Size in Glencoe
Average Family Size in Glencoe is 3.0 People.
What is the Average Household Size in Glencoe
Average Household Size in Glencoe is 2.4 People.
How Large is the Labor Force in Glencoe?
There are 833 People in the Labor Forcein in Glencoe.
What is the Percentage of People in the Labor Force in Glencoe?
73.1% of People are in the Labor Force in Glencoe.
What is the Unemployment Rate in Glencoe?
Unemployment Rate in Glencoe is 2.3%.