Waverly, FL Map & Demographics
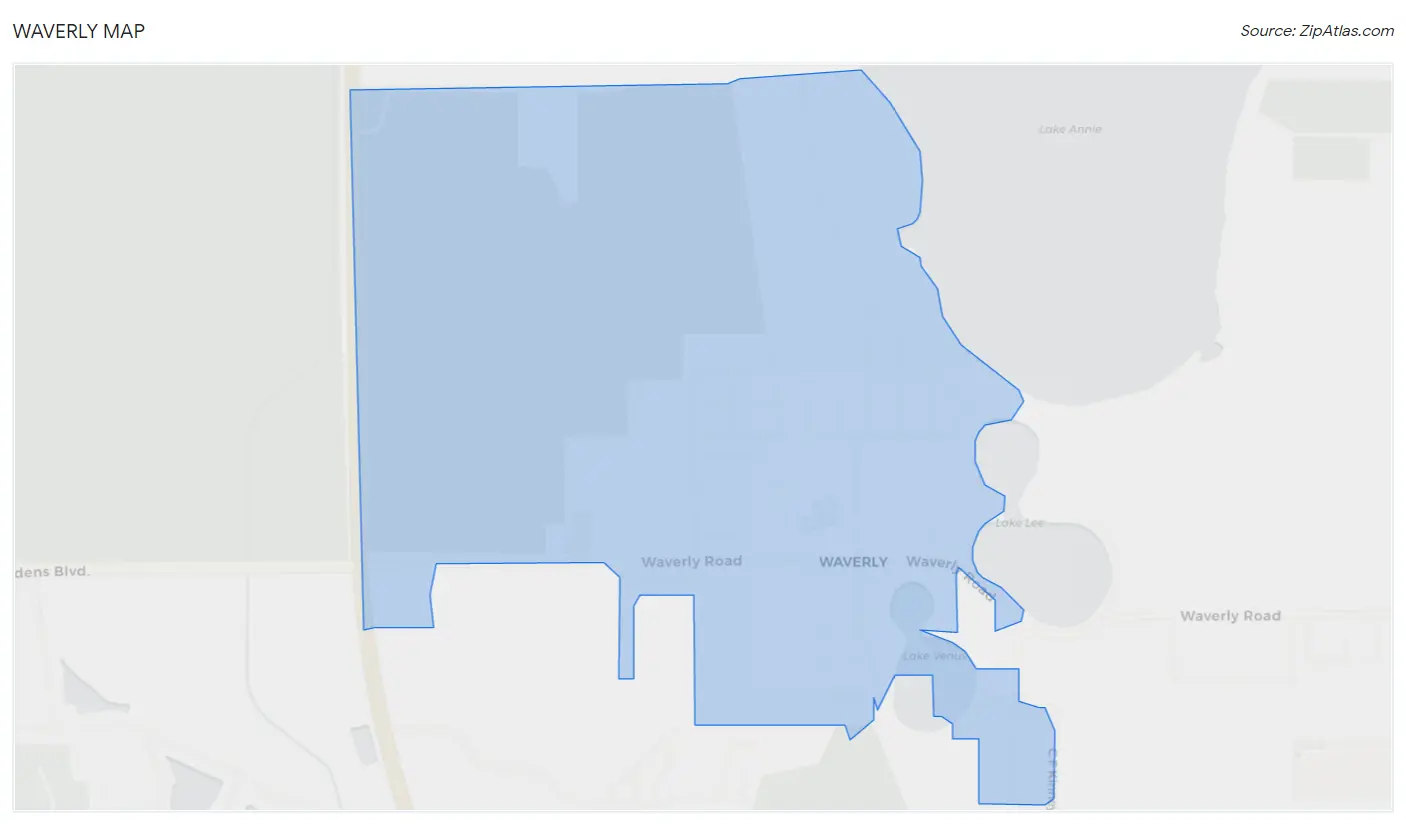
Waverly Map
Waverly Overview
$62,257
PER CAPITA INCOME
0.39
INEQUALITY / GINI INDEX
269
TOTAL POPULATION
61
MALE POPULATION
208
FEMALE POPULATION
29.33
MALES / 100 FEMALES
340.98
FEMALES / 100 MALES
59.5
MEDIAN AGE
1.9
AVG FAMILY SIZE
1.3
AVG HOUSEHOLD SIZE
162
LABOR FORCE [ PEOPLE ]
60.2%
PERCENT IN LABOR FORCE
Waverly Zip Codes
Waverly Area Codes
Income in Waverly
Income Overview in Waverly
| Characteristic | Number | Measure |
| Per Capita Income | 269 | $62,257 |
| Median Family Income | 61 | $0 |
| Mean Family Income | 61 | $0 |
| Median Household Income | 211 | $0 |
| Mean Household Income | 211 | $80,027 |
| Income Deficit | 61 | $0 |
| Wage / Income Gap (%) | 269 | 0.00% |
| Wage / Income Gap ($) | 269 | 100.00¢ per $1 |
| Gini / Inequality Index | 269 | 0.39 |
Earnings by Sex in Waverly
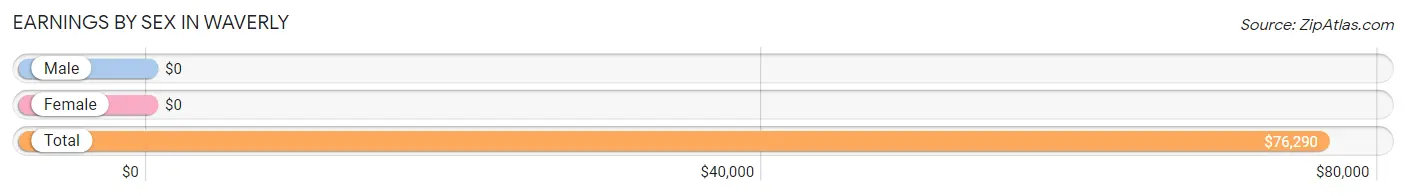
| Sex | Number | Average Earnings |
| Male | 51 (31.5%) | $0 |
| Female | 111 (68.5%) | $0 |
| Total | 162 (100.0%) | $76,290 |
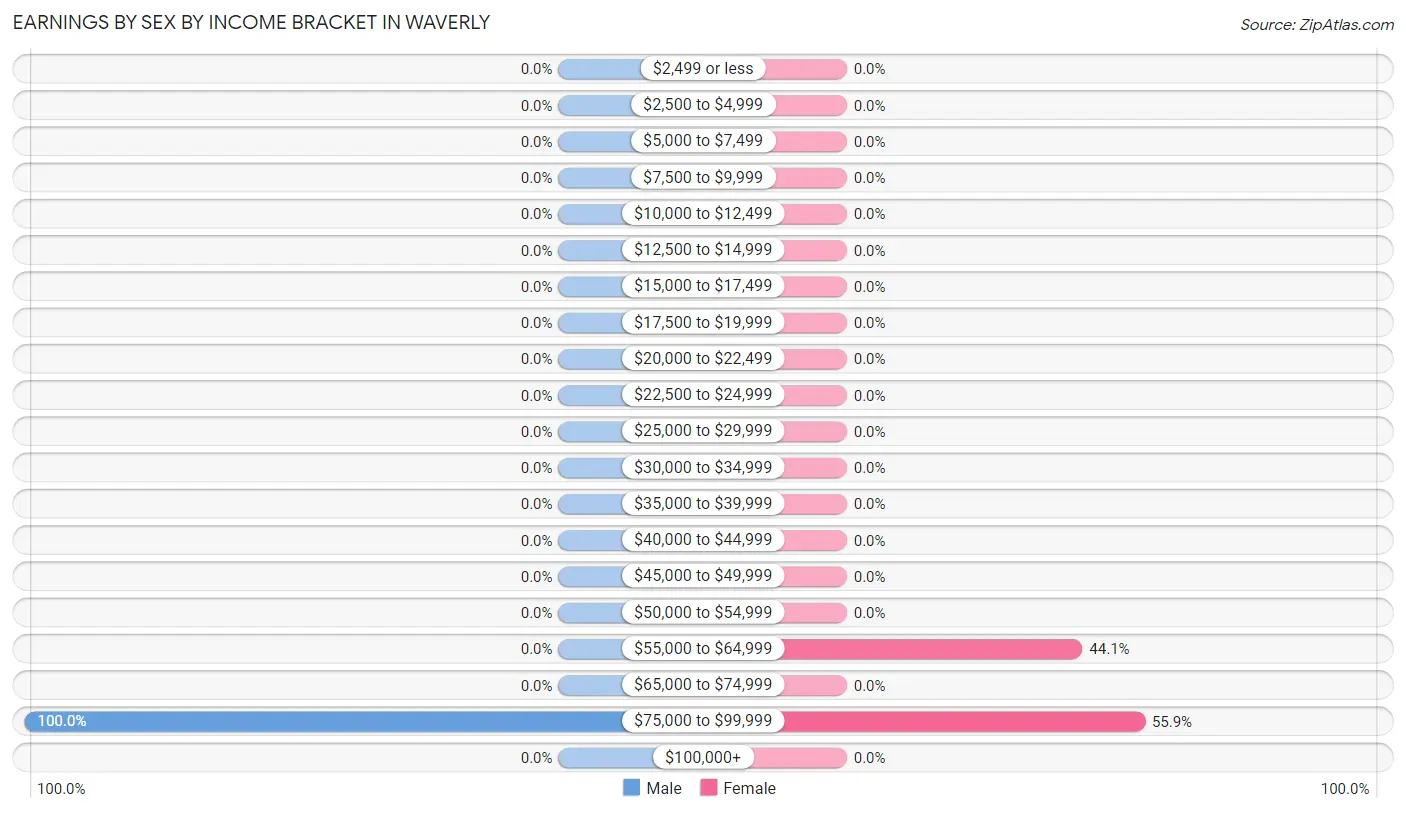
Earnings by Sex by Income Bracket in Waverly
The most common earnings brackets in Waverly are $75,000 to $99,999 for men (51 | 100.0%) and $75,000 to $99,999 for women (62 | 55.9%).
| Income | Male | Female |
| $2,499 or less | 0 (0.0%) | 0 (0.0%) |
| $2,500 to $4,999 | 0 (0.0%) | 0 (0.0%) |
| $5,000 to $7,499 | 0 (0.0%) | 0 (0.0%) |
| $7,500 to $9,999 | 0 (0.0%) | 0 (0.0%) |
| $10,000 to $12,499 | 0 (0.0%) | 0 (0.0%) |
| $12,500 to $14,999 | 0 (0.0%) | 0 (0.0%) |
| $15,000 to $17,499 | 0 (0.0%) | 0 (0.0%) |
| $17,500 to $19,999 | 0 (0.0%) | 0 (0.0%) |
| $20,000 to $22,499 | 0 (0.0%) | 0 (0.0%) |
| $22,500 to $24,999 | 0 (0.0%) | 0 (0.0%) |
| $25,000 to $29,999 | 0 (0.0%) | 0 (0.0%) |
| $30,000 to $34,999 | 0 (0.0%) | 0 (0.0%) |
| $35,000 to $39,999 | 0 (0.0%) | 0 (0.0%) |
| $40,000 to $44,999 | 0 (0.0%) | 0 (0.0%) |
| $45,000 to $49,999 | 0 (0.0%) | 0 (0.0%) |
| $50,000 to $54,999 | 0 (0.0%) | 0 (0.0%) |
| $55,000 to $64,999 | 0 (0.0%) | 49 (44.1%) |
| $65,000 to $74,999 | 0 (0.0%) | 0 (0.0%) |
| $75,000 to $99,999 | 51 (100.0%) | 62 (55.9%) |
| $100,000+ | 0 (0.0%) | 0 (0.0%) |
| Total | 51 (100.0%) | 111 (100.0%) |
Earnings by Sex by Educational Attainment in Waverly
| Educational Attainment | Male Income | Female Income |
| Less than High School | - | - |
| High School Diploma | - | - |
| College or Associate's Degree | - | - |
| Bachelor's Degree | - | - |
| Graduate Degree | - | - |
| Total | - | - |
Family Income in Waverly
Family Income Brackets in Waverly
According to the Waverly family income data, there are 51 families falling into the $150,000 to $199,999 income range, which is the most common income bracket and makes up 83.6% of all families.
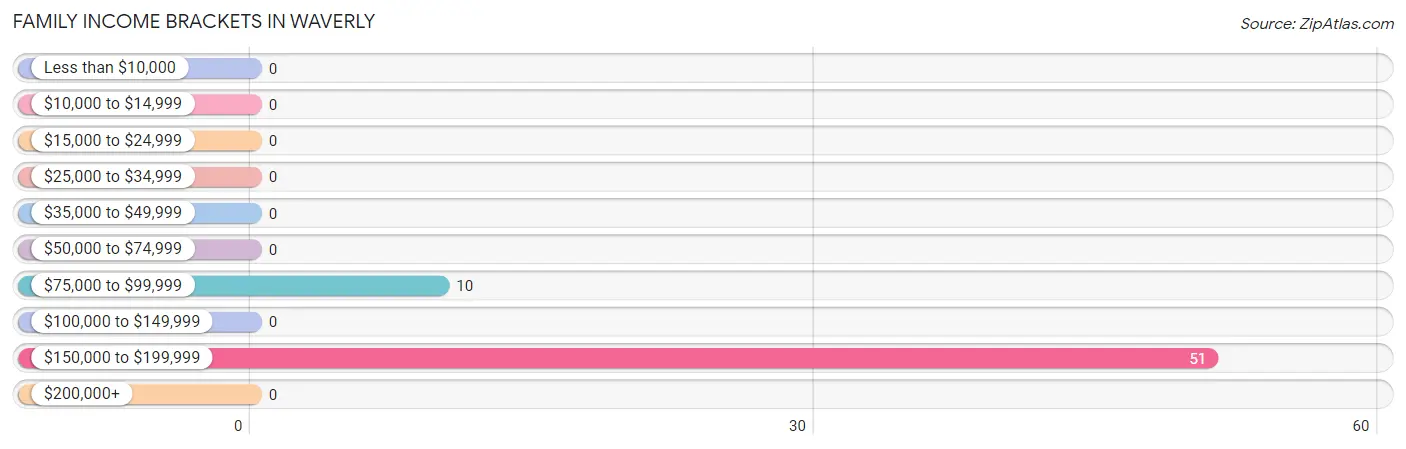
| Income Bracket | # Families | % Families |
| Less than $10,000 | 0 | 0.0% |
| $10,000 to $14,999 | 0 | 0.0% |
| $15,000 to $24,999 | 0 | 0.0% |
| $25,000 to $34,999 | 0 | 0.0% |
| $35,000 to $49,999 | 0 | 0.0% |
| $50,000 to $74,999 | 0 | 0.0% |
| $75,000 to $99,999 | 10 | 16.4% |
| $100,000 to $149,999 | 0 | 0.0% |
| $150,000 to $199,999 | 51 | 83.6% |
| $200,000+ | 0 | 0.0% |
Family Income by Famaliy Size in Waverly
| Income Bracket | # Families | Median Income |
| 2-Person Families | 61 (100.0%) | $0 |
| 3-Person Families | 0 (0.0%) | $0 |
| 4-Person Families | 0 (0.0%) | $0 |
| 5-Person Families | 0 (0.0%) | $0 |
| 6-Person Families | 0 (0.0%) | $0 |
| 7+ Person Families | 0 (0.0%) | $0 |
| Total | 61 (100.0%) | $0 |
Family Income by Number of Earners in Waverly
| Number of Earners | # Families | Median Income |
| No Earners | 10 (16.4%) | $0 |
| 1 Earner | 0 (0.0%) | $0 |
| 2 Earners | 51 (83.6%) | $0 |
| 3+ Earners | 0 (0.0%) | $0 |
| Total | 61 (100.0%) | $0 |
Household Income in Waverly
Household Income Brackets in Waverly
With 72 households falling in the category, the $75,000 to $99,999 income range is the most frequent in Waverly, accounting for 34.1% of all households.
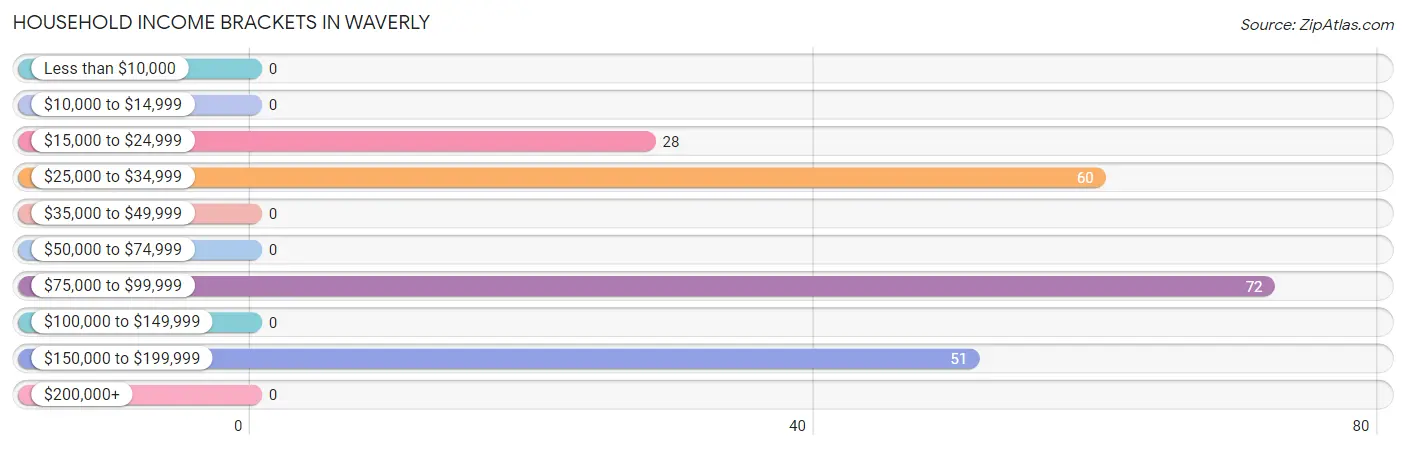
| Income Bracket | # Households | % Households |
| Less than $10,000 | 0 | 0.0% |
| $10,000 to $14,999 | 0 | 0.0% |
| $15,000 to $24,999 | 28 | 13.3% |
| $25,000 to $34,999 | 60 | 28.4% |
| $35,000 to $49,999 | 0 | 0.0% |
| $50,000 to $74,999 | 0 | 0.0% |
| $75,000 to $99,999 | 72 | 34.1% |
| $100,000 to $149,999 | 0 | 0.0% |
| $150,000 to $199,999 | 51 | 24.2% |
| $200,000+ | 0 | 0.0% |
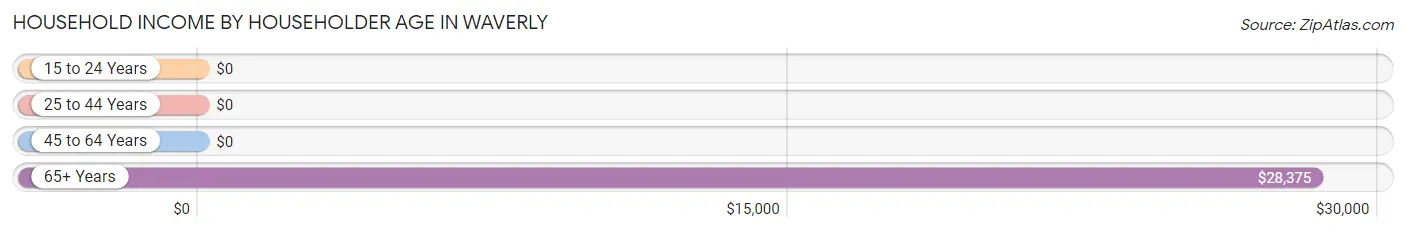
Household Income by Householder Age in Waverly
The median household income in Waverly is $0, with the highest median household income of $28,375 found in the 65+ years age bracket for the primary householder. A total of 98 households (46.5%) fall into this category.
| Income Bracket | # Households | Median Income |
| 15 to 24 Years | 0 (0.0%) | $0 |
| 25 to 44 Years | 62 (29.4%) | $0 |
| 45 to 64 Years | 51 (24.2%) | $0 |
| 65+ Years | 98 (46.5%) | $28,375 |
| Total | 211 (100.0%) | $0 |
Poverty in Waverly
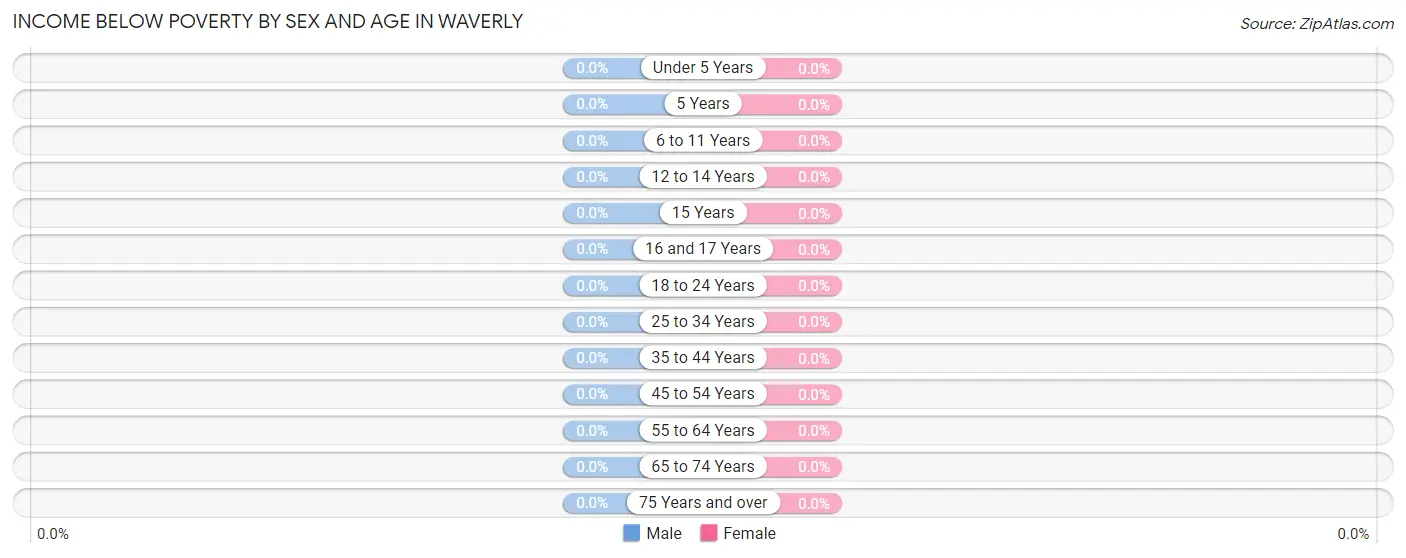
Income Below Poverty by Sex and Age in Waverly
| Age Bracket | Male | Female |
| Under 5 Years | 0 (0.0%) | 0 (0.0%) |
| 5 Years | 0 (0.0%) | 0 (0.0%) |
| 6 to 11 Years | 0 (0.0%) | 0 (0.0%) |
| 12 to 14 Years | 0 (0.0%) | 0 (0.0%) |
| 15 Years | 0 (0.0%) | 0 (0.0%) |
| 16 and 17 Years | 0 (0.0%) | 0 (0.0%) |
| 18 to 24 Years | 0 (0.0%) | 0 (0.0%) |
| 25 to 34 Years | 0 (0.0%) | 0 (0.0%) |
| 35 to 44 Years | 0 (0.0%) | 0 (0.0%) |
| 45 to 54 Years | 0 (0.0%) | 0 (0.0%) |
| 55 to 64 Years | 0 (0.0%) | 0 (0.0%) |
| 65 to 74 Years | 0 (0.0%) | 0 (0.0%) |
| 75 Years and over | 0 (0.0%) | 0 (0.0%) |
| Total | 0 (0.0%) | 0 (0.0%) |
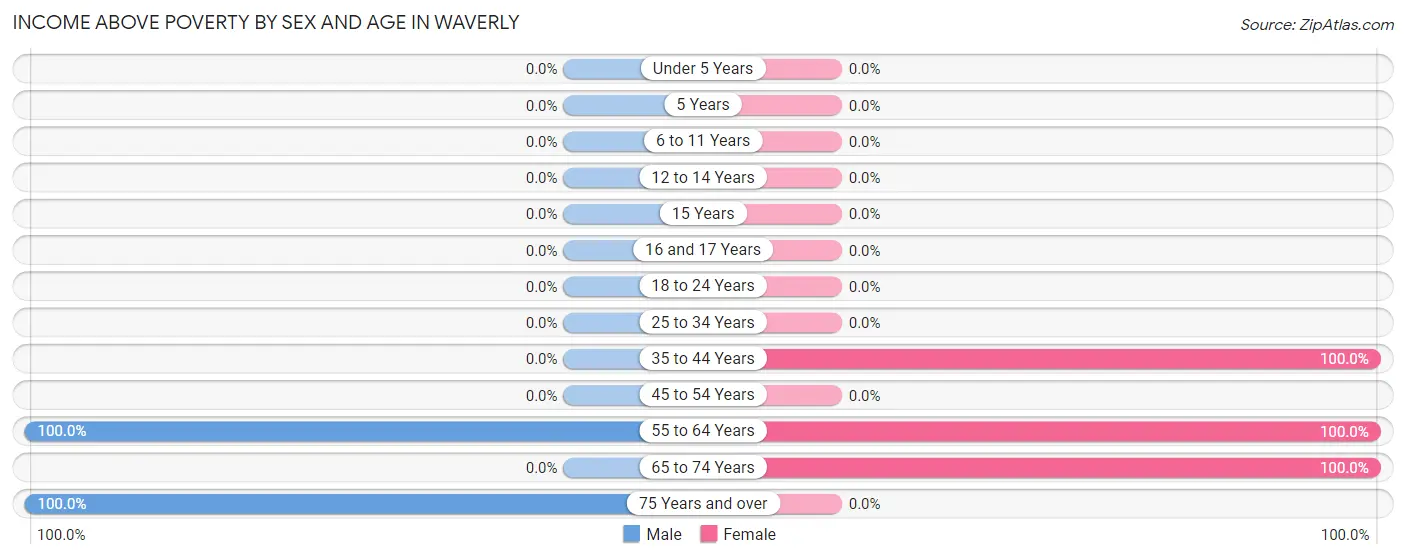
Income Above Poverty by Sex and Age in Waverly
According to the poverty statistics in Waverly, males aged 55 to 64 years and females aged 35 to 44 years are the age groups that are most secure financially, with 100.0% of males and 100.0% of females in these age groups living above the poverty line.
| Age Bracket | Male | Female |
| Under 5 Years | 0 (0.0%) | 0 (0.0%) |
| 5 Years | 0 (0.0%) | 0 (0.0%) |
| 6 to 11 Years | 0 (0.0%) | 0 (0.0%) |
| 12 to 14 Years | 0 (0.0%) | 0 (0.0%) |
| 15 Years | 0 (0.0%) | 0 (0.0%) |
| 16 and 17 Years | 0 (0.0%) | 0 (0.0%) |
| 18 to 24 Years | 0 (0.0%) | 0 (0.0%) |
| 25 to 34 Years | 0 (0.0%) | 0 (0.0%) |
| 35 to 44 Years | 0 (0.0%) | 62 (100.0%) |
| 45 to 54 Years | 0 (0.0%) | 0 (0.0%) |
| 55 to 64 Years | 51 (100.0%) | 49 (100.0%) |
| 65 to 74 Years | 0 (0.0%) | 97 (100.0%) |
| 75 Years and over | 10 (100.0%) | 0 (0.0%) |
| Total | 61 (100.0%) | 208 (100.0%) |
Income Below Poverty Among Married-Couple Families in Waverly
| Children | Above Poverty | Below Poverty |
| No Children | 61 (100.0%) | 0 (0.0%) |
| 1 or 2 Children | 0 (0.0%) | 0 (0.0%) |
| 3 or 4 Children | 0 (0.0%) | 0 (0.0%) |
| 5 or more Children | 0 (0.0%) | 0 (0.0%) |
| Total | 61 (100.0%) | 0 (0.0%) |
Income Below Poverty Among Single-Parent Households in Waverly
| Children | Single Father | Single Mother |
| No Children | 0 (0.0%) | 0 (0.0%) |
| 1 or 2 Children | 0 (0.0%) | 0 (0.0%) |
| 3 or 4 Children | 0 (0.0%) | 0 (0.0%) |
| 5 or more Children | 0 (0.0%) | 0 (0.0%) |
| Total | 0 (0.0%) | 0 (0.0%) |
Income Below Poverty Among Married-Couple vs Single-Parent Households in Waverly
| Children | Married-Couple Families | Single-Parent Households |
| No Children | 0 (0.0%) | 0 (0.0%) |
| 1 or 2 Children | 0 (0.0%) | 0 (0.0%) |
| 3 or 4 Children | 0 (0.0%) | 0 (0.0%) |
| 5 or more Children | 0 (0.0%) | 0 (0.0%) |
| Total | 0 (0.0%) | 0 (0.0%) |
Race in Waverly
The most populous races in Waverly are White / Caucasian (147 | 54.6%), and Black / African American (122 | 45.4%).
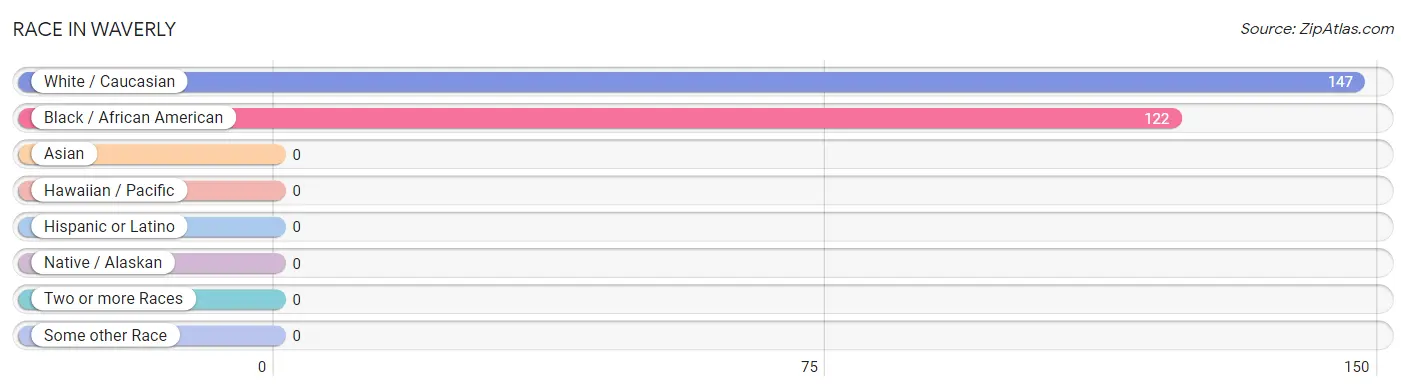
| Race | # Population | % Population |
| Asian | 0 | 0.0% |
| Black / African American | 122 | 45.4% |
| Hawaiian / Pacific | 0 | 0.0% |
| Hispanic or Latino | 0 | 0.0% |
| Native / Alaskan | 0 | 0.0% |
| White / Caucasian | 147 | 54.6% |
| Two or more Races | 0 | 0.0% |
| Some other Race | 0 | 0.0% |
| Total | 269 | 100.0% |
Ancestry in Waverly
The most populous ancestries reported in Waverly are English (128 | 47.6%), and American (19 | 7.1%), together accounting for 54.6% of all Waverly residents.
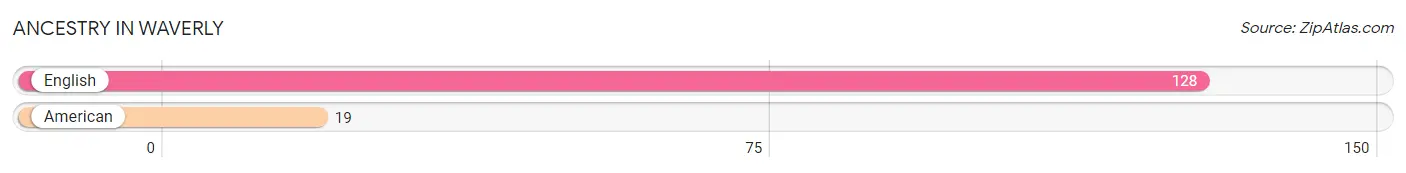
| Ancestry | # Population | % Population |
| American | 19 | 7.1% |
| English | 128 | 47.6% | View All 2 Rows |
Immigrants in Waverly

| Immigration Origin | # Population | % Population | View All 0 Rows |
Sex and Age in Waverly
Sex and Age in Waverly
The most populous age groups in Waverly are 55 to 59 Years (51 | 83.6%) for men and 65 to 69 Years (69 | 33.2%) for women.
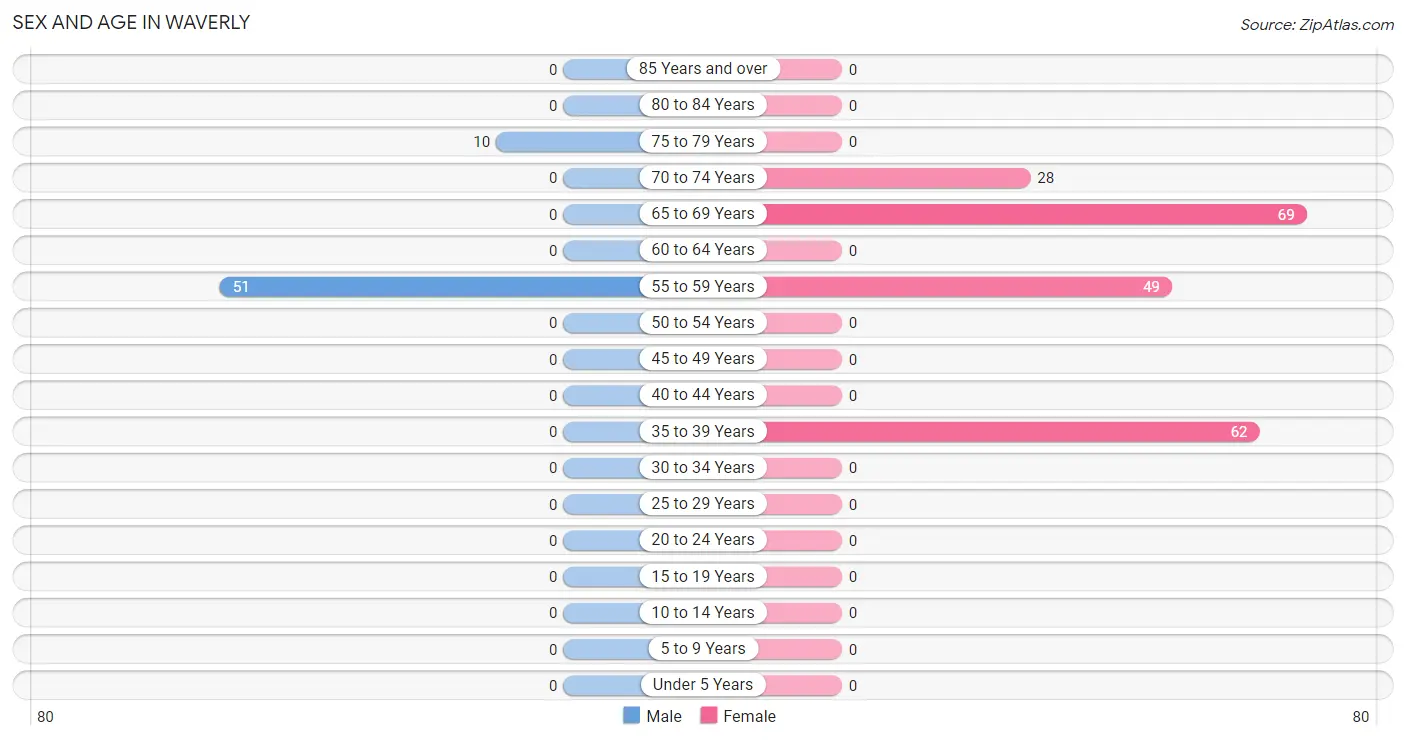
| Age Bracket | Male | Female |
| Under 5 Years | 0 (0.0%) | 0 (0.0%) |
| 5 to 9 Years | 0 (0.0%) | 0 (0.0%) |
| 10 to 14 Years | 0 (0.0%) | 0 (0.0%) |
| 15 to 19 Years | 0 (0.0%) | 0 (0.0%) |
| 20 to 24 Years | 0 (0.0%) | 0 (0.0%) |
| 25 to 29 Years | 0 (0.0%) | 0 (0.0%) |
| 30 to 34 Years | 0 (0.0%) | 0 (0.0%) |
| 35 to 39 Years | 0 (0.0%) | 62 (29.8%) |
| 40 to 44 Years | 0 (0.0%) | 0 (0.0%) |
| 45 to 49 Years | 0 (0.0%) | 0 (0.0%) |
| 50 to 54 Years | 0 (0.0%) | 0 (0.0%) |
| 55 to 59 Years | 51 (83.6%) | 49 (23.6%) |
| 60 to 64 Years | 0 (0.0%) | 0 (0.0%) |
| 65 to 69 Years | 0 (0.0%) | 69 (33.2%) |
| 70 to 74 Years | 0 (0.0%) | 28 (13.5%) |
| 75 to 79 Years | 10 (16.4%) | 0 (0.0%) |
| 80 to 84 Years | 0 (0.0%) | 0 (0.0%) |
| 85 Years and over | 0 (0.0%) | 0 (0.0%) |
| Total | 61 (100.0%) | 208 (100.0%) |
Families and Households in Waverly
Median Family Size in Waverly
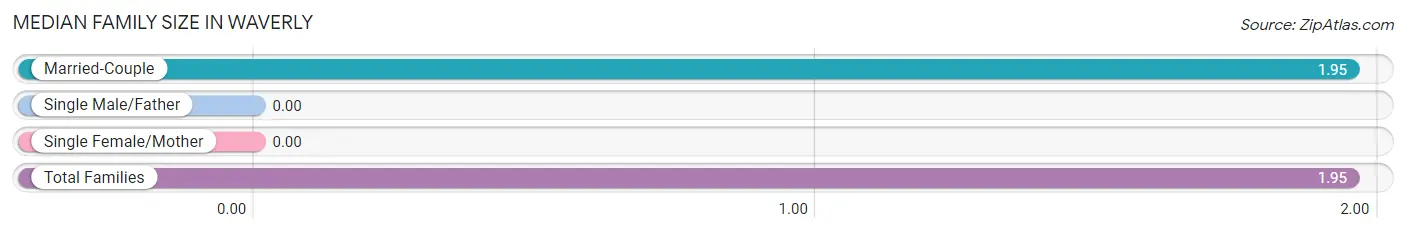
| Family Type | # Families | Family Size |
| Married-Couple | 61 (100.0%) | 1.95 |
| Single Male/Father | 0 (0.0%) | - |
| Single Female/Mother | 0 (0.0%) | - |
| Total Families | 61 (100.0%) | 1.95 |
Median Household Size in Waverly
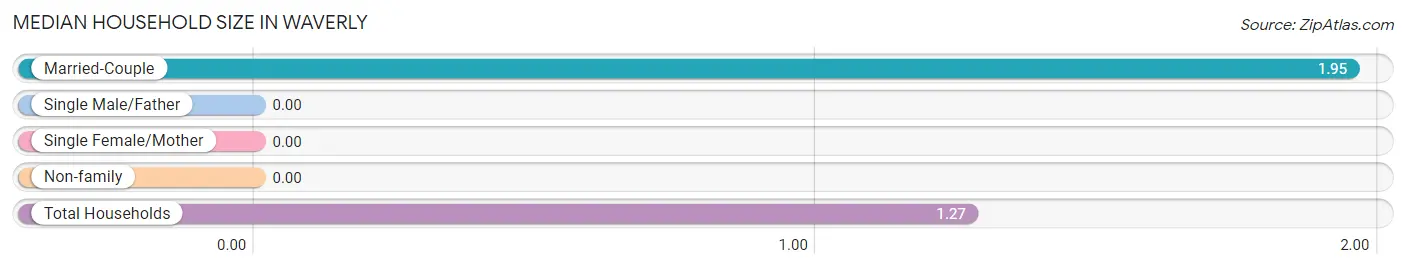
| Household Type | # Households | Household Size |
| Married-Couple | 61 (28.9%) | 1.95 |
| Single Male/Father | 0 (0.0%) | - |
| Single Female/Mother | 0 (0.0%) | - |
| Non-family | 150 (71.1%) | - |
| Total Households | 211 (100.0%) | 1.27 |
Household Size by Marriage Status in Waverly
Out of a total of 211 households in Waverly, 61 (28.9%) are family households, while 150 (71.1%) are nonfamily households. The most numerous type of family households are 2-person households, comprising 61, and the most common type of nonfamily households are 1-person households, comprising 150.
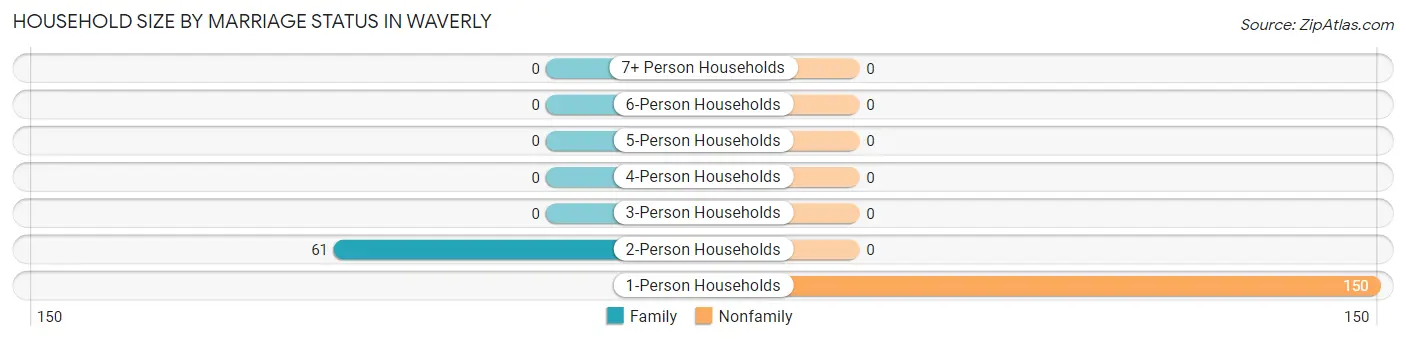
| Household Size | Family Households | Nonfamily Households |
| 1-Person Households | - | 150 (71.1%) |
| 2-Person Households | 61 (28.9%) | 0 (0.0%) |
| 3-Person Households | 0 (0.0%) | 0 (0.0%) |
| 4-Person Households | 0 (0.0%) | 0 (0.0%) |
| 5-Person Households | 0 (0.0%) | 0 (0.0%) |
| 6-Person Households | 0 (0.0%) | 0 (0.0%) |
| 7+ Person Households | 0 (0.0%) | 0 (0.0%) |
| Total | 61 (28.9%) | 150 (71.1%) |
Female Fertility in Waverly
Fertility by Age in Waverly
| Age Bracket | Women with Births | Births / 1,000 Women |
| 15 to 19 years | 0 (0.0%) | 0.0 |
| 20 to 34 years | 0 (0.0%) | 0.0 |
| 35 to 50 years | 0 (0.0%) | 0.0 |
| Total | 0 (0.0%) | 0.0 |
Fertility by Age by Marriage Status in Waverly
| Age Bracket | Married | Unmarried |
| 15 to 19 years | 0 (0.0%) | 0 (0.0%) |
| 20 to 34 years | 0 (0.0%) | 0 (0.0%) |
| 35 to 50 years | 0 (0.0%) | 0 (0.0%) |
| Total | 0 (0.0%) | 0 (0.0%) |
Fertility by Education in Waverly
| Educational Attainment | Women with Births | Births / 1,000 Women |
| Less than High School | 0 (0.0%) | 0.0 |
| High School Diploma | 0 (0.0%) | 0.0 |
| College or Associate's Degree | 0 (0.0%) | 0.0 |
| Bachelor's Degree | 0 (0.0%) | 0.0 |
| Graduate Degree | 0 (0.0%) | 0.0 |
| Total | 0 (0.0%) | 0.0 |
Fertility by Education by Marriage Status in Waverly
| Educational Attainment | Married | Unmarried |
| Less than High School | 0 (0.0%) | 0 (0.0%) |
| High School Diploma | 0 (0.0%) | 0 (0.0%) |
| College or Associate's Degree | 0 (0.0%) | 0 (0.0%) |
| Bachelor's Degree | 0 (0.0%) | 0 (0.0%) |
| Graduate Degree | 0 (0.0%) | 0 (0.0%) |
| Total | 0 (0.0%) | 0 (0.0%) |
Employment Characteristics in Waverly
Employment by Class of Employer in Waverly
Among the 162 employed individuals in Waverly, local government employees (113 | 69.8%), and not-for-profit organizations (49 | 30.2%) make up the most common classes of employment.
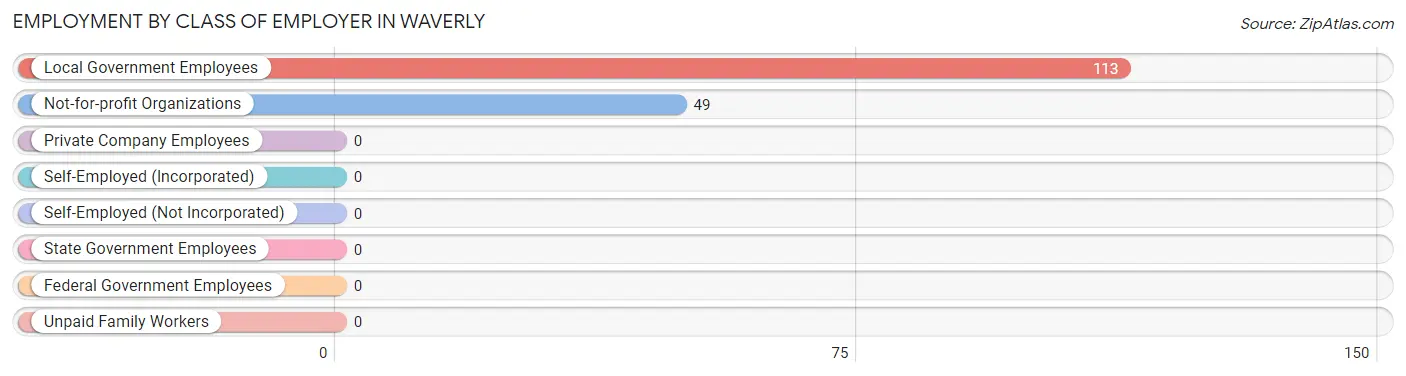
| Employer Class | # Employees | % Employees |
| Private Company Employees | 0 | 0.0% |
| Self-Employed (Incorporated) | 0 | 0.0% |
| Self-Employed (Not Incorporated) | 0 | 0.0% |
| Not-for-profit Organizations | 49 | 30.2% |
| Local Government Employees | 113 | 69.8% |
| State Government Employees | 0 | 0.0% |
| Federal Government Employees | 0 | 0.0% |
| Unpaid Family Workers | 0 | 0.0% |
| Total | 162 | 100.0% |
Employment Status by Age in Waverly
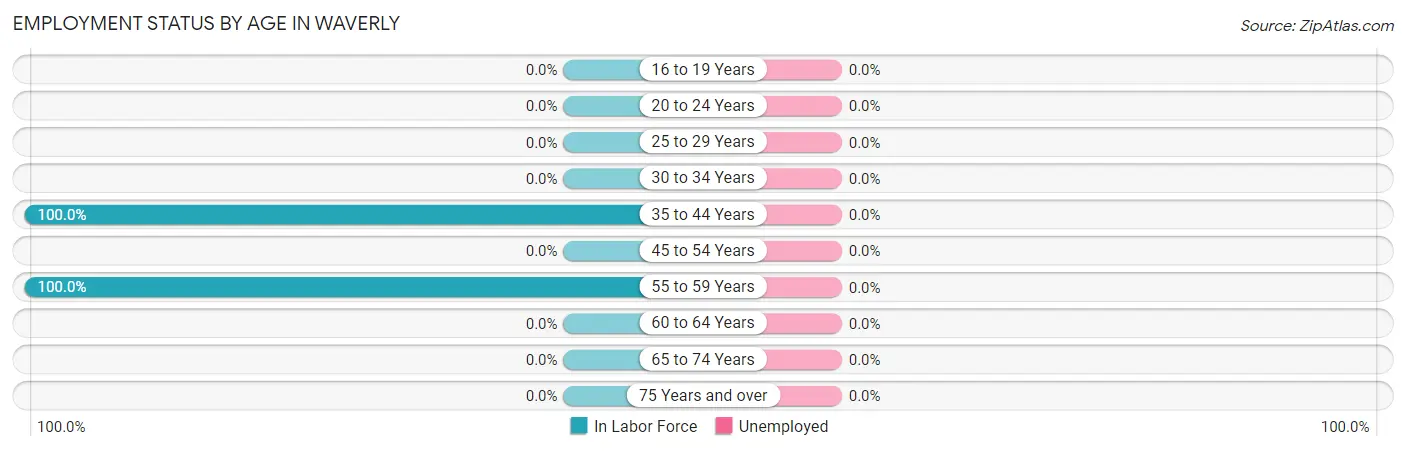
| Age Bracket | In Labor Force | Unemployed |
| 16 to 19 Years | 0 (0.0%) | 0 (0.0%) |
| 20 to 24 Years | 0 (0.0%) | 0 (0.0%) |
| 25 to 29 Years | 0 (0.0%) | 0 (0.0%) |
| 30 to 34 Years | 0 (0.0%) | 0 (0.0%) |
| 35 to 44 Years | 62 (100.0%) | 0 (0.0%) |
| 45 to 54 Years | 0 (0.0%) | 0 (0.0%) |
| 55 to 59 Years | 100 (100.0%) | 0 (0.0%) |
| 60 to 64 Years | 0 (0.0%) | 0 (0.0%) |
| 65 to 74 Years | 0 (0.0%) | 0 (0.0%) |
| 75 Years and over | 0 (0.0%) | 0 (0.0%) |
| Total | 162 (60.2%) | 0 (0.0%) |
Employment Status by Educational Attainment in Waverly
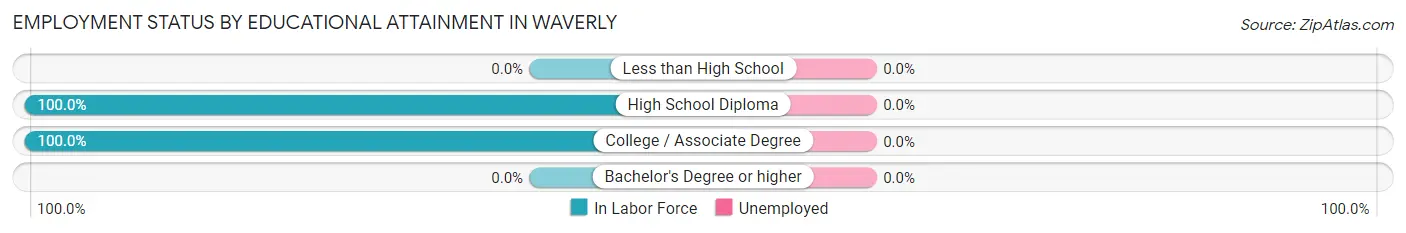
| Educational Attainment | In Labor Force | Unemployed |
| Less than High School | 0 (0.0%) | 0 (0.0%) |
| High School Diploma | 62 (100.0%) | 0 (0.0%) |
| College / Associate Degree | 100 (100.0%) | 0 (0.0%) |
| Bachelor's Degree or higher | 0 (0.0%) | 0 (0.0%) |
| Total | 162 (100.0%) | 0 (0.0%) |
Employment Occupations by Sex in Waverly
Management, Business, Science and Arts Occupations
The most common Management, Business, Science and Arts occupations in Waverly are , and Management (162 | 100.0%).
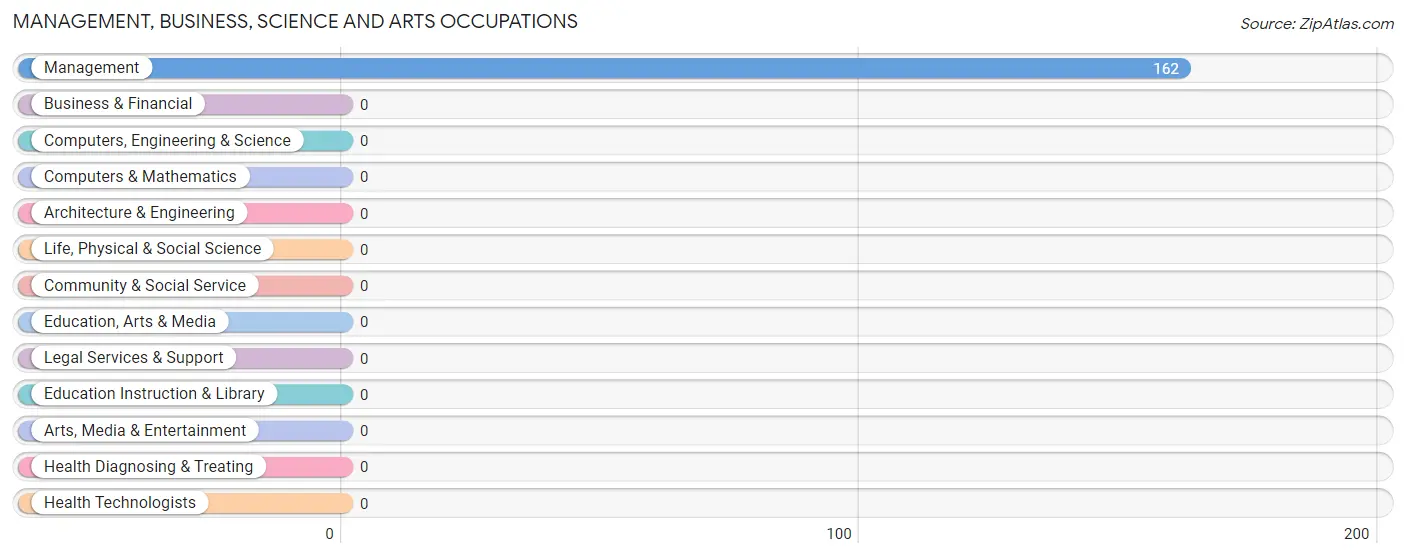
Management, Business, Science and Arts Occupations by Sex
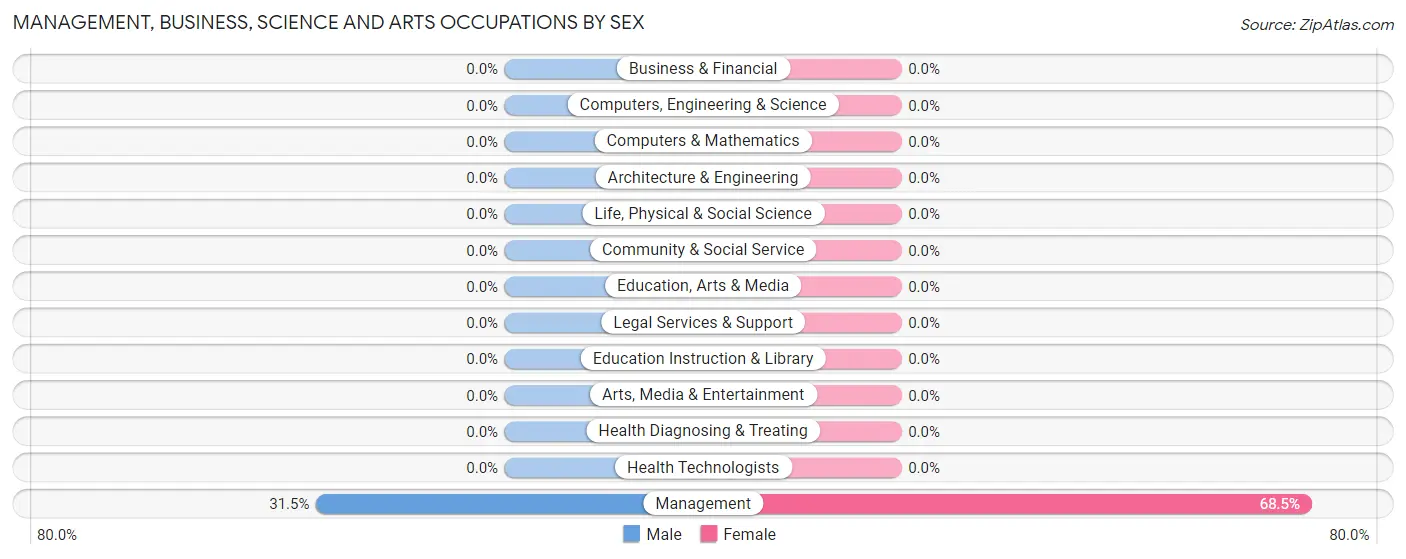
| Occupation | Male | Female |
| Management | 51 (31.5%) | 111 (68.5%) |
| Business & Financial | 0 (0.0%) | 0 (0.0%) |
| Computers, Engineering & Science | 0 (0.0%) | 0 (0.0%) |
| Computers & Mathematics | 0 (0.0%) | 0 (0.0%) |
| Architecture & Engineering | 0 (0.0%) | 0 (0.0%) |
| Life, Physical & Social Science | 0 (0.0%) | 0 (0.0%) |
| Community & Social Service | 0 (0.0%) | 0 (0.0%) |
| Education, Arts & Media | 0 (0.0%) | 0 (0.0%) |
| Legal Services & Support | 0 (0.0%) | 0 (0.0%) |
| Education Instruction & Library | 0 (0.0%) | 0 (0.0%) |
| Arts, Media & Entertainment | 0 (0.0%) | 0 (0.0%) |
| Health Diagnosing & Treating | 0 (0.0%) | 0 (0.0%) |
| Health Technologists | 0 (0.0%) | 0 (0.0%) |
| Total (Category) | 51 (31.5%) | 111 (68.5%) |
| Total (Overall) | 51 (31.5%) | 111 (68.5%) |
Services Occupations
Services Occupations by Sex
| Occupation | Male | Female |
| Healthcare Support | 0 (0.0%) | 0 (0.0%) |
| Security & Protection | 0 (0.0%) | 0 (0.0%) |
| Firefighting & Prevention | 0 (0.0%) | 0 (0.0%) |
| Law Enforcement | 0 (0.0%) | 0 (0.0%) |
| Food Preparation & Serving | 0 (0.0%) | 0 (0.0%) |
| Cleaning & Maintenance | 0 (0.0%) | 0 (0.0%) |
| Personal Care & Service | 0 (0.0%) | 0 (0.0%) |
| Total (Category) | 0 (0.0%) | 0 (0.0%) |
| Total (Overall) | 51 (31.5%) | 111 (68.5%) |
Sales and Office Occupations
Sales and Office Occupations by Sex
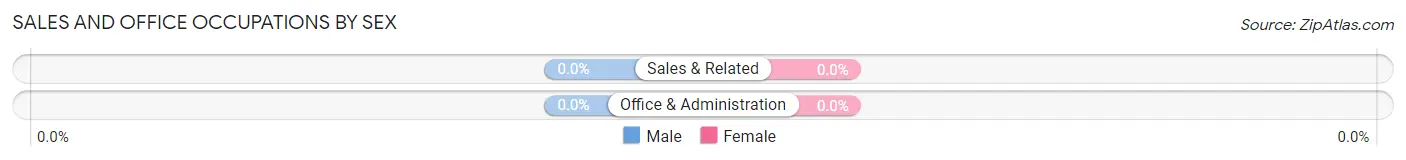
| Occupation | Male | Female |
| Sales & Related | 0 (0.0%) | 0 (0.0%) |
| Office & Administration | 0 (0.0%) | 0 (0.0%) |
| Total (Category) | 0 (0.0%) | 0 (0.0%) |
| Total (Overall) | 51 (31.5%) | 111 (68.5%) |
Natural Resources, Construction and Maintenance Occupations
Natural Resources, Construction and Maintenance Occupations by Sex
| Occupation | Male | Female |
| Farming, Fishing & Forestry | 0 (0.0%) | 0 (0.0%) |
| Construction & Extraction | 0 (0.0%) | 0 (0.0%) |
| Installation, Maintenance & Repair | 0 (0.0%) | 0 (0.0%) |
| Total (Category) | 0 (0.0%) | 0 (0.0%) |
| Total (Overall) | 51 (31.5%) | 111 (68.5%) |
Production, Transportation and Moving Occupations
Production, Transportation and Moving Occupations by Sex
| Occupation | Male | Female |
| Production | 0 (0.0%) | 0 (0.0%) |
| Transportation | 0 (0.0%) | 0 (0.0%) |
| Material Moving | 0 (0.0%) | 0 (0.0%) |
| Total (Category) | 0 (0.0%) | 0 (0.0%) |
| Total (Overall) | 51 (31.5%) | 111 (68.5%) |
Employment Industries by Sex in Waverly
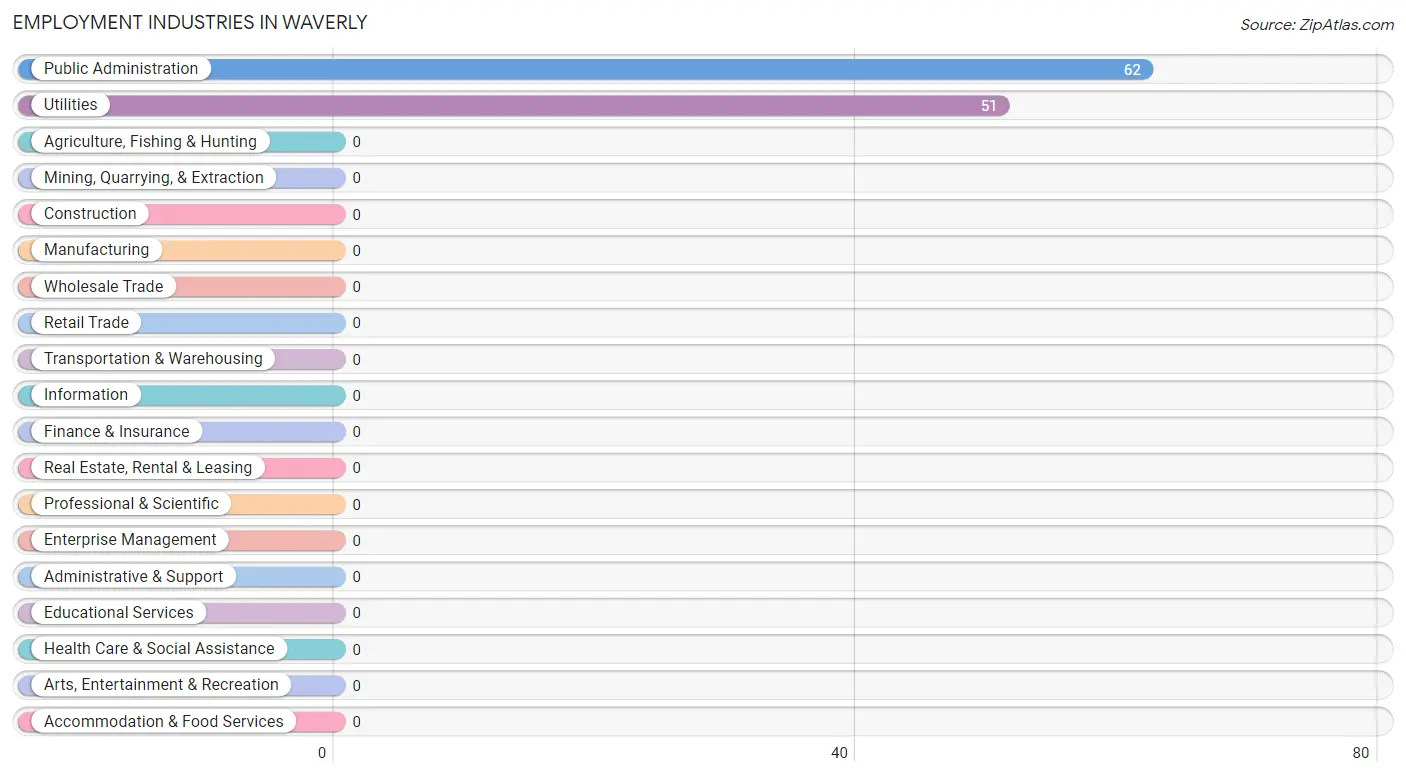
Employment Industries in Waverly
The major employment industries in Waverly include Public Administration (62 | 38.3%), and Utilities (51 | 31.5%).
Employment Industries by Sex in Waverly
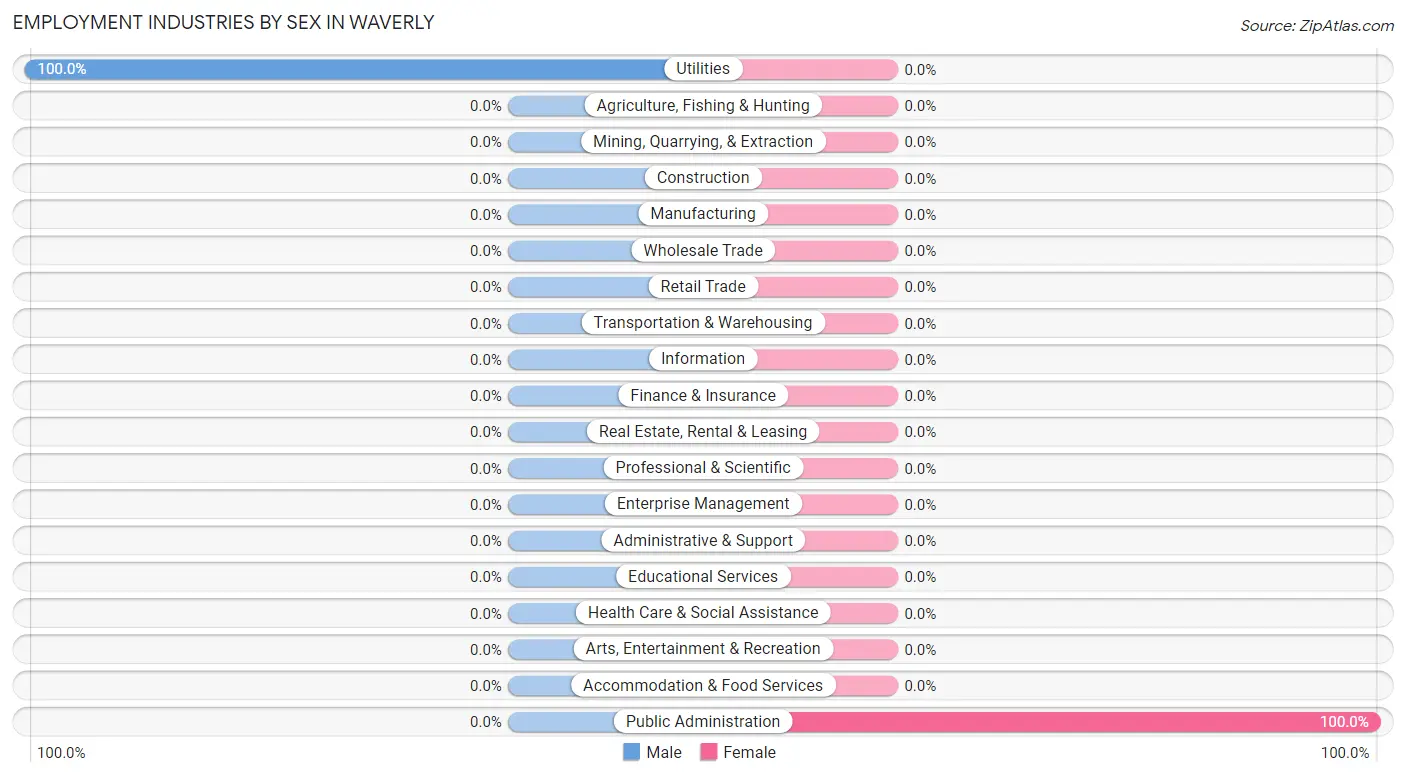
| Industry | Male | Female |
| Agriculture, Fishing & Hunting | 0 (0.0%) | 0 (0.0%) |
| Mining, Quarrying, & Extraction | 0 (0.0%) | 0 (0.0%) |
| Construction | 0 (0.0%) | 0 (0.0%) |
| Manufacturing | 0 (0.0%) | 0 (0.0%) |
| Wholesale Trade | 0 (0.0%) | 0 (0.0%) |
| Retail Trade | 0 (0.0%) | 0 (0.0%) |
| Transportation & Warehousing | 0 (0.0%) | 0 (0.0%) |
| Utilities | 51 (100.0%) | 0 (0.0%) |
| Information | 0 (0.0%) | 0 (0.0%) |
| Finance & Insurance | 0 (0.0%) | 0 (0.0%) |
| Real Estate, Rental & Leasing | 0 (0.0%) | 0 (0.0%) |
| Professional & Scientific | 0 (0.0%) | 0 (0.0%) |
| Enterprise Management | 0 (0.0%) | 0 (0.0%) |
| Administrative & Support | 0 (0.0%) | 0 (0.0%) |
| Educational Services | 0 (0.0%) | 0 (0.0%) |
| Health Care & Social Assistance | 0 (0.0%) | 0 (0.0%) |
| Arts, Entertainment & Recreation | 0 (0.0%) | 0 (0.0%) |
| Accommodation & Food Services | 0 (0.0%) | 0 (0.0%) |
| Public Administration | 0 (0.0%) | 62 (100.0%) |
| Total | 51 (31.5%) | 111 (68.5%) |
Education in Waverly
School Enrollment in Waverly
| School Level | # Students | % Students |
| Nursery / Preschool | 0 | 0.0% |
| Kindergarten | 0 | 0.0% |
| Elementary School | 0 | 0.0% |
| Middle School | 0 | 0.0% |
| High School | 0 | 0.0% |
| College / Undergraduate | 0 | 0.0% |
| Graduate / Professional | 0 | 0.0% |
| Total | 0 | 0.0% |
School Enrollment by Age by Funding Source in Waverly
| Age Bracket | Public School | Private School |
| 3 to 4 Year Olds | 0 (0.0%) | 0 (0.0%) |
| 5 to 9 Year Old | 0 (0.0%) | 0 (0.0%) |
| 10 to 14 Year Olds | 0 (0.0%) | 0 (0.0%) |
| 15 to 17 Year Olds | 0 (0.0%) | 0 (0.0%) |
| 18 to 19 Year Olds | 0 (0.0%) | 0 (0.0%) |
| 20 to 24 Year Olds | 0 (0.0%) | 0 (0.0%) |
| 25 to 34 Year Olds | 0 (0.0%) | 0 (0.0%) |
| 35 Years and over | 0 (0.0%) | 0 (0.0%) |
| Total | 0 (0.0%) | 0 (0.0%) |
Educational Attainment by Field of Study in Waverly
| Field of Study | # Graduates | % Graduates |
| Computers & Mathematics | 0 | 0.0% |
| Bio, Nature & Agricultural | 0 | 0.0% |
| Physical & Health Sciences | 0 | 0.0% |
| Psychology | 0 | 0.0% |
| Social Sciences | 0 | 0.0% |
| Engineering | 0 | 0.0% |
| Multidisciplinary Studies | 0 | 0.0% |
| Science & Technology | 0 | 0.0% |
| Business | 0 | 0.0% |
| Education | 0 | 0.0% |
| Literature & Languages | 0 | 0.0% |
| Liberal Arts & History | 0 | 0.0% |
| Visual & Performing Arts | 0 | 0.0% |
| Communications | 0 | 0.0% |
| Arts & Humanities | 0 | 0.0% |
| Total | 0 | 0.0% |
Transportation & Commute in Waverly
Vehicle Availability by Sex in Waverly
The most prevalent vehicle ownership categories in Waverly are males with 3 vehicles (51, accounting for 100.0%) and females with 3 vehicles (49, making up 46.0%).
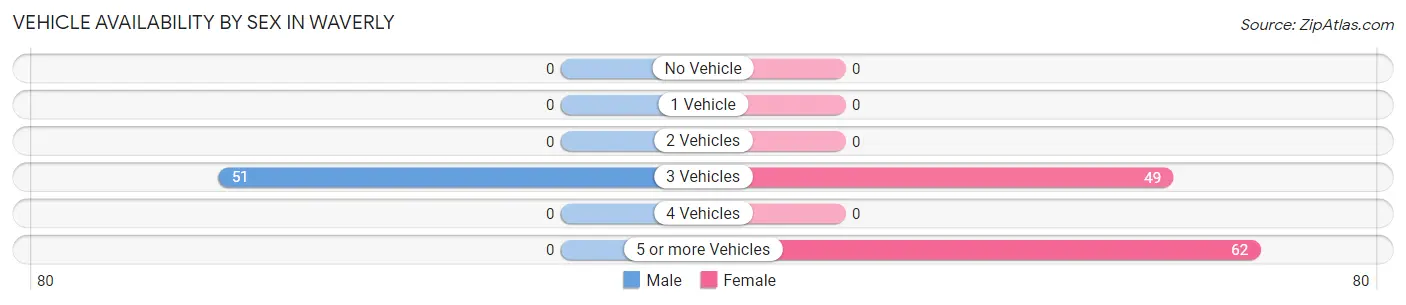
| Vehicles Available | Male | Female |
| No Vehicle | 0 (0.0%) | 0 (0.0%) |
| 1 Vehicle | 0 (0.0%) | 0 (0.0%) |
| 2 Vehicles | 0 (0.0%) | 0 (0.0%) |
| 3 Vehicles | 51 (100.0%) | 49 (44.1%) |
| 4 Vehicles | 0 (0.0%) | 0 (0.0%) |
| 5 or more Vehicles | 0 (0.0%) | 62 (55.9%) |
| Total | 51 (100.0%) | 111 (100.0%) |
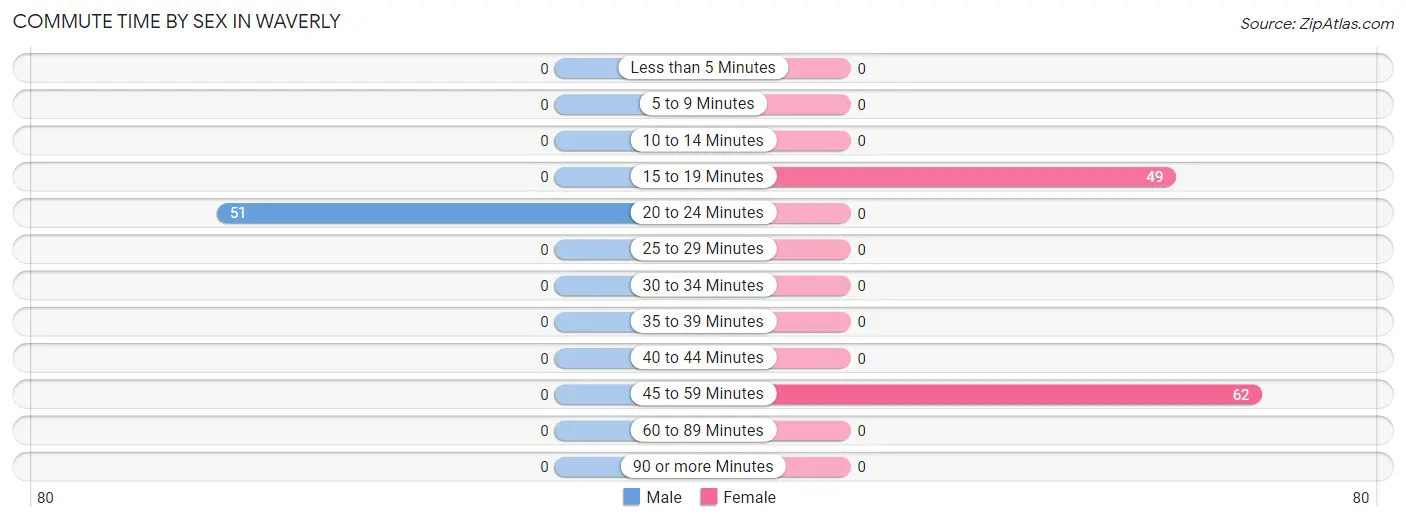
Commute Time in Waverly
The most frequently occuring commute durations in Waverly are 45 to 59 minutes (62 commuters, 38.3%), 20 to 24 minutes (51 commuters, 31.5%), and 15 to 19 minutes (49 commuters, 30.2%).
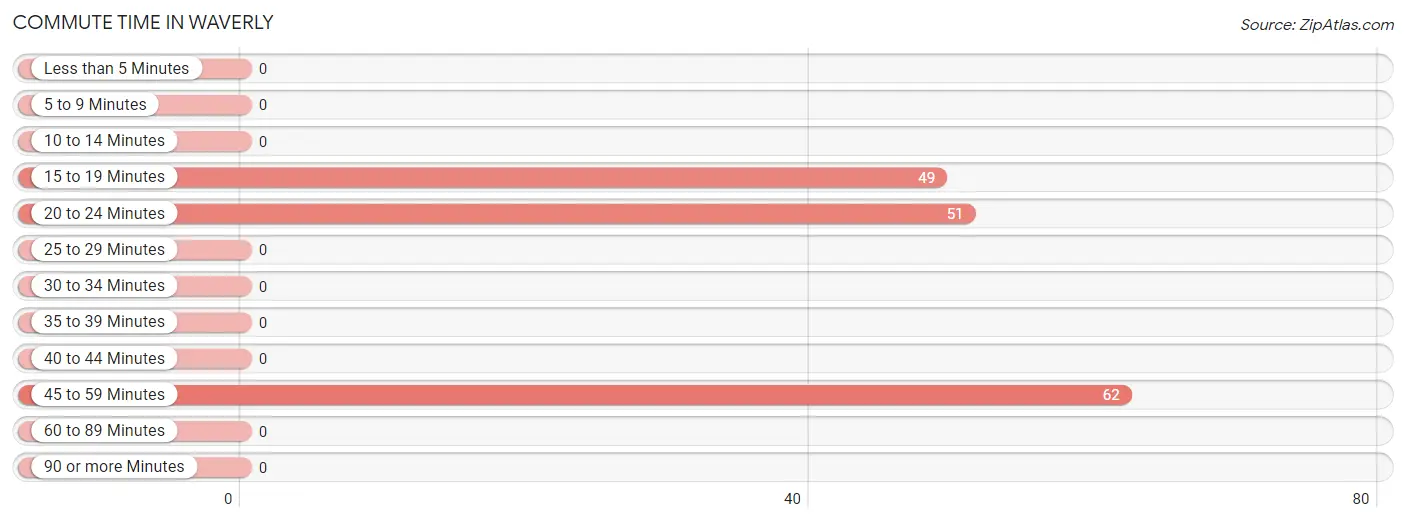
| Commute Time | # Commuters | % Commuters |
| Less than 5 Minutes | 0 | 0.0% |
| 5 to 9 Minutes | 0 | 0.0% |
| 10 to 14 Minutes | 0 | 0.0% |
| 15 to 19 Minutes | 49 | 30.2% |
| 20 to 24 Minutes | 51 | 31.5% |
| 25 to 29 Minutes | 0 | 0.0% |
| 30 to 34 Minutes | 0 | 0.0% |
| 35 to 39 Minutes | 0 | 0.0% |
| 40 to 44 Minutes | 0 | 0.0% |
| 45 to 59 Minutes | 62 | 38.3% |
| 60 to 89 Minutes | 0 | 0.0% |
| 90 or more Minutes | 0 | 0.0% |
Commute Time by Sex in Waverly
The most common commute times in Waverly are 20 to 24 minutes (51 commuters, 100.0%) for males and 45 to 59 minutes (62 commuters, 55.9%) for females.
| Commute Time | Male | Female |
| Less than 5 Minutes | 0 (0.0%) | 0 (0.0%) |
| 5 to 9 Minutes | 0 (0.0%) | 0 (0.0%) |
| 10 to 14 Minutes | 0 (0.0%) | 0 (0.0%) |
| 15 to 19 Minutes | 0 (0.0%) | 49 (44.1%) |
| 20 to 24 Minutes | 51 (100.0%) | 0 (0.0%) |
| 25 to 29 Minutes | 0 (0.0%) | 0 (0.0%) |
| 30 to 34 Minutes | 0 (0.0%) | 0 (0.0%) |
| 35 to 39 Minutes | 0 (0.0%) | 0 (0.0%) |
| 40 to 44 Minutes | 0 (0.0%) | 0 (0.0%) |
| 45 to 59 Minutes | 0 (0.0%) | 62 (55.9%) |
| 60 to 89 Minutes | 0 (0.0%) | 0 (0.0%) |
| 90 or more Minutes | 0 (0.0%) | 0 (0.0%) |
Time of Departure to Work by Sex in Waverly
The most frequent times of departure to work in Waverly are 7:30 AM to 7:59 AM (51, 100.0%) for males and 8:00 AM to 8:29 AM (111, 100.0%) for females.
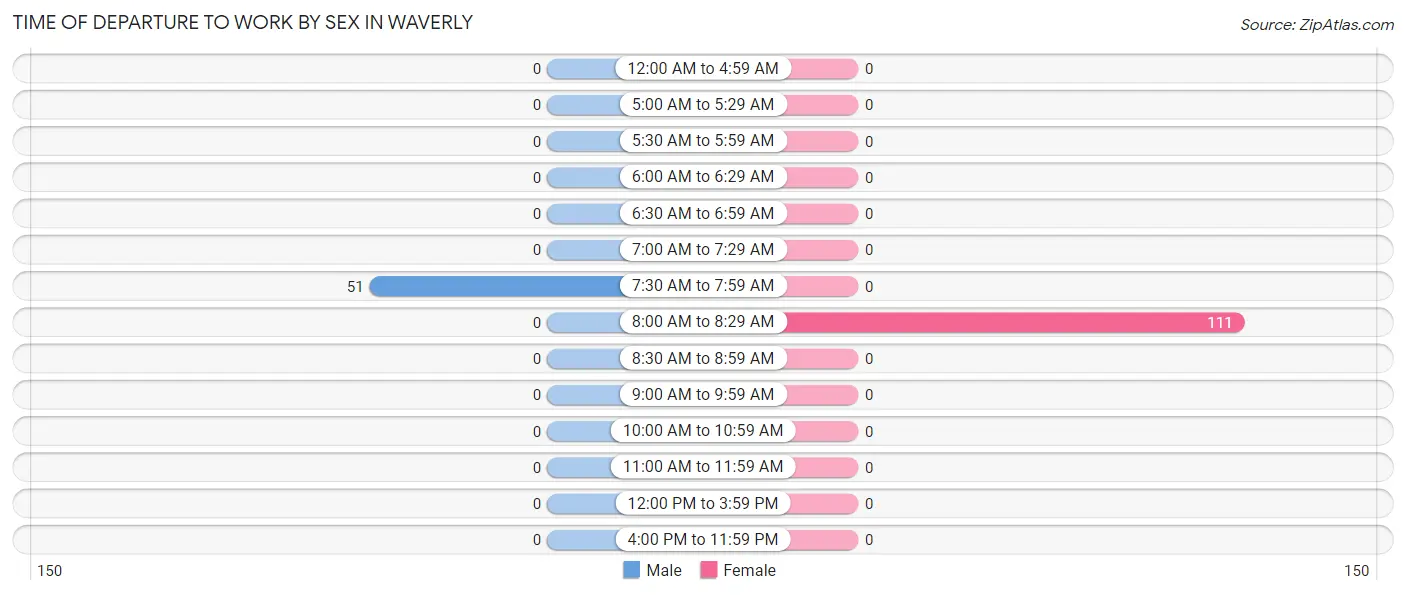
| Time of Departure | Male | Female |
| 12:00 AM to 4:59 AM | 0 (0.0%) | 0 (0.0%) |
| 5:00 AM to 5:29 AM | 0 (0.0%) | 0 (0.0%) |
| 5:30 AM to 5:59 AM | 0 (0.0%) | 0 (0.0%) |
| 6:00 AM to 6:29 AM | 0 (0.0%) | 0 (0.0%) |
| 6:30 AM to 6:59 AM | 0 (0.0%) | 0 (0.0%) |
| 7:00 AM to 7:29 AM | 0 (0.0%) | 0 (0.0%) |
| 7:30 AM to 7:59 AM | 51 (100.0%) | 0 (0.0%) |
| 8:00 AM to 8:29 AM | 0 (0.0%) | 111 (100.0%) |
| 8:30 AM to 8:59 AM | 0 (0.0%) | 0 (0.0%) |
| 9:00 AM to 9:59 AM | 0 (0.0%) | 0 (0.0%) |
| 10:00 AM to 10:59 AM | 0 (0.0%) | 0 (0.0%) |
| 11:00 AM to 11:59 AM | 0 (0.0%) | 0 (0.0%) |
| 12:00 PM to 3:59 PM | 0 (0.0%) | 0 (0.0%) |
| 4:00 PM to 11:59 PM | 0 (0.0%) | 0 (0.0%) |
| Total | 51 (100.0%) | 111 (100.0%) |
Housing Occupancy in Waverly
Occupancy by Ownership in Waverly
Of the total 211 dwellings in Waverly, owner-occupied units account for 211 (100.0%), while renter-occupied units make up 0 (0.0%).
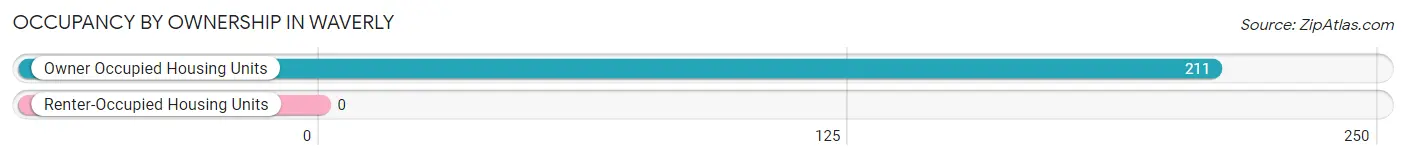
| Occupancy | # Housing Units | % Housing Units |
| Owner Occupied Housing Units | 211 | 100.0% |
| Renter-Occupied Housing Units | 0 | 0.0% |
| Total Occupied Housing Units | 211 | 100.0% |
Occupancy by Household Size in Waverly
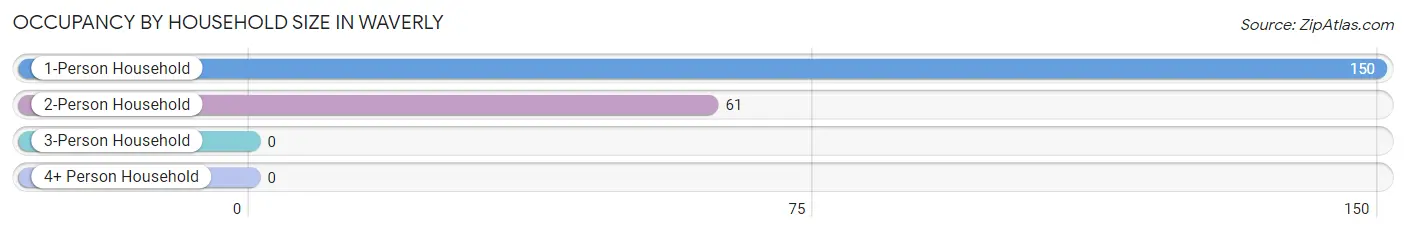
| Household Size | # Housing Units | % Housing Units |
| 1-Person Household | 150 | 71.1% |
| 2-Person Household | 61 | 28.9% |
| 3-Person Household | 0 | 0.0% |
| 4+ Person Household | 0 | 0.0% |
| Total Housing Units | 211 | 100.0% |
Occupancy by Ownership by Household Size in Waverly
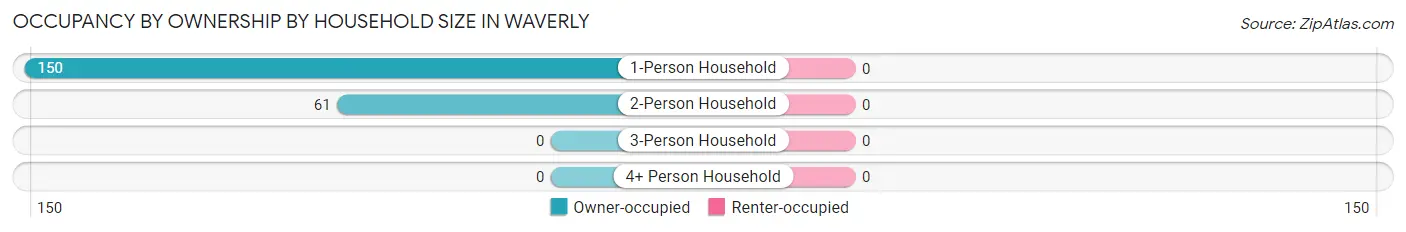
| Household Size | Owner-occupied | Renter-occupied |
| 1-Person Household | 150 (100.0%) | 0 (0.0%) |
| 2-Person Household | 61 (100.0%) | 0 (0.0%) |
| 3-Person Household | 0 (0.0%) | 0 (0.0%) |
| 4+ Person Household | 0 (0.0%) | 0 (0.0%) |
| Total Housing Units | 211 (100.0%) | 0 (0.0%) |
Occupancy by Educational Attainment in Waverly
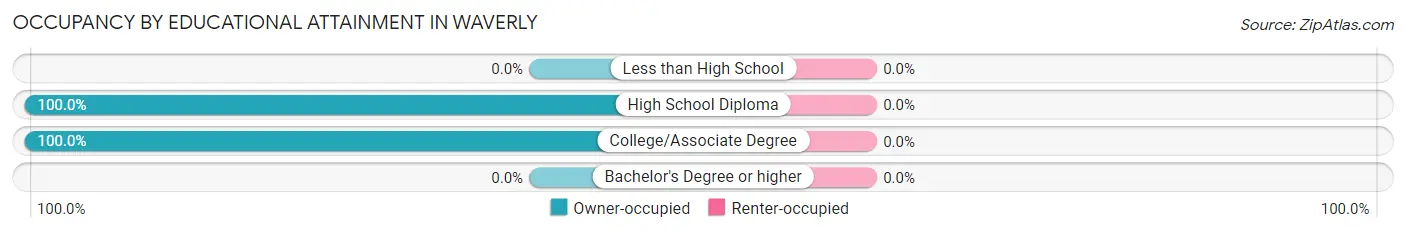
| Household Size | Owner-occupied | Renter-occupied |
| Less than High School | 0 (0.0%) | 0 (0.0%) |
| High School Diploma | 132 (100.0%) | 0 (0.0%) |
| College/Associate Degree | 79 (100.0%) | 0 (0.0%) |
| Bachelor's Degree or higher | 0 (0.0%) | 0 (0.0%) |
Occupancy by Age of Householder in Waverly
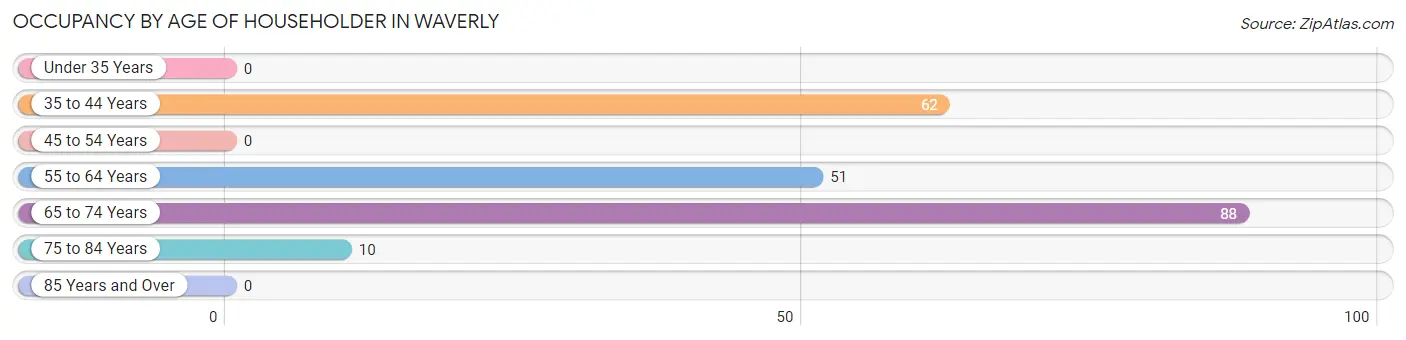
| Age Bracket | # Households | % Households |
| Under 35 Years | 0 | 0.0% |
| 35 to 44 Years | 62 | 29.4% |
| 45 to 54 Years | 0 | 0.0% |
| 55 to 64 Years | 51 | 24.2% |
| 65 to 74 Years | 88 | 41.7% |
| 75 to 84 Years | 10 | 4.7% |
| 85 Years and Over | 0 | 0.0% |
| Total | 211 | 100.0% |
Housing Finances in Waverly
Median Income by Occupancy in Waverly
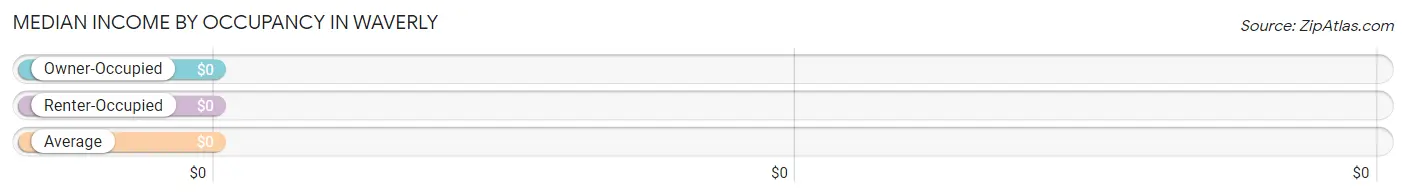
| Occupancy Type | # Households | Median Income |
| Owner-Occupied | 211 (100.0%) | $0 |
| Renter-Occupied | 0 (0.0%) | $0 |
| Average | 211 (100.0%) | $0 |
Occupancy by Householder Income Bracket in Waverly
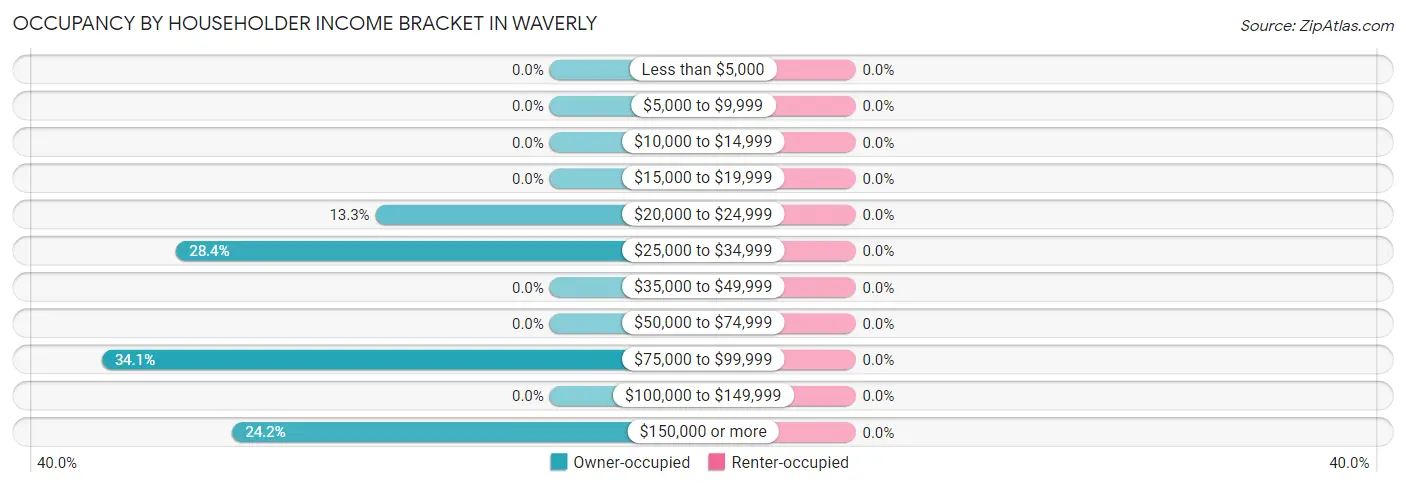
| Income Bracket | Owner-occupied | Renter-occupied |
| Less than $5,000 | 0 (0.0%) | 0 (0.0%) |
| $5,000 to $9,999 | 0 (0.0%) | 0 (0.0%) |
| $10,000 to $14,999 | 0 (0.0%) | 0 (0.0%) |
| $15,000 to $19,999 | 0 (0.0%) | 0 (0.0%) |
| $20,000 to $24,999 | 28 (13.3%) | 0 (0.0%) |
| $25,000 to $34,999 | 60 (28.4%) | 0 (0.0%) |
| $35,000 to $49,999 | 0 (0.0%) | 0 (0.0%) |
| $50,000 to $74,999 | 0 (0.0%) | 0 (0.0%) |
| $75,000 to $99,999 | 72 (34.1%) | 0 (0.0%) |
| $100,000 to $149,999 | 0 (0.0%) | 0 (0.0%) |
| $150,000 or more | 51 (24.2%) | 0 (0.0%) |
| Total | 211 (100.0%) | 0 (0.0%) |
Monthly Housing Cost Tiers in Waverly
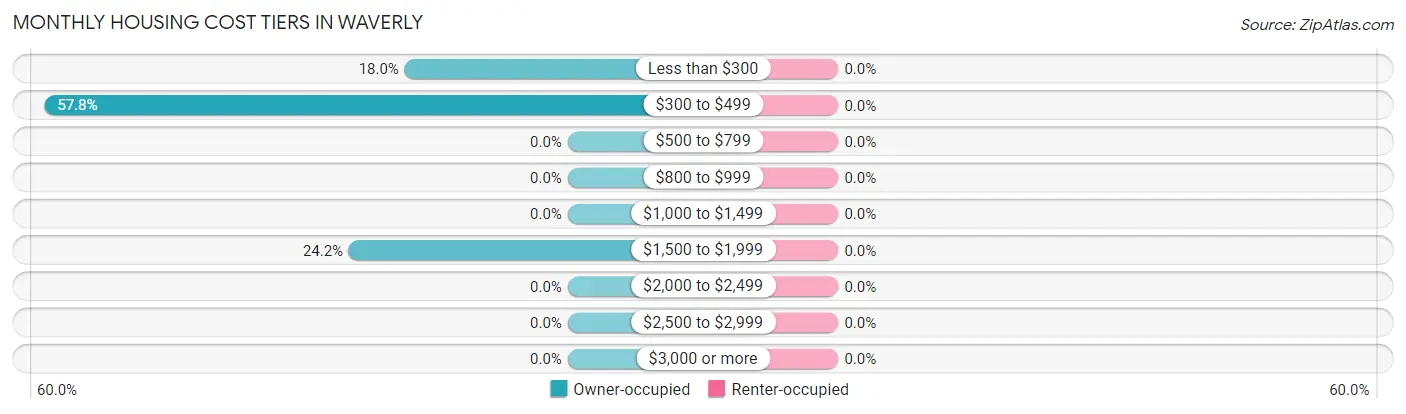
| Monthly Cost | Owner-occupied | Renter-occupied |
| Less than $300 | 38 (18.0%) | 0 (0.0%) |
| $300 to $499 | 122 (57.8%) | 0 (0.0%) |
| $500 to $799 | 0 (0.0%) | 0 (0.0%) |
| $800 to $999 | 0 (0.0%) | 0 (0.0%) |
| $1,000 to $1,499 | 0 (0.0%) | 0 (0.0%) |
| $1,500 to $1,999 | 51 (24.2%) | 0 (0.0%) |
| $2,000 to $2,499 | 0 (0.0%) | 0 (0.0%) |
| $2,500 to $2,999 | 0 (0.0%) | 0 (0.0%) |
| $3,000 or more | 0 (0.0%) | 0 (0.0%) |
| Total | 211 (100.0%) | 0 (0.0%) |
Physical Housing Characteristics in Waverly
Housing Structures in Waverly
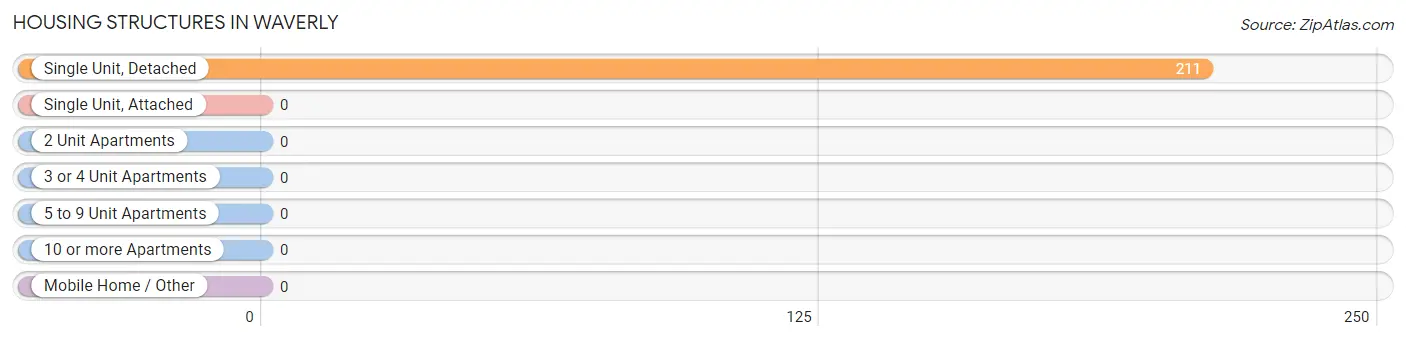
| Structure Type | # Housing Units | % Housing Units |
| Single Unit, Detached | 211 | 100.0% |
| Single Unit, Attached | 0 | 0.0% |
| 2 Unit Apartments | 0 | 0.0% |
| 3 or 4 Unit Apartments | 0 | 0.0% |
| 5 to 9 Unit Apartments | 0 | 0.0% |
| 10 or more Apartments | 0 | 0.0% |
| Mobile Home / Other | 0 | 0.0% |
| Total | 211 | 100.0% |
Housing Structures by Occupancy in Waverly
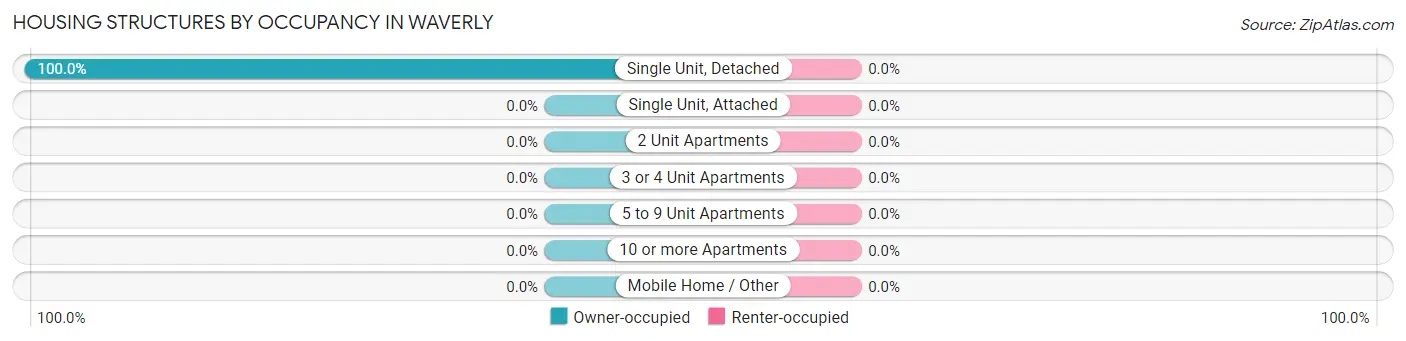
| Structure Type | Owner-occupied | Renter-occupied |
| Single Unit, Detached | 211 (100.0%) | 0 (0.0%) |
| Single Unit, Attached | 0 (0.0%) | 0 (0.0%) |
| 2 Unit Apartments | 0 (0.0%) | 0 (0.0%) |
| 3 or 4 Unit Apartments | 0 (0.0%) | 0 (0.0%) |
| 5 to 9 Unit Apartments | 0 (0.0%) | 0 (0.0%) |
| 10 or more Apartments | 0 (0.0%) | 0 (0.0%) |
| Mobile Home / Other | 0 (0.0%) | 0 (0.0%) |
| Total | 211 (100.0%) | 0 (0.0%) |
Housing Structures by Number of Rooms in Waverly
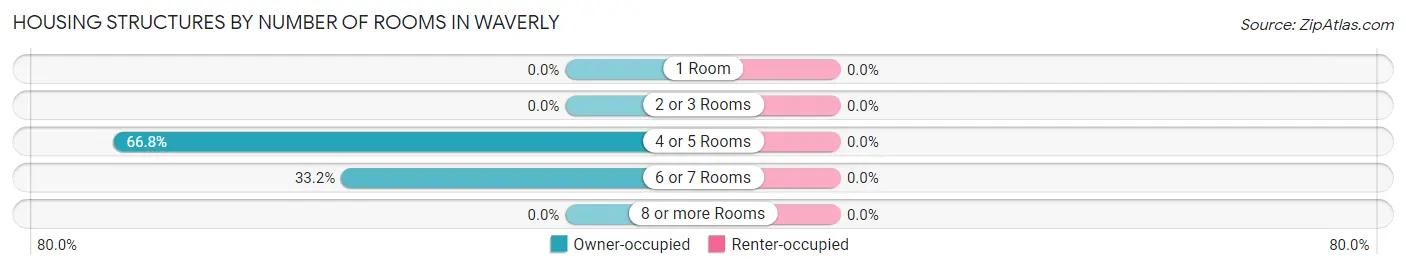
| Number of Rooms | Owner-occupied | Renter-occupied |
| 1 Room | 0 (0.0%) | 0 (0.0%) |
| 2 or 3 Rooms | 0 (0.0%) | 0 (0.0%) |
| 4 or 5 Rooms | 141 (66.8%) | 0 (0.0%) |
| 6 or 7 Rooms | 70 (33.2%) | 0 (0.0%) |
| 8 or more Rooms | 0 (0.0%) | 0 (0.0%) |
| Total | 211 (100.0%) | 0 (0.0%) |
Housing Structure by Heating Type in Waverly
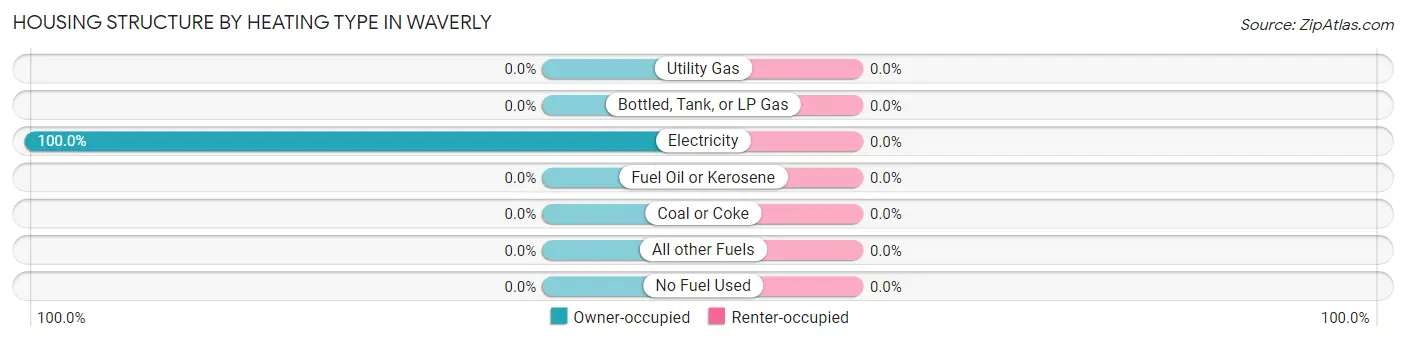
| Heating Type | Owner-occupied | Renter-occupied |
| Utility Gas | 0 (0.0%) | 0 (0.0%) |
| Bottled, Tank, or LP Gas | 0 (0.0%) | 0 (0.0%) |
| Electricity | 211 (100.0%) | 0 (0.0%) |
| Fuel Oil or Kerosene | 0 (0.0%) | 0 (0.0%) |
| Coal or Coke | 0 (0.0%) | 0 (0.0%) |
| All other Fuels | 0 (0.0%) | 0 (0.0%) |
| No Fuel Used | 0 (0.0%) | 0 (0.0%) |
| Total | 211 (100.0%) | 0 (0.0%) |
Household Vehicle Usage in Waverly
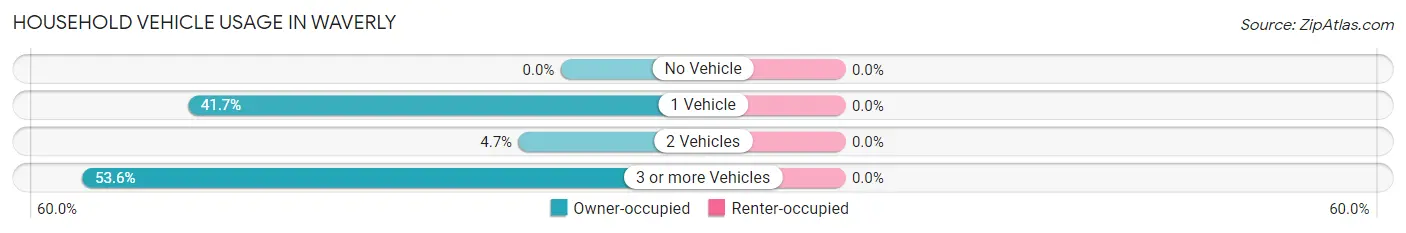
| Vehicles per Household | Owner-occupied | Renter-occupied |
| No Vehicle | 0 (0.0%) | 0 (0.0%) |
| 1 Vehicle | 88 (41.7%) | 0 (0.0%) |
| 2 Vehicles | 10 (4.7%) | 0 (0.0%) |
| 3 or more Vehicles | 113 (53.5%) | 0 (0.0%) |
| Total | 211 (100.0%) | 0 (0.0%) |
Real Estate & Mortgages in Waverly
Real Estate and Mortgage Overview in Waverly
| Characteristic | Without Mortgage | With Mortgage |
| Housing Units | 160 | 51 |
| Median Property Value | $183,600 | $0 |
| Median Household Income | - | - |
| Monthly Housing Costs | $434 | $0 |
| Real Estate Taxes | $560 | $0 |
Property Value by Mortgage Status in Waverly
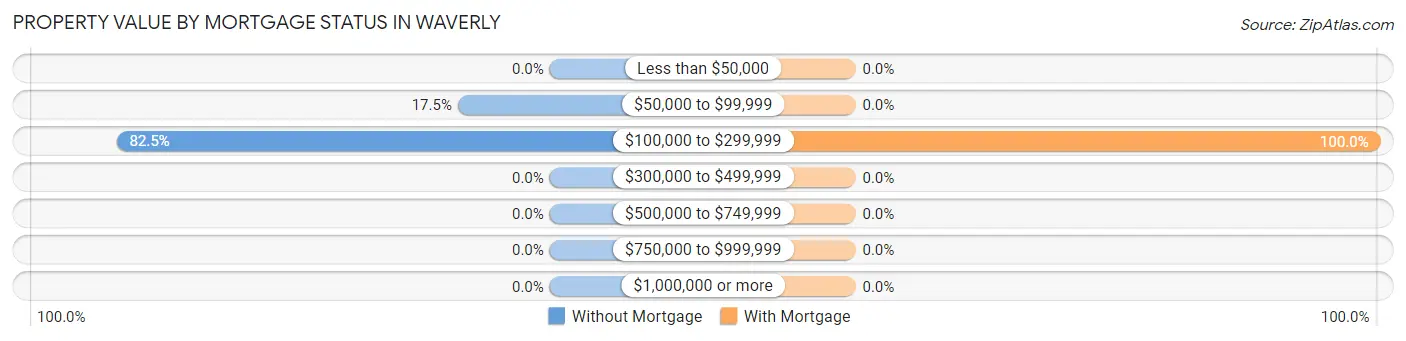
| Property Value | Without Mortgage | With Mortgage |
| Less than $50,000 | 0 (0.0%) | 0 (0.0%) |
| $50,000 to $99,999 | 28 (17.5%) | 0 (0.0%) |
| $100,000 to $299,999 | 132 (82.5%) | 51 (100.0%) |
| $300,000 to $499,999 | 0 (0.0%) | 0 (0.0%) |
| $500,000 to $749,999 | 0 (0.0%) | 0 (0.0%) |
| $750,000 to $999,999 | 0 (0.0%) | 0 (0.0%) |
| $1,000,000 or more | 0 (0.0%) | 0 (0.0%) |
| Total | 160 (100.0%) | 51 (100.0%) |
Household Income by Mortgage Status in Waverly
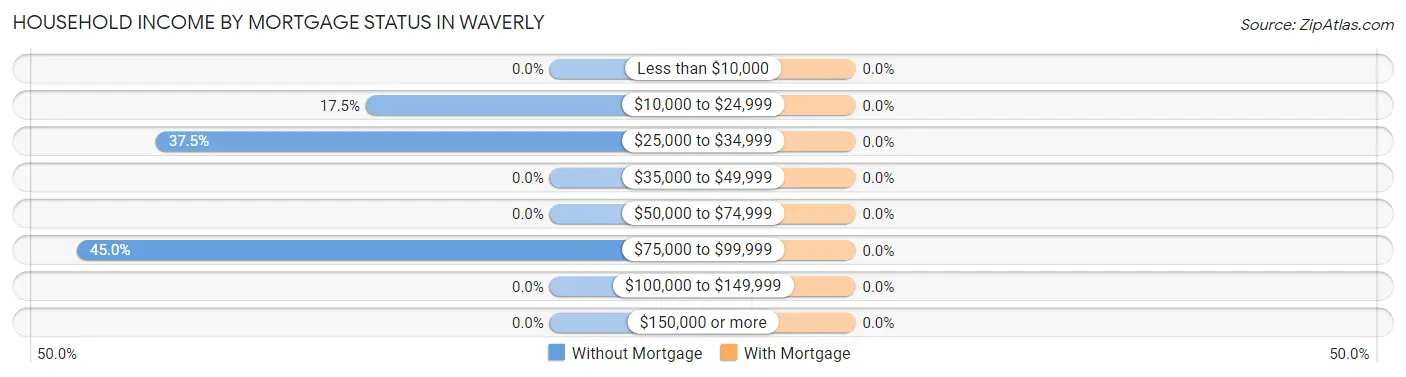
| Household Income | Without Mortgage | With Mortgage |
| Less than $10,000 | 0 (0.0%) | 0 (0.0%) |
| $10,000 to $24,999 | 28 (17.5%) | 0 (0.0%) |
| $25,000 to $34,999 | 60 (37.5%) | 0 (0.0%) |
| $35,000 to $49,999 | 0 (0.0%) | 0 (0.0%) |
| $50,000 to $74,999 | 0 (0.0%) | 0 (0.0%) |
| $75,000 to $99,999 | 72 (45.0%) | 0 (0.0%) |
| $100,000 to $149,999 | 0 (0.0%) | 0 (0.0%) |
| $150,000 or more | 0 (0.0%) | 0 (0.0%) |
| Total | 160 (100.0%) | 51 (100.0%) |
Property Value to Household Income Ratio in Waverly
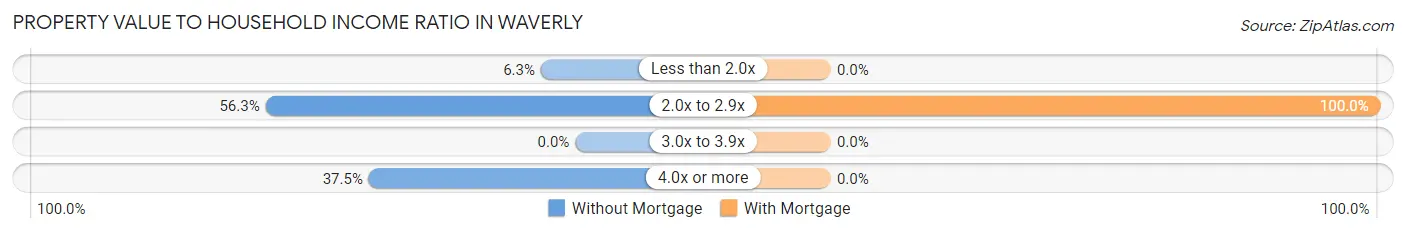
| Value-to-Income Ratio | Without Mortgage | With Mortgage |
| Less than 2.0x | 10 (6.2%) | 0 (0.0%) |
| 2.0x to 2.9x | 90 (56.2%) | 51 (100.0%) |
| 3.0x to 3.9x | 0 (0.0%) | 0 (0.0%) |
| 4.0x or more | 60 (37.5%) | 0 (0.0%) |
| Total | 160 (100.0%) | 51 (100.0%) |
Real Estate Taxes by Mortgage Status in Waverly
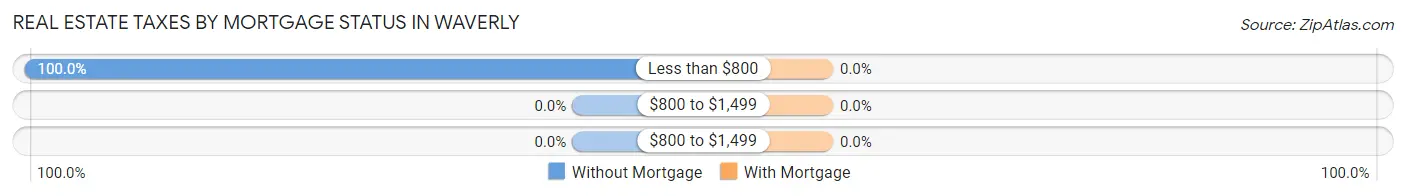
| Property Taxes | Without Mortgage | With Mortgage |
| Less than $800 | 160 (100.0%) | 0 (0.0%) |
| $800 to $1,499 | 0 (0.0%) | 0 (0.0%) |
| $800 to $1,499 | 0 (0.0%) | 0 (0.0%) |
| Total | 160 (100.0%) | 51 (100.0%) |
Health & Disability in Waverly
Health Insurance Coverage by Age in Waverly
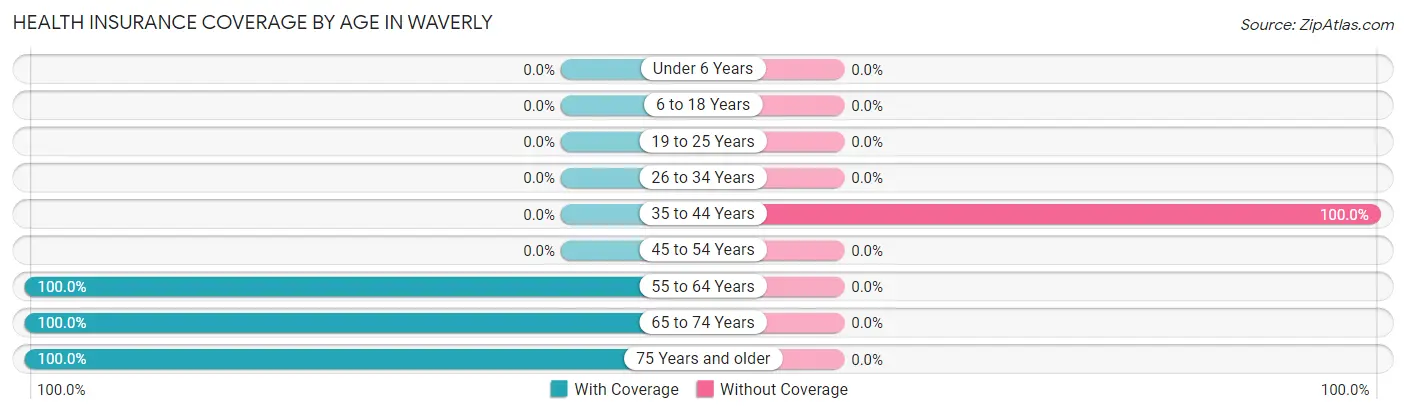
| Age Bracket | With Coverage | Without Coverage |
| Under 6 Years | 0 (0.0%) | 0 (0.0%) |
| 6 to 18 Years | 0 (0.0%) | 0 (0.0%) |
| 19 to 25 Years | 0 (0.0%) | 0 (0.0%) |
| 26 to 34 Years | 0 (0.0%) | 0 (0.0%) |
| 35 to 44 Years | 0 (0.0%) | 62 (100.0%) |
| 45 to 54 Years | 0 (0.0%) | 0 (0.0%) |
| 55 to 64 Years | 100 (100.0%) | 0 (0.0%) |
| 65 to 74 Years | 97 (100.0%) | 0 (0.0%) |
| 75 Years and older | 10 (100.0%) | 0 (0.0%) |
| Total | 207 (76.9%) | 62 (23.1%) |
Health Insurance Coverage by Citizenship Status in Waverly
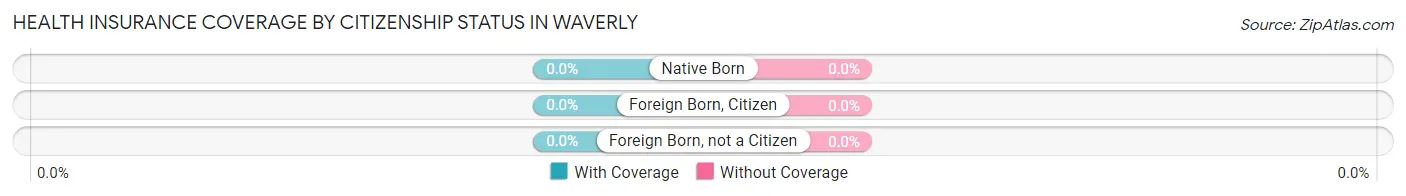
| Citizenship Status | With Coverage | Without Coverage |
| Native Born | 0 (0.0%) | 0 (0.0%) |
| Foreign Born, Citizen | 0 (0.0%) | 0 (0.0%) |
| Foreign Born, not a Citizen | 0 (0.0%) | 0 (0.0%) |
Health Insurance Coverage by Household Income in Waverly
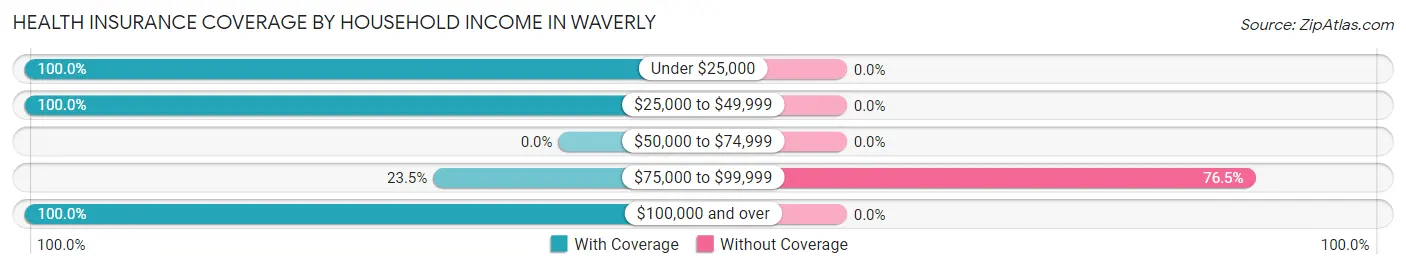
| Household Income | With Coverage | Without Coverage |
| Under $25,000 | 28 (100.0%) | 0 (0.0%) |
| $25,000 to $49,999 | 60 (100.0%) | 0 (0.0%) |
| $50,000 to $74,999 | 0 (0.0%) | 0 (0.0%) |
| $75,000 to $99,999 | 19 (23.5%) | 62 (76.5%) |
| $100,000 and over | 100 (100.0%) | 0 (0.0%) |
Public vs Private Health Insurance Coverage by Age in Waverly
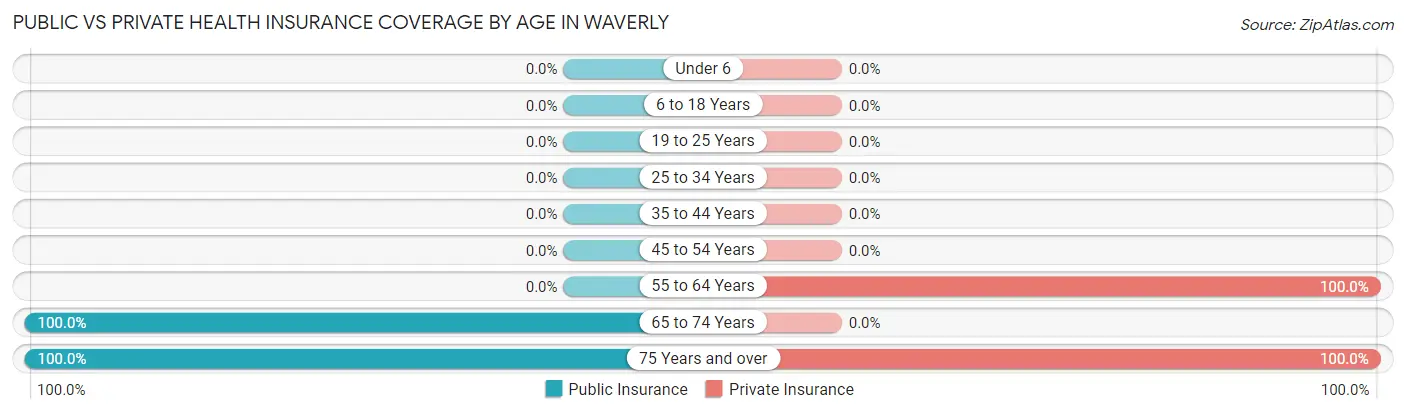
| Age Bracket | Public Insurance | Private Insurance |
| Under 6 | 0 (0.0%) | 0 (0.0%) |
| 6 to 18 Years | 0 (0.0%) | 0 (0.0%) |
| 19 to 25 Years | 0 (0.0%) | 0 (0.0%) |
| 25 to 34 Years | 0 (0.0%) | 0 (0.0%) |
| 35 to 44 Years | 0 (0.0%) | 0 (0.0%) |
| 45 to 54 Years | 0 (0.0%) | 0 (0.0%) |
| 55 to 64 Years | 0 (0.0%) | 100 (100.0%) |
| 65 to 74 Years | 97 (100.0%) | 0 (0.0%) |
| 75 Years and over | 10 (100.0%) | 10 (100.0%) |
| Total | 107 (39.8%) | 110 (40.9%) |
Disability Status by Sex by Age in Waverly
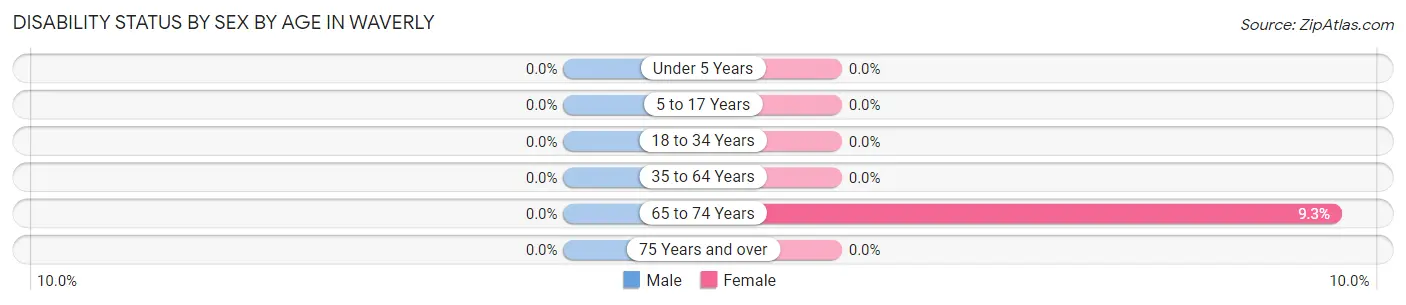
| Age Bracket | Male | Female |
| Under 5 Years | 0 (0.0%) | 0 (0.0%) |
| 5 to 17 Years | 0 (0.0%) | 0 (0.0%) |
| 18 to 34 Years | 0 (0.0%) | 0 (0.0%) |
| 35 to 64 Years | 0 (0.0%) | 0 (0.0%) |
| 65 to 74 Years | 0 (0.0%) | 9 (9.3%) |
| 75 Years and over | 0 (0.0%) | 0 (0.0%) |
Disability Class by Sex by Age in Waverly
Disability Class: Hearing Difficulty
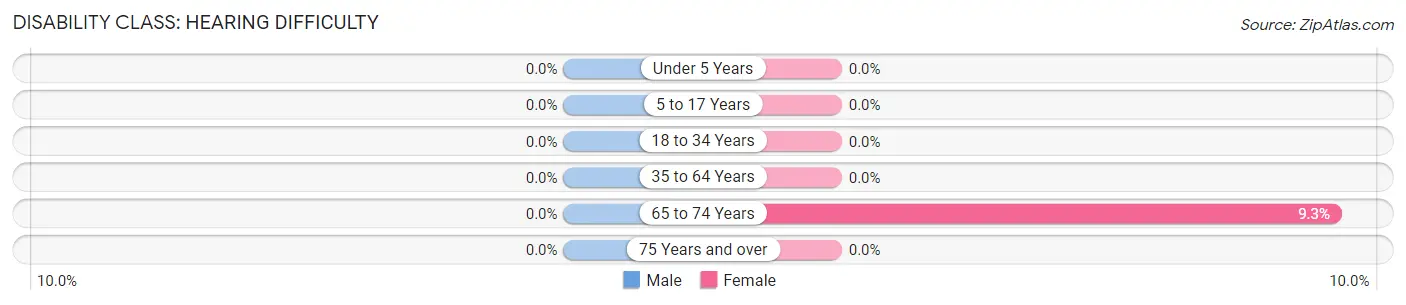
| Age Bracket | Male | Female |
| Under 5 Years | 0 (0.0%) | 0 (0.0%) |
| 5 to 17 Years | 0 (0.0%) | 0 (0.0%) |
| 18 to 34 Years | 0 (0.0%) | 0 (0.0%) |
| 35 to 64 Years | 0 (0.0%) | 0 (0.0%) |
| 65 to 74 Years | 0 (0.0%) | 9 (9.3%) |
| 75 Years and over | 0 (0.0%) | 0 (0.0%) |
Disability Class: Vision Difficulty
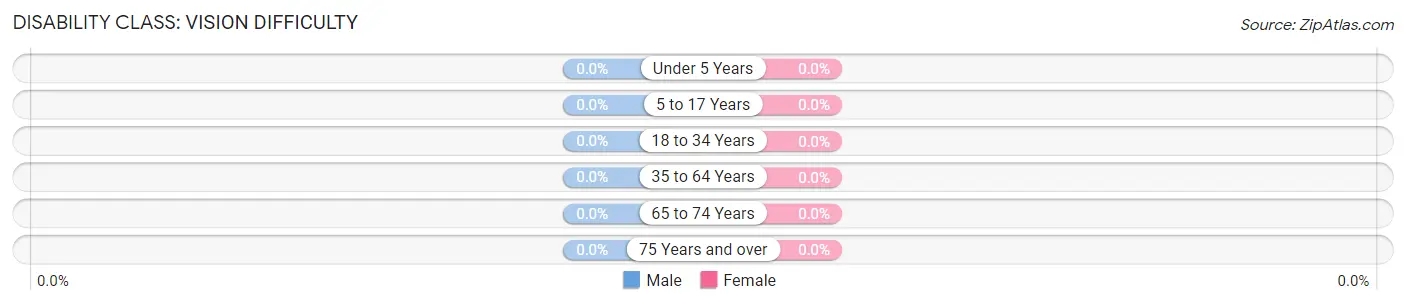
| Age Bracket | Male | Female |
| Under 5 Years | 0 (0.0%) | 0 (0.0%) |
| 5 to 17 Years | 0 (0.0%) | 0 (0.0%) |
| 18 to 34 Years | 0 (0.0%) | 0 (0.0%) |
| 35 to 64 Years | 0 (0.0%) | 0 (0.0%) |
| 65 to 74 Years | 0 (0.0%) | 0 (0.0%) |
| 75 Years and over | 0 (0.0%) | 0 (0.0%) |
Disability Class: Cognitive Difficulty
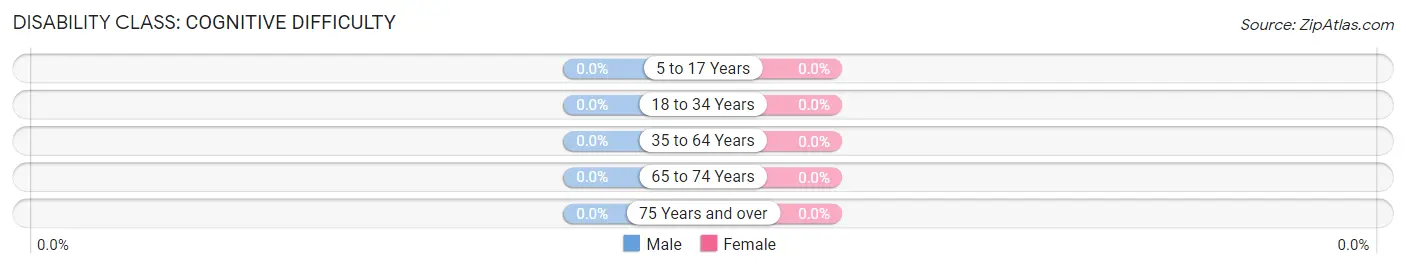
| Age Bracket | Male | Female |
| 5 to 17 Years | 0 (0.0%) | 0 (0.0%) |
| 18 to 34 Years | 0 (0.0%) | 0 (0.0%) |
| 35 to 64 Years | 0 (0.0%) | 0 (0.0%) |
| 65 to 74 Years | 0 (0.0%) | 0 (0.0%) |
| 75 Years and over | 0 (0.0%) | 0 (0.0%) |
Disability Class: Ambulatory Difficulty
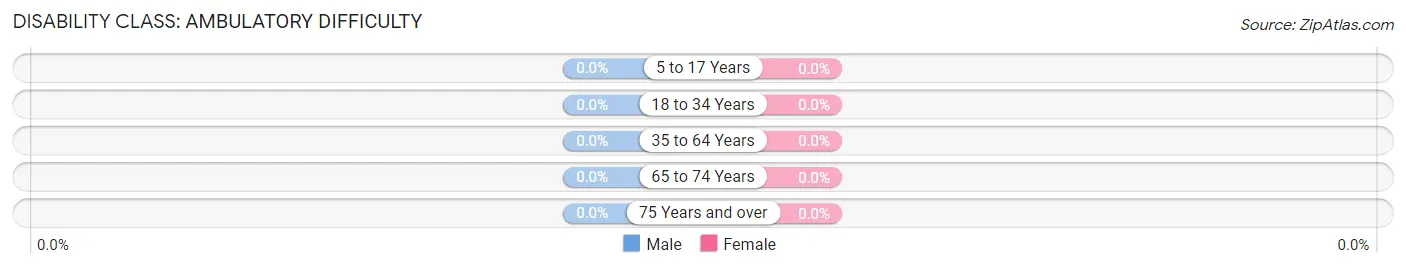
| Age Bracket | Male | Female |
| 5 to 17 Years | 0 (0.0%) | 0 (0.0%) |
| 18 to 34 Years | 0 (0.0%) | 0 (0.0%) |
| 35 to 64 Years | 0 (0.0%) | 0 (0.0%) |
| 65 to 74 Years | 0 (0.0%) | 0 (0.0%) |
| 75 Years and over | 0 (0.0%) | 0 (0.0%) |
Disability Class: Self-Care Difficulty
| Age Bracket | Male | Female |
| 5 to 17 Years | 0 (0.0%) | 0 (0.0%) |
| 18 to 34 Years | 0 (0.0%) | 0 (0.0%) |
| 35 to 64 Years | 0 (0.0%) | 0 (0.0%) |
| 65 to 74 Years | 0 (0.0%) | 0 (0.0%) |
| 75 Years and over | 0 (0.0%) | 0 (0.0%) |
Technology Access in Waverly
Computing Device Access in Waverly
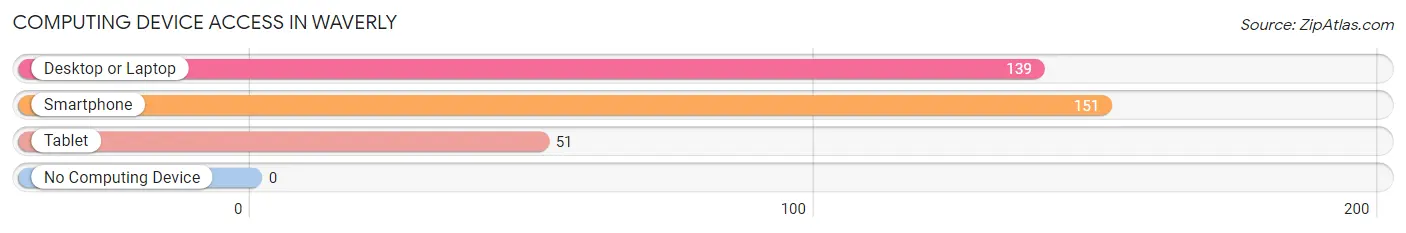
| Device Type | # Households | % Households |
| Desktop or Laptop | 139 | 65.9% |
| Smartphone | 151 | 71.6% |
| Tablet | 51 | 24.2% |
| No Computing Device | 0 | 0.0% |
| Total | 211 | 100.0% |
Internet Access in Waverly
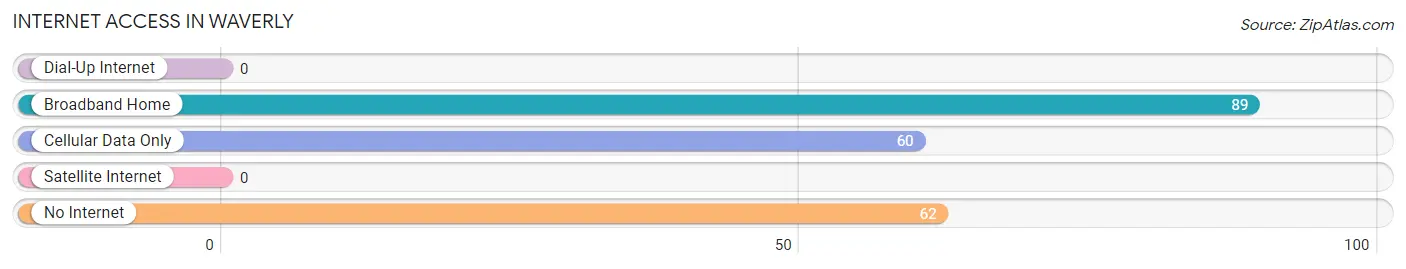
| Internet Type | # Households | % Households |
| Dial-Up Internet | 0 | 0.0% |
| Broadband Home | 89 | 42.2% |
| Cellular Data Only | 60 | 28.4% |
| Satellite Internet | 0 | 0.0% |
| No Internet | 62 | 29.4% |
| Total | 211 | 100.0% |
Waverly Summary
Waverly is a small town located in the panhandle of Florida, in the county of Jackson. It is situated on the banks of the Chipola River, and is surrounded by the Apalachicola National Forest. The town has a population of approximately 1,000 people, and is known for its rural charm and small-town atmosphere.
History
Waverly was founded in 1837 by a group of settlers from Georgia. The town was named after the Waverly Plantation, which was located nearby. The plantation was owned by the prominent local family of the same name. The town was originally a small farming community, and the main crops grown were cotton, corn, and tobacco.
In the late 19th century, Waverly began to grow and develop. The town was incorporated in 1887, and the first mayor was elected in 1888. The town was connected to the rest of the state by the railroad in 1891, and this allowed for the growth of the local economy.
In the early 20th century, Waverly experienced a period of growth and prosperity. The town was home to several businesses, including a sawmill, a gristmill, and a cotton gin. The town also had a school, a post office, and a bank.
Geography
Waverly is located in the panhandle of Florida, in the county of Jackson. It is situated on the banks of the Chipola River, and is surrounded by the Apalachicola National Forest. The town has a total area of 1.2 square miles, and is located at an elevation of 39 feet above sea level.
The climate in Waverly is humid subtropical, with hot, humid summers and mild winters. The average temperature in the summer is around 90 degrees Fahrenheit, and the average temperature in the winter is around 60 degrees Fahrenheit.
Economy
The economy of Waverly is largely based on agriculture and tourism. The town is home to several farms, which produce a variety of crops, including cotton, corn, and tobacco. The town is also home to several tourist attractions, including the Waverly Plantation, which is a historic plantation house.
The town is also home to several small businesses, including restaurants, shops, and a gas station. The town is also home to a few manufacturing companies, which produce a variety of products, including furniture and clothing.
Demographics
As of the 2010 census, the population of Waverly was 1,000 people. The racial makeup of the town was 97.2% White, 0.7% African American, 0.3% Native American, 0.2% Asian, and 1.6% from other races. The median household income was $31,250, and the median family income was $37,500. The per capita income was $17,500.
Conclusion
Waverly is a small town located in the panhandle of Florida, in the county of Jackson. It is situated on the banks of the Chipola River, and is surrounded by the Apalachicola National Forest. The town has a population of approximately 1,000 people, and is known for its rural charm and small-town atmosphere. The economy of Waverly is largely based on agriculture and tourism, and the town is home to several farms, businesses, and tourist attractions. The racial makeup of the town is predominantly White, with a small percentage of African American, Native American, and Asian residents. The median household income is $31,250, and the median family income is $37,500.
Common Questions
What is Per Capita Income in Waverly?
Per Capita income in Waverly is $62,257.
What is Inequality or Gini Index in Waverly?
Inequality or Gini Index in Waverly is 0.39.
What is the Total Population of Waverly?
Total Population of Waverly is 269.
What is the Total Male Population of Waverly?
Total Male Population of Waverly is 61.
What is the Total Female Population of Waverly?
Total Female Population of Waverly is 208.
What is the Ratio of Males per 100 Females in Waverly?
There are 29.33 Males per 100 Females in Waverly.
What is the Ratio of Females per 100 Males in Waverly?
There are 340.98 Females per 100 Males in Waverly.
What is the Median Population Age in Waverly?
Median Population Age in Waverly is 59.5 Years.
What is the Average Family Size in Waverly
Average Family Size in Waverly is 1.9 People.
What is the Average Household Size in Waverly
Average Household Size in Waverly is 1.3 People.
How Large is the Labor Force in Waverly?
There are 162 People in the Labor Forcein in Waverly.
What is the Percentage of People in the Labor Force in Waverly?
60.2% of People are in the Labor Force in Waverly.