Lake Mary Jane, FL Map & Demographics
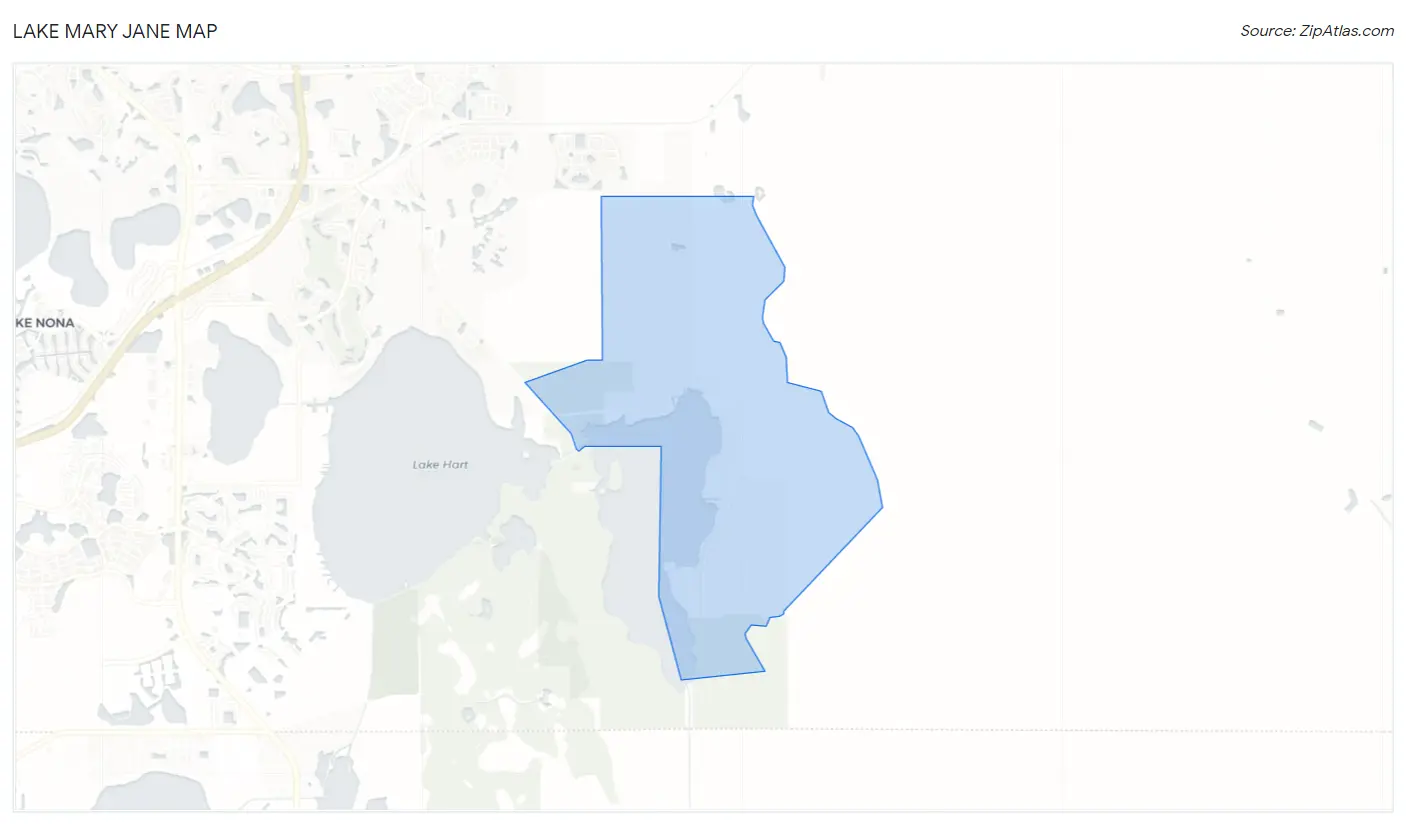
Lake Mary Jane Map
Lake Mary Jane Overview
$54,179
PER CAPITA INCOME
$127,031
AVG FAMILY INCOME
$152,663
AVG HOUSEHOLD INCOME
0.31
INEQUALITY / GINI INDEX
2,122
TOTAL POPULATION
1,188
MALE POPULATION
934
FEMALE POPULATION
127.19
MALES / 100 FEMALES
78.62
FEMALES / 100 MALES
54.3
MEDIAN AGE
2.9
AVG FAMILY SIZE
3.0
AVG HOUSEHOLD SIZE
1,241
LABOR FORCE [ PEOPLE ]
66.0%
PERCENT IN LABOR FORCE
3.1%
UNEMPLOYMENT RATE
Income in Lake Mary Jane
Income Overview in Lake Mary Jane
Per Capita Income in Lake Mary Jane is $54,179, while median incomes of families and households are $127,031 and $152,663 respectively.
| Characteristic | Number | Measure |
| Per Capita Income | 2,122 | $54,179 |
| Median Family Income | 695 | $127,031 |
| Mean Family Income | 695 | $156,665 |
| Median Household Income | 716 | $152,663 |
| Mean Household Income | 716 | $161,113 |
| Income Deficit | 695 | $0 |
| Wage / Income Gap (%) | 2,122 | 0.00% |
| Wage / Income Gap ($) | 2,122 | 100.00¢ per $1 |
| Gini / Inequality Index | 2,122 | 0.31 |
Earnings by Sex in Lake Mary Jane
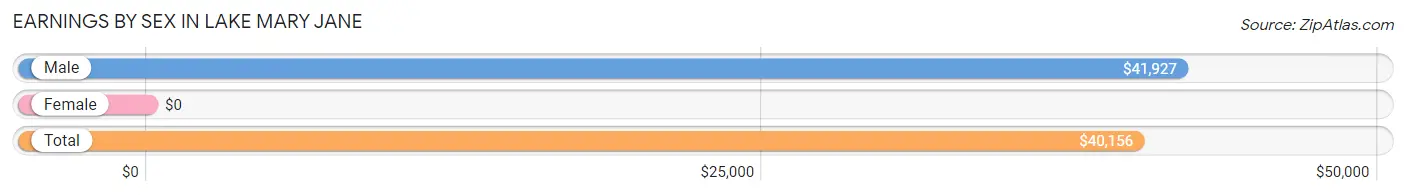
| Sex | Number | Average Earnings |
| Male | 839 (61.7%) | $41,927 |
| Female | 520 (38.3%) | $0 |
| Total | 1,359 (100.0%) | $40,156 |
Earnings by Sex by Income Bracket in Lake Mary Jane
The most common earnings brackets in Lake Mary Jane are $55,000 to $64,999 for men (174 | 20.7%) and $75,000 to $99,999 for women (149 | 28.6%).
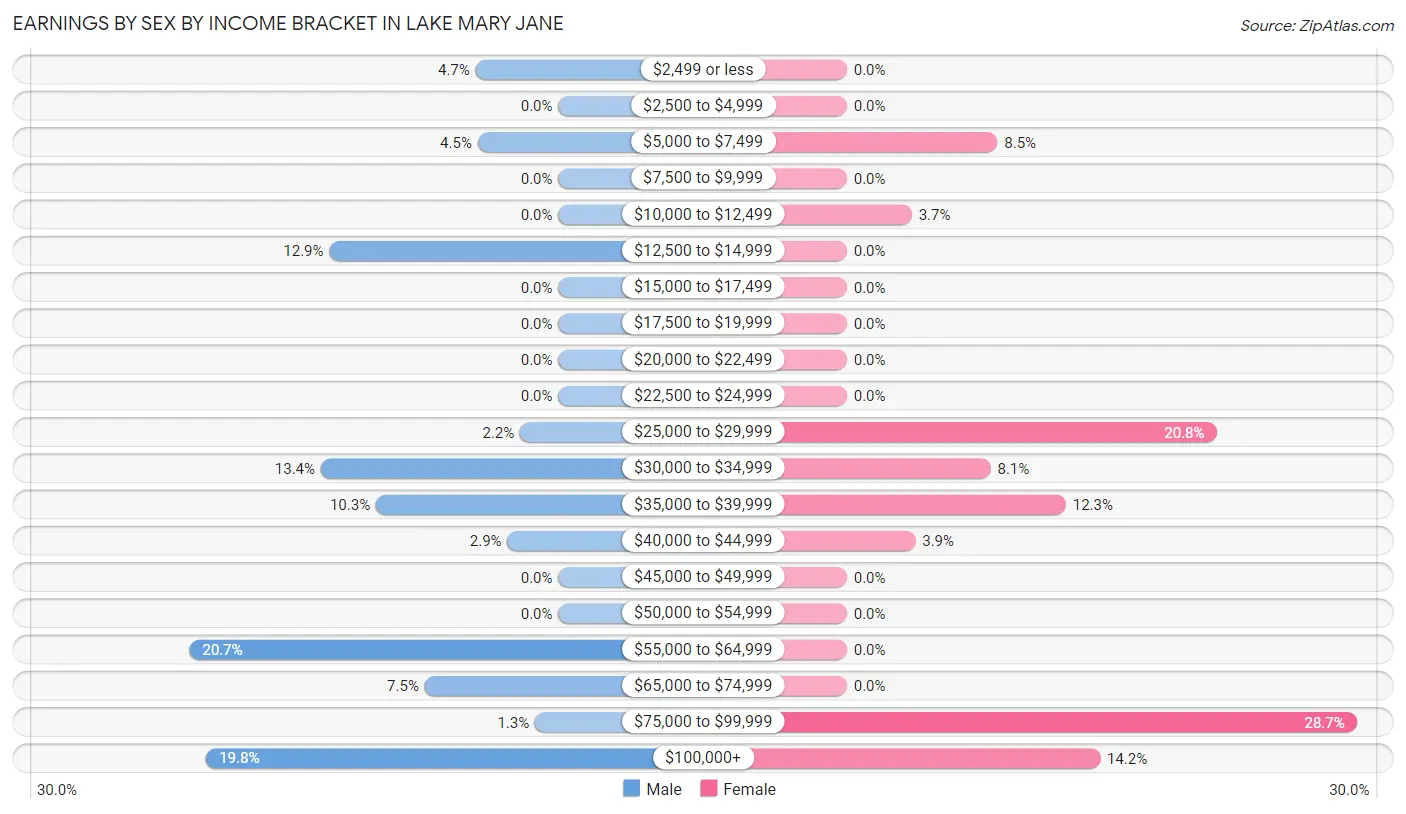
| Income | Male | Female |
| $2,499 or less | 39 (4.6%) | 0 (0.0%) |
| $2,500 to $4,999 | 0 (0.0%) | 0 (0.0%) |
| $5,000 to $7,499 | 38 (4.5%) | 44 (8.5%) |
| $7,500 to $9,999 | 0 (0.0%) | 0 (0.0%) |
| $10,000 to $12,499 | 0 (0.0%) | 19 (3.6%) |
| $12,500 to $14,999 | 108 (12.9%) | 0 (0.0%) |
| $15,000 to $17,499 | 0 (0.0%) | 0 (0.0%) |
| $17,500 to $19,999 | 0 (0.0%) | 0 (0.0%) |
| $20,000 to $22,499 | 0 (0.0%) | 0 (0.0%) |
| $22,500 to $24,999 | 0 (0.0%) | 0 (0.0%) |
| $25,000 to $29,999 | 18 (2.1%) | 108 (20.8%) |
| $30,000 to $34,999 | 112 (13.4%) | 42 (8.1%) |
| $35,000 to $39,999 | 86 (10.2%) | 64 (12.3%) |
| $40,000 to $44,999 | 24 (2.9%) | 20 (3.8%) |
| $45,000 to $49,999 | 0 (0.0%) | 0 (0.0%) |
| $50,000 to $54,999 | 0 (0.0%) | 0 (0.0%) |
| $55,000 to $64,999 | 174 (20.7%) | 0 (0.0%) |
| $65,000 to $74,999 | 63 (7.5%) | 0 (0.0%) |
| $75,000 to $99,999 | 11 (1.3%) | 149 (28.6%) |
| $100,000+ | 166 (19.8%) | 74 (14.2%) |
| Total | 839 (100.0%) | 520 (100.0%) |
Earnings by Sex by Educational Attainment in Lake Mary Jane
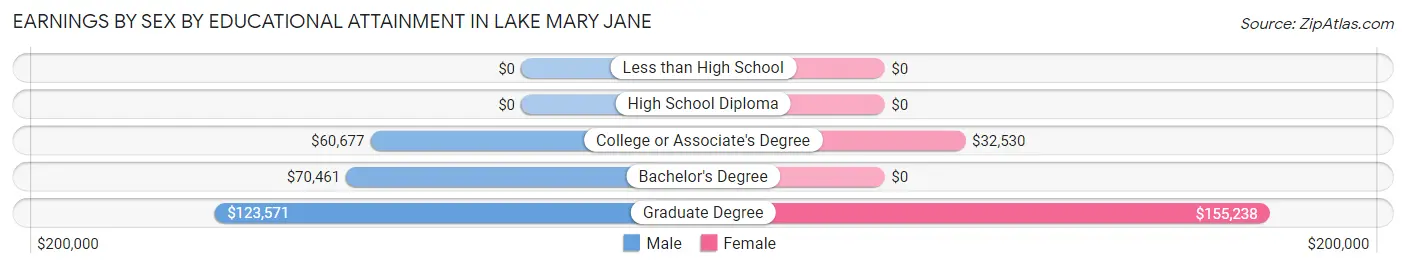
| Educational Attainment | Male Income | Female Income |
| Less than High School | - | - |
| High School Diploma | - | - |
| College or Associate's Degree | $60,677 | $32,530 |
| Bachelor's Degree | $70,461 | $0 |
| Graduate Degree | $123,571 | $155,238 |
| Total | $59,226 | $0 |
Family Income in Lake Mary Jane
Family Income Brackets in Lake Mary Jane
According to the Lake Mary Jane family income data, there are 199 families falling into the $150,000 to $199,999 income range, which is the most common income bracket and makes up 28.6% of all families.
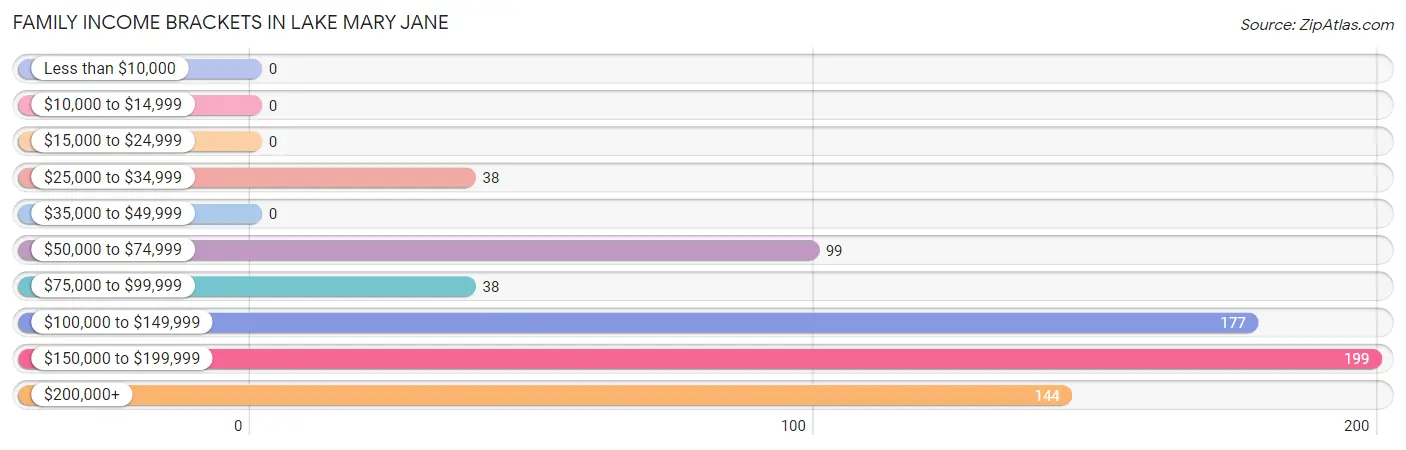
| Income Bracket | # Families | % Families |
| Less than $10,000 | 0 | 0.0% |
| $10,000 to $14,999 | 0 | 0.0% |
| $15,000 to $24,999 | 0 | 0.0% |
| $25,000 to $34,999 | 38 | 5.5% |
| $35,000 to $49,999 | 0 | 0.0% |
| $50,000 to $74,999 | 99 | 14.2% |
| $75,000 to $99,999 | 38 | 5.5% |
| $100,000 to $149,999 | 177 | 25.5% |
| $150,000 to $199,999 | 199 | 28.6% |
| $200,000+ | 144 | 20.7% |
Family Income by Famaliy Size in Lake Mary Jane
4-person families (136 | 19.6%) account for the highest median family income in Lake Mary Jane with $230,375 per family, while 4-person families (136 | 19.6%) have the highest median income of $57,594 per family member.
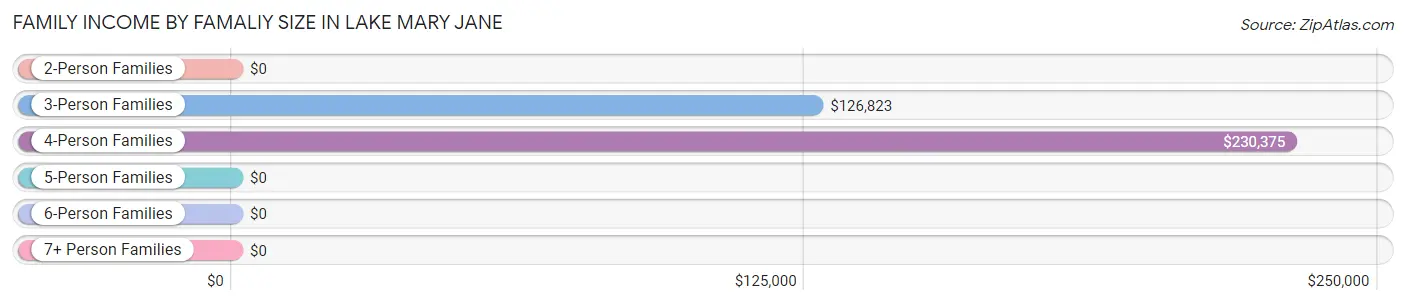
| Income Bracket | # Families | Median Income |
| 2-Person Families | 313 (45.0%) | $0 |
| 3-Person Families | 197 (28.3%) | $126,823 |
| 4-Person Families | 136 (19.6%) | $230,375 |
| 5-Person Families | 29 (4.2%) | $0 |
| 6-Person Families | 20 (2.9%) | $0 |
| 7+ Person Families | 0 (0.0%) | $0 |
| Total | 695 (100.0%) | $127,031 |
Family Income by Number of Earners in Lake Mary Jane
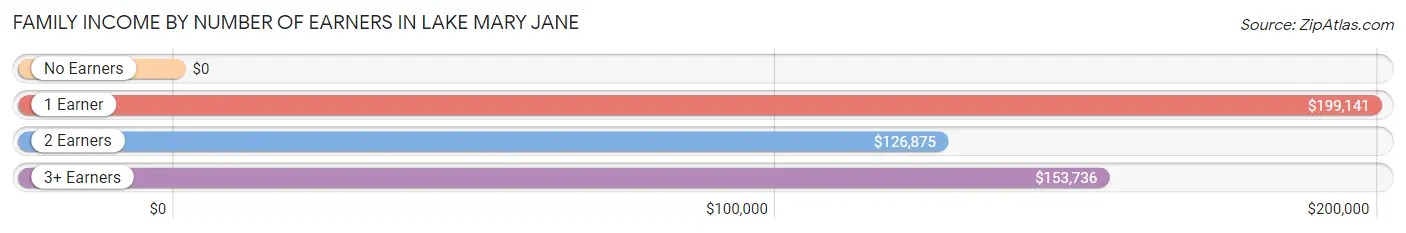
| Number of Earners | # Families | Median Income |
| No Earners | 151 (21.7%) | $0 |
| 1 Earner | 121 (17.4%) | $199,141 |
| 2 Earners | 170 (24.5%) | $126,875 |
| 3+ Earners | 253 (36.4%) | $153,736 |
| Total | 695 (100.0%) | $127,031 |
Household Income in Lake Mary Jane
Household Income Brackets in Lake Mary Jane
With 258 households falling in the category, the $100,000 to $149,999 income range is the most frequent in Lake Mary Jane, accounting for 36.0% of all households.
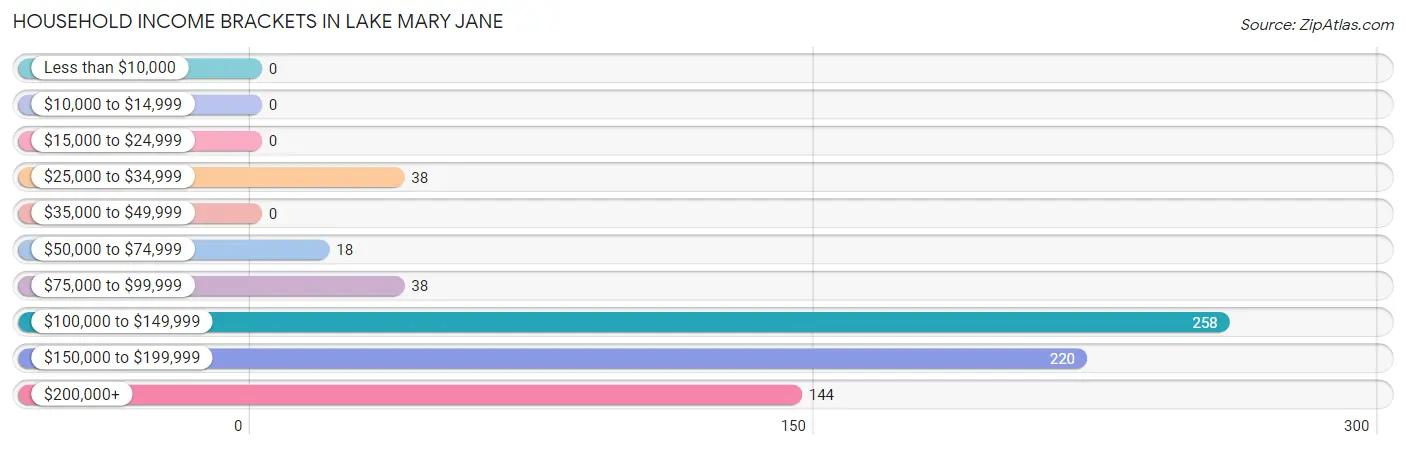
| Income Bracket | # Households | % Households |
| Less than $10,000 | 0 | 0.0% |
| $10,000 to $14,999 | 0 | 0.0% |
| $15,000 to $24,999 | 0 | 0.0% |
| $25,000 to $34,999 | 38 | 5.3% |
| $35,000 to $49,999 | 0 | 0.0% |
| $50,000 to $74,999 | 18 | 2.5% |
| $75,000 to $99,999 | 38 | 5.3% |
| $100,000 to $149,999 | 258 | 36.0% |
| $150,000 to $199,999 | 220 | 30.7% |
| $200,000+ | 144 | 20.1% |
Household Income by Householder Age in Lake Mary Jane
The median household income in Lake Mary Jane is $152,663, with the highest median household income of $157,727 found in the 45 to 64 years age bracket for the primary householder. A total of 498 households (69.6%) fall into this category.
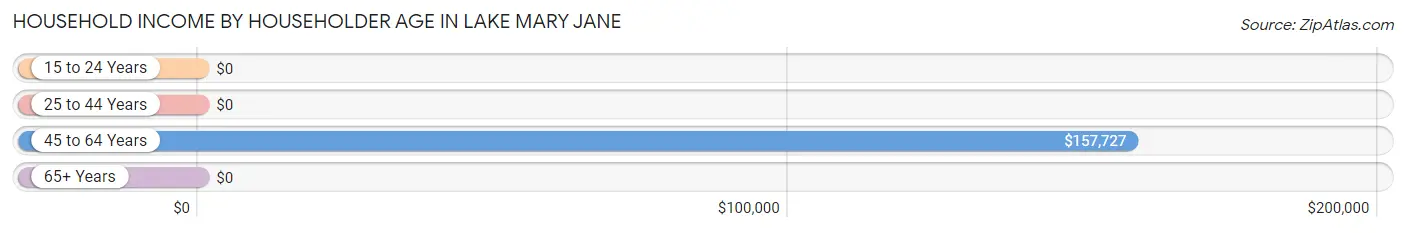
| Income Bracket | # Households | Median Income |
| 15 to 24 Years | 0 (0.0%) | $0 |
| 25 to 44 Years | 67 (9.4%) | $0 |
| 45 to 64 Years | 498 (69.6%) | $157,727 |
| 65+ Years | 151 (21.1%) | $0 |
| Total | 716 (100.0%) | $152,663 |
Poverty in Lake Mary Jane
Income Below Poverty by Sex and Age in Lake Mary Jane
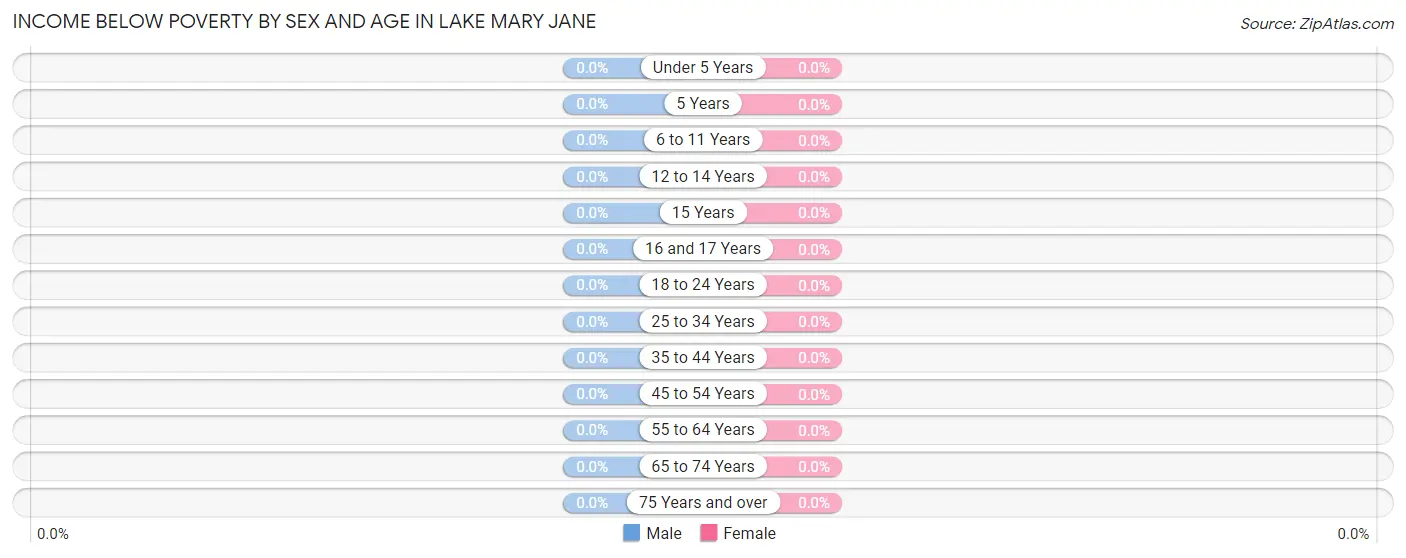
| Age Bracket | Male | Female |
| Under 5 Years | 0 (0.0%) | 0 (0.0%) |
| 5 Years | 0 (0.0%) | 0 (0.0%) |
| 6 to 11 Years | 0 (0.0%) | 0 (0.0%) |
| 12 to 14 Years | 0 (0.0%) | 0 (0.0%) |
| 15 Years | 0 (0.0%) | 0 (0.0%) |
| 16 and 17 Years | 0 (0.0%) | 0 (0.0%) |
| 18 to 24 Years | 0 (0.0%) | 0 (0.0%) |
| 25 to 34 Years | 0 (0.0%) | 0 (0.0%) |
| 35 to 44 Years | 0 (0.0%) | 0 (0.0%) |
| 45 to 54 Years | 0 (0.0%) | 0 (0.0%) |
| 55 to 64 Years | 0 (0.0%) | 0 (0.0%) |
| 65 to 74 Years | 0 (0.0%) | 0 (0.0%) |
| 75 Years and over | 0 (0.0%) | 0 (0.0%) |
| Total | 0 (0.0%) | 0 (0.0%) |
Income Above Poverty by Sex and Age in Lake Mary Jane
According to the poverty statistics in Lake Mary Jane, males aged 5 years and females aged 6 to 11 years are the age groups that are most secure financially, with 100.0% of males and 100.0% of females in these age groups living above the poverty line.
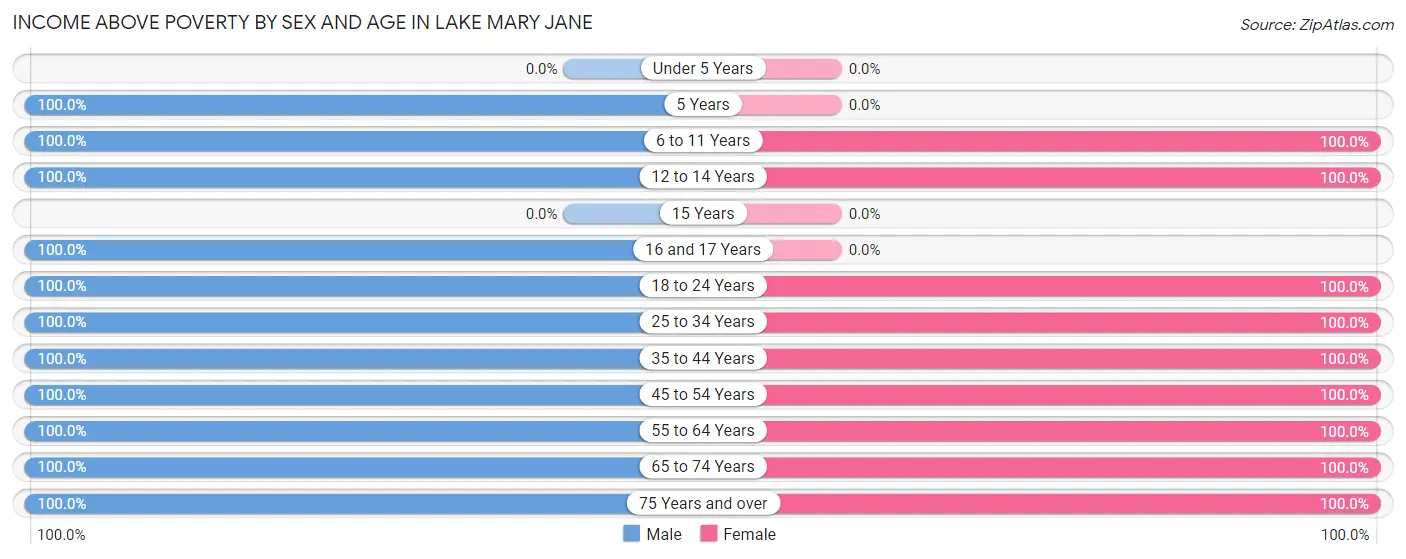
| Age Bracket | Male | Female |
| Under 5 Years | 0 (0.0%) | 0 (0.0%) |
| 5 Years | 22 (100.0%) | 0 (0.0%) |
| 6 to 11 Years | 56 (100.0%) | 78 (100.0%) |
| 12 to 14 Years | 17 (100.0%) | 68 (100.0%) |
| 15 Years | 0 (0.0%) | 0 (0.0%) |
| 16 and 17 Years | 48 (100.0%) | 0 (0.0%) |
| 18 to 24 Years | 185 (100.0%) | 19 (100.0%) |
| 25 to 34 Years | 25 (100.0%) | 93 (100.0%) |
| 35 to 44 Years | 150 (100.0%) | 98 (100.0%) |
| 45 to 54 Years | 173 (100.0%) | 45 (100.0%) |
| 55 to 64 Years | 306 (100.0%) | 335 (100.0%) |
| 65 to 74 Years | 108 (100.0%) | 160 (100.0%) |
| 75 Years and over | 98 (100.0%) | 38 (100.0%) |
| Total | 1,188 (100.0%) | 934 (100.0%) |
Income Below Poverty Among Married-Couple Families in Lake Mary Jane
| Children | Above Poverty | Below Poverty |
| No Children | 485 (100.0%) | 0 (0.0%) |
| 1 or 2 Children | 80 (100.0%) | 0 (0.0%) |
| 3 or 4 Children | 49 (100.0%) | 0 (0.0%) |
| 5 or more Children | 0 (0.0%) | 0 (0.0%) |
| Total | 614 (100.0%) | 0 (0.0%) |
Income Below Poverty Among Single-Parent Households in Lake Mary Jane
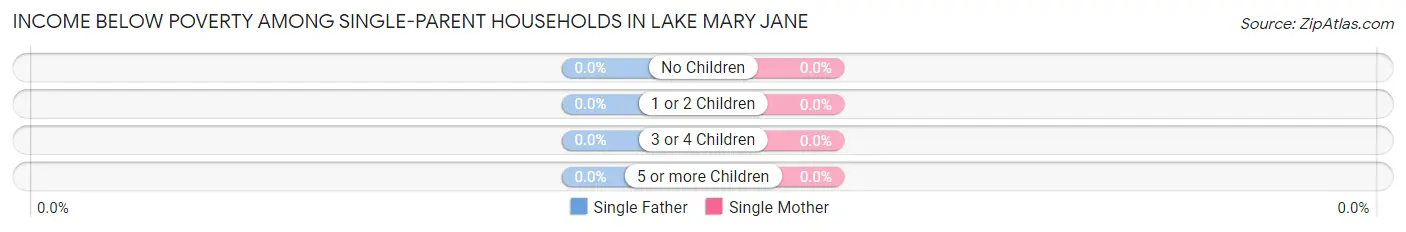
| Children | Single Father | Single Mother |
| No Children | 0 (0.0%) | 0 (0.0%) |
| 1 or 2 Children | 0 (0.0%) | 0 (0.0%) |
| 3 or 4 Children | 0 (0.0%) | 0 (0.0%) |
| 5 or more Children | 0 (0.0%) | 0 (0.0%) |
| Total | 0 (0.0%) | 0 (0.0%) |
Income Below Poverty Among Married-Couple vs Single-Parent Households in Lake Mary Jane
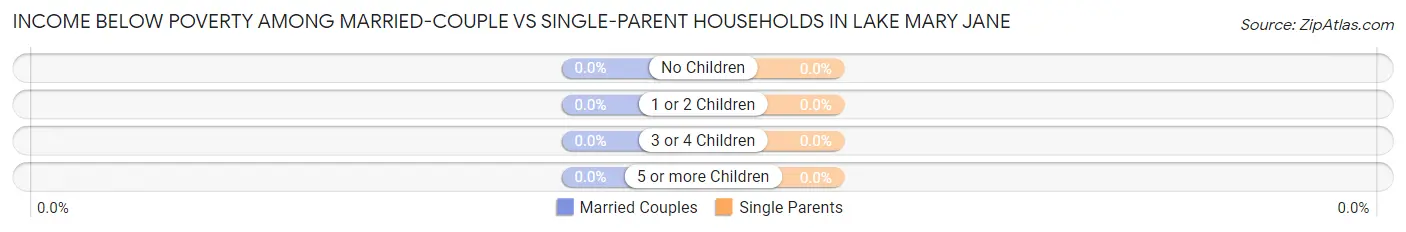
| Children | Married-Couple Families | Single-Parent Households |
| No Children | 0 (0.0%) | 0 (0.0%) |
| 1 or 2 Children | 0 (0.0%) | 0 (0.0%) |
| 3 or 4 Children | 0 (0.0%) | 0 (0.0%) |
| 5 or more Children | 0 (0.0%) | 0 (0.0%) |
| Total | 0 (0.0%) | 0 (0.0%) |
Race in Lake Mary Jane
The most populous races in Lake Mary Jane are White / Caucasian (2,101 | 99.0%), Hispanic or Latino (412 | 19.4%), and Two or more Races (21 | 1.0%).
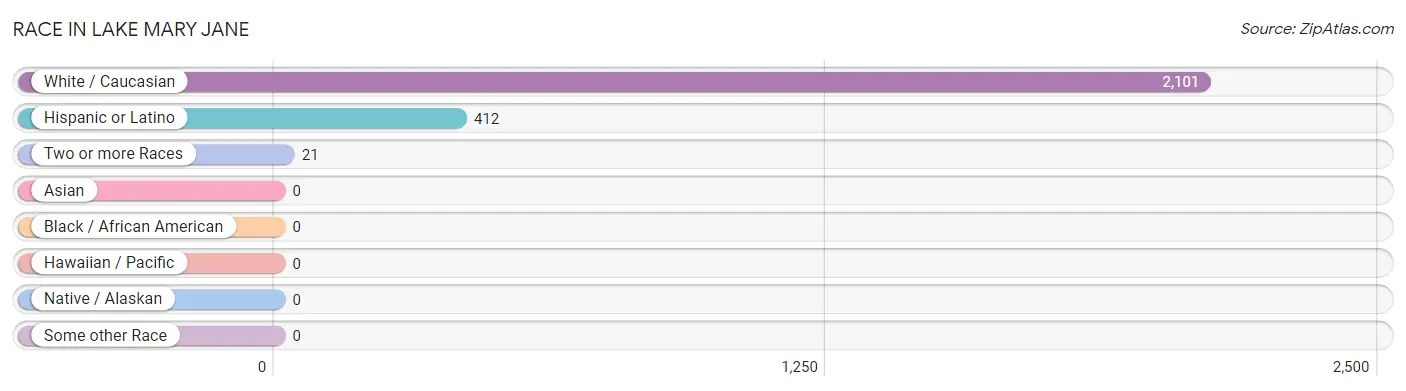
| Race | # Population | % Population |
| Asian | 0 | 0.0% |
| Black / African American | 0 | 0.0% |
| Hawaiian / Pacific | 0 | 0.0% |
| Hispanic or Latino | 412 | 19.4% |
| Native / Alaskan | 0 | 0.0% |
| White / Caucasian | 2,101 | 99.0% |
| Two or more Races | 21 | 1.0% |
| Some other Race | 0 | 0.0% |
| Total | 2,122 | 100.0% |
Ancestry in Lake Mary Jane
The most populous ancestries reported in Lake Mary Jane are German (348 | 16.4%), Puerto Rican (347 | 16.4%), American (334 | 15.7%), Scottish (209 | 9.9%), and Polish (101 | 4.8%), together accounting for 63.1% of all Lake Mary Jane residents.
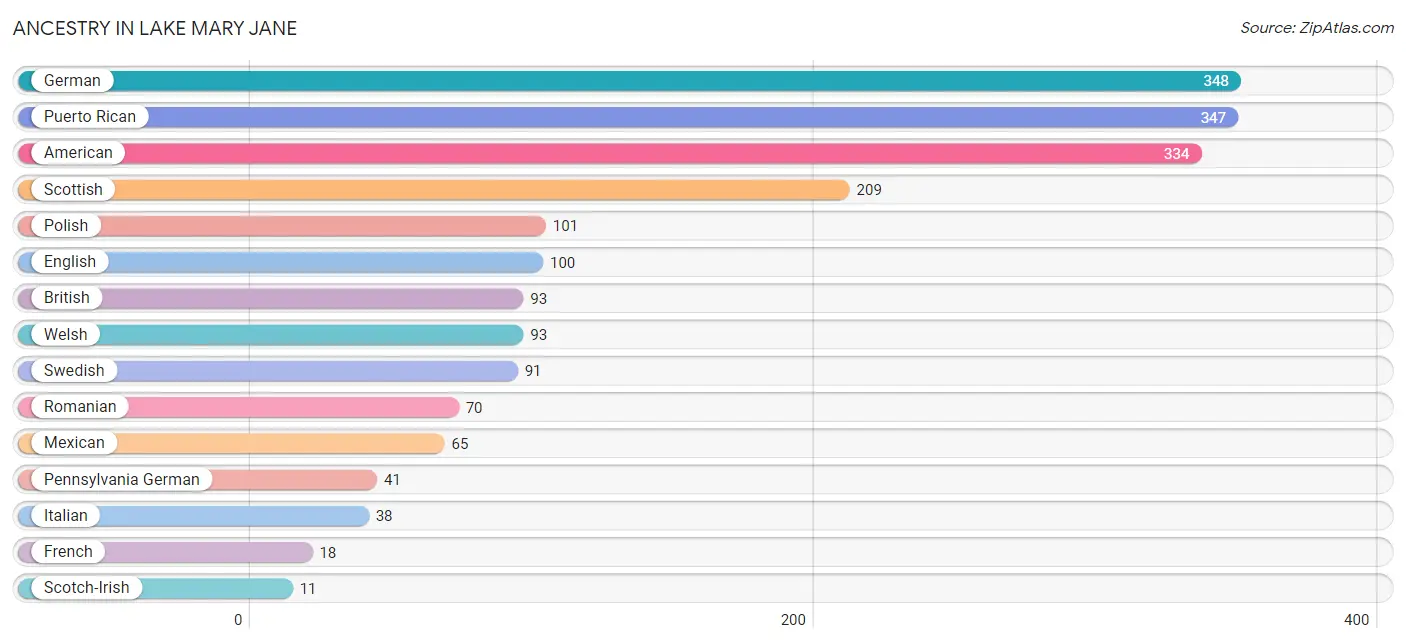
| Ancestry | # Population | % Population |
| American | 334 | 15.7% |
| British | 93 | 4.4% |
| English | 100 | 4.7% |
| French | 18 | 0.9% |
| German | 348 | 16.4% |
| Italian | 38 | 1.8% |
| Mexican | 65 | 3.1% |
| Pennsylvania German | 41 | 1.9% |
| Polish | 101 | 4.8% |
| Puerto Rican | 347 | 16.4% |
| Romanian | 70 | 3.3% |
| Scotch-Irish | 11 | 0.5% |
| Scottish | 209 | 9.9% |
| Swedish | 91 | 4.3% |
| Welsh | 93 | 4.4% | View All 15 Rows |
Immigrants in Lake Mary Jane
The most numerous immigrant groups reported in Lake Mary Jane came from England (35 | 1.7%), Europe (35 | 1.7%), and Northern Europe (35 | 1.7%), together accounting for 5.0% of all Lake Mary Jane residents.
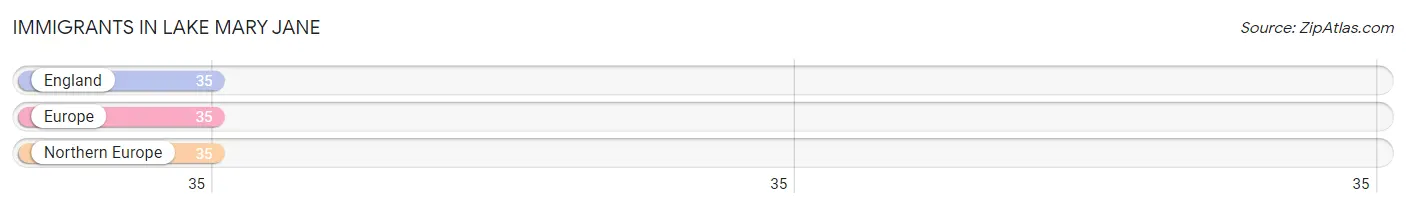
| Immigration Origin | # Population | % Population |
| England | 35 | 1.7% |
| Europe | 35 | 1.7% |
| Northern Europe | 35 | 1.7% | View All 3 Rows |
Sex and Age in Lake Mary Jane
Sex and Age in Lake Mary Jane
The most populous age groups in Lake Mary Jane are 60 to 64 Years (182 | 15.3%) for men and 60 to 64 Years (175 | 18.7%) for women.
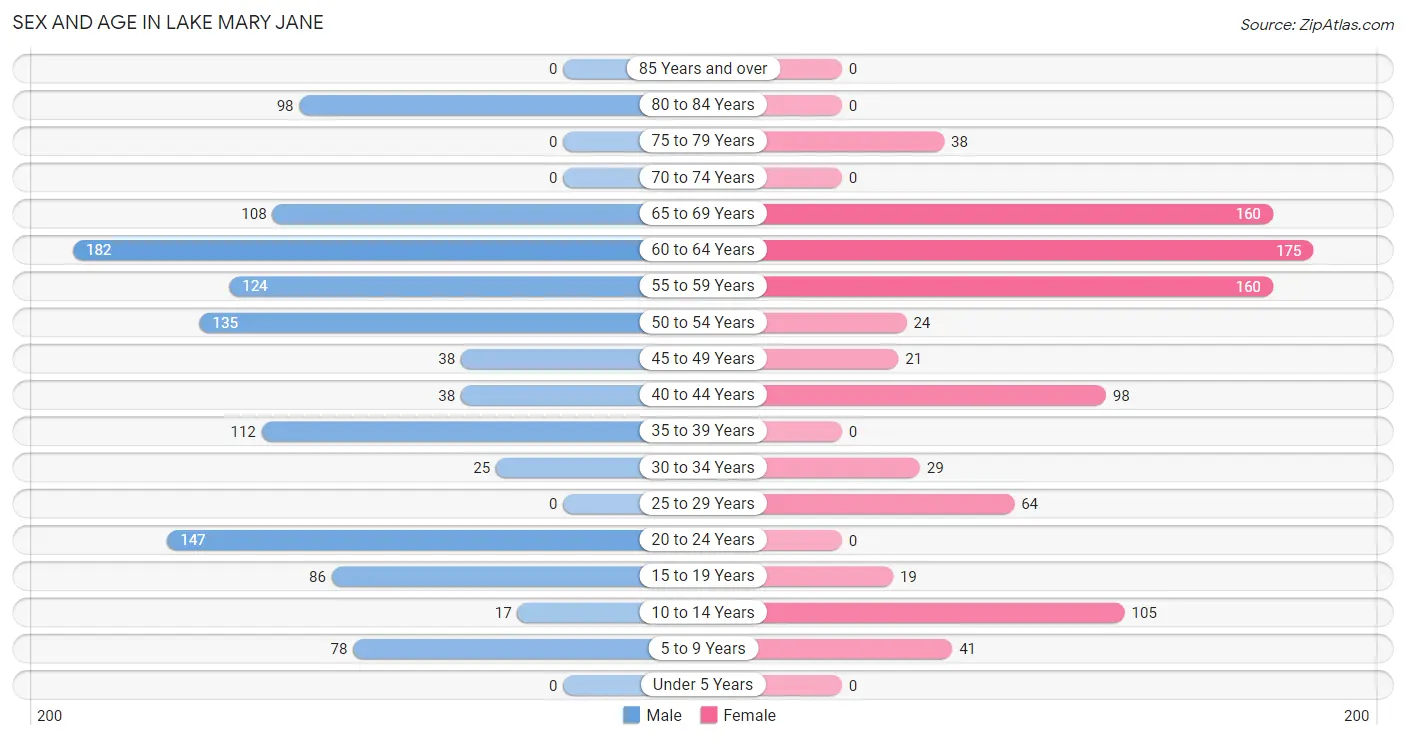
| Age Bracket | Male | Female |
| Under 5 Years | 0 (0.0%) | 0 (0.0%) |
| 5 to 9 Years | 78 (6.6%) | 41 (4.4%) |
| 10 to 14 Years | 17 (1.4%) | 105 (11.2%) |
| 15 to 19 Years | 86 (7.2%) | 19 (2.0%) |
| 20 to 24 Years | 147 (12.4%) | 0 (0.0%) |
| 25 to 29 Years | 0 (0.0%) | 64 (6.9%) |
| 30 to 34 Years | 25 (2.1%) | 29 (3.1%) |
| 35 to 39 Years | 112 (9.4%) | 0 (0.0%) |
| 40 to 44 Years | 38 (3.2%) | 98 (10.5%) |
| 45 to 49 Years | 38 (3.2%) | 21 (2.2%) |
| 50 to 54 Years | 135 (11.4%) | 24 (2.6%) |
| 55 to 59 Years | 124 (10.4%) | 160 (17.1%) |
| 60 to 64 Years | 182 (15.3%) | 175 (18.7%) |
| 65 to 69 Years | 108 (9.1%) | 160 (17.1%) |
| 70 to 74 Years | 0 (0.0%) | 0 (0.0%) |
| 75 to 79 Years | 0 (0.0%) | 38 (4.1%) |
| 80 to 84 Years | 98 (8.3%) | 0 (0.0%) |
| 85 Years and over | 0 (0.0%) | 0 (0.0%) |
| Total | 1,188 (100.0%) | 934 (100.0%) |
Families and Households in Lake Mary Jane
Median Family Size in Lake Mary Jane
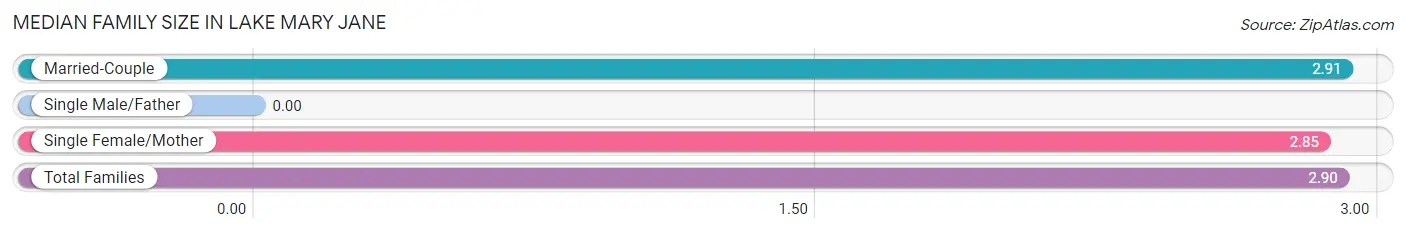
| Family Type | # Families | Family Size |
| Married-Couple | 614 (88.3%) | 2.91 |
| Single Male/Father | 0 (0.0%) | - |
| Single Female/Mother | 81 (11.7%) | 2.85 |
| Total Families | 695 (100.0%) | 2.90 |
Median Household Size in Lake Mary Jane
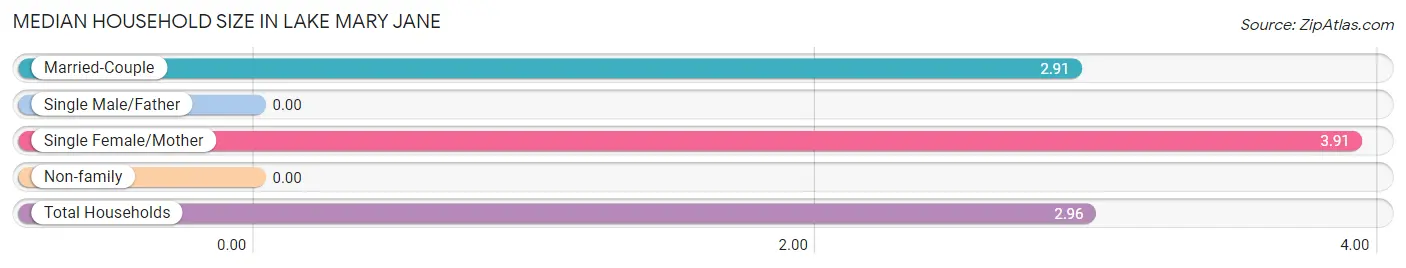
| Household Type | # Households | Household Size |
| Married-Couple | 614 (85.8%) | 2.91 |
| Single Male/Father | 0 (0.0%) | - |
| Single Female/Mother | 81 (11.3%) | 3.91 |
| Non-family | 21 (2.9%) | - |
| Total Households | 716 (100.0%) | 2.96 |
Household Size by Marriage Status in Lake Mary Jane
Out of a total of 716 households in Lake Mary Jane, 695 (97.1%) are family households, while 21 (2.9%) are nonfamily households. The most numerous type of family households are 2-person households, comprising 313, and the most common type of nonfamily households are 1-person households, comprising 21.
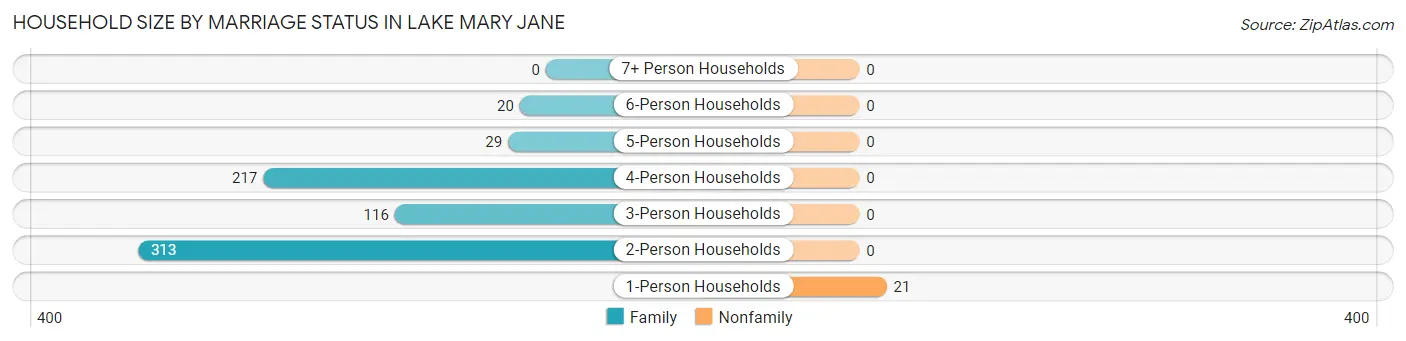
| Household Size | Family Households | Nonfamily Households |
| 1-Person Households | - | 21 (2.9%) |
| 2-Person Households | 313 (43.7%) | 0 (0.0%) |
| 3-Person Households | 116 (16.2%) | 0 (0.0%) |
| 4-Person Households | 217 (30.3%) | 0 (0.0%) |
| 5-Person Households | 29 (4.1%) | 0 (0.0%) |
| 6-Person Households | 20 (2.8%) | 0 (0.0%) |
| 7+ Person Households | 0 (0.0%) | 0 (0.0%) |
| Total | 695 (97.1%) | 21 (2.9%) |
Female Fertility in Lake Mary Jane
Fertility by Age in Lake Mary Jane
| Age Bracket | Women with Births | Births / 1,000 Women |
| 15 to 19 years | 0 (0.0%) | 0.0 |
| 20 to 34 years | 0 (0.0%) | 0.0 |
| 35 to 50 years | 0 (0.0%) | 0.0 |
| Total | 0 (0.0%) | 0.0 |
Fertility by Age by Marriage Status in Lake Mary Jane
| Age Bracket | Married | Unmarried |
| 15 to 19 years | 0 (0.0%) | 0 (0.0%) |
| 20 to 34 years | 0 (0.0%) | 0 (0.0%) |
| 35 to 50 years | 0 (0.0%) | 0 (0.0%) |
| Total | 0 (0.0%) | 0 (0.0%) |
Fertility by Education in Lake Mary Jane
| Educational Attainment | Women with Births | Births / 1,000 Women |
| Less than High School | 0 (0.0%) | 0.0 |
| High School Diploma | 0 (0.0%) | 0.0 |
| College or Associate's Degree | 0 (0.0%) | 0.0 |
| Bachelor's Degree | 0 (0.0%) | 0.0 |
| Graduate Degree | 0 (0.0%) | 0.0 |
| Total | 0 (0.0%) | 0.0 |
Fertility by Education by Marriage Status in Lake Mary Jane
| Educational Attainment | Married | Unmarried |
| Less than High School | 0 (0.0%) | 0 (0.0%) |
| High School Diploma | 0 (0.0%) | 0 (0.0%) |
| College or Associate's Degree | 0 (0.0%) | 0 (0.0%) |
| Bachelor's Degree | 0 (0.0%) | 0 (0.0%) |
| Graduate Degree | 0 (0.0%) | 0 (0.0%) |
| Total | 0 (0.0%) | 0 (0.0%) |
Employment Characteristics in Lake Mary Jane
Employment by Class of Employer in Lake Mary Jane
Among the 1,203 employed individuals in Lake Mary Jane, private company employees (633 | 52.6%), not-for-profit organizations (192 | 16.0%), and self-employed (incorporated) (136 | 11.3%) make up the most common classes of employment.
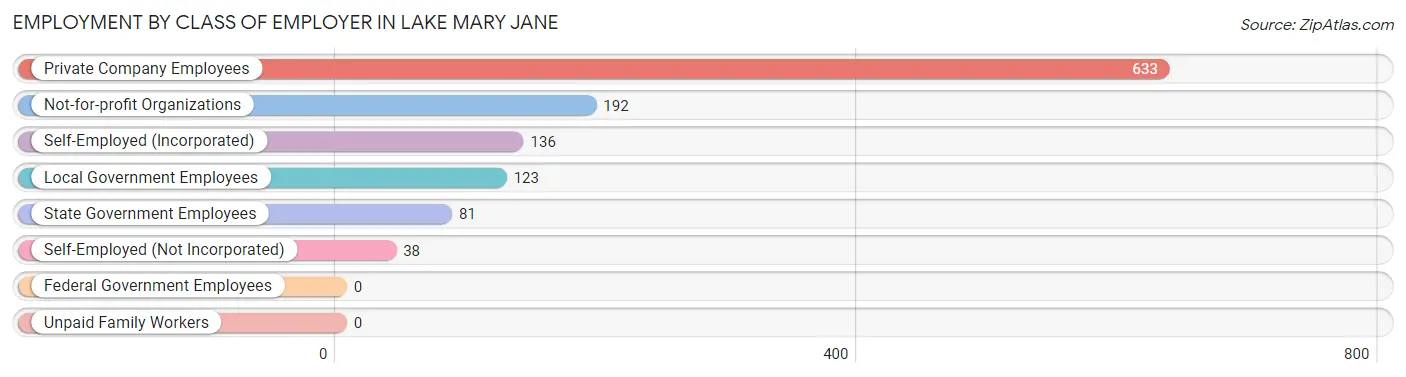
| Employer Class | # Employees | % Employees |
| Private Company Employees | 633 | 52.6% |
| Self-Employed (Incorporated) | 136 | 11.3% |
| Self-Employed (Not Incorporated) | 38 | 3.2% |
| Not-for-profit Organizations | 192 | 16.0% |
| Local Government Employees | 123 | 10.2% |
| State Government Employees | 81 | 6.7% |
| Federal Government Employees | 0 | 0.0% |
| Unpaid Family Workers | 0 | 0.0% |
| Total | 1,203 | 100.0% |
Employment Status by Age in Lake Mary Jane
According to the labor force statistics for Lake Mary Jane, out of the total population over 16 years of age (1,881), 66.0% or 1,241 individuals are in the labor force, with 3.1% or 38 of them unemployed. The age group with the highest labor force participation rate is 25 to 29 years, with 100.0% or 64 individuals in the labor force. Within the labor force, the 16 to 19 years age range has the highest percentage of unemployed individuals, with 66.7% or 38 of them being unemployed.
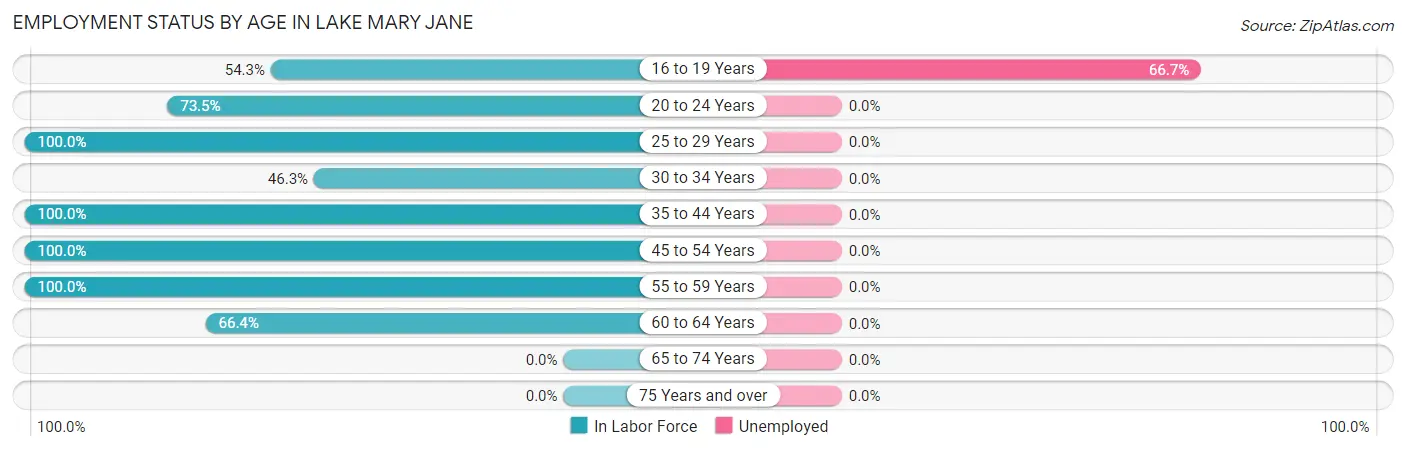
| Age Bracket | In Labor Force | Unemployed |
| 16 to 19 Years | 57 (54.3%) | 38 (66.7%) |
| 20 to 24 Years | 108 (73.5%) | 0 (0.0%) |
| 25 to 29 Years | 64 (100.0%) | 0 (0.0%) |
| 30 to 34 Years | 25 (46.3%) | 0 (0.0%) |
| 35 to 44 Years | 248 (100.0%) | 0 (0.0%) |
| 45 to 54 Years | 218 (100.0%) | 0 (0.0%) |
| 55 to 59 Years | 284 (100.0%) | 0 (0.0%) |
| 60 to 64 Years | 237 (66.4%) | 0 (0.0%) |
| 65 to 74 Years | 0 (0.0%) | 0 (0.0%) |
| 75 Years and over | 0 (0.0%) | 0 (0.0%) |
| Total | 1,241 (66.0%) | 38 (3.1%) |
Employment Status by Educational Attainment in Lake Mary Jane
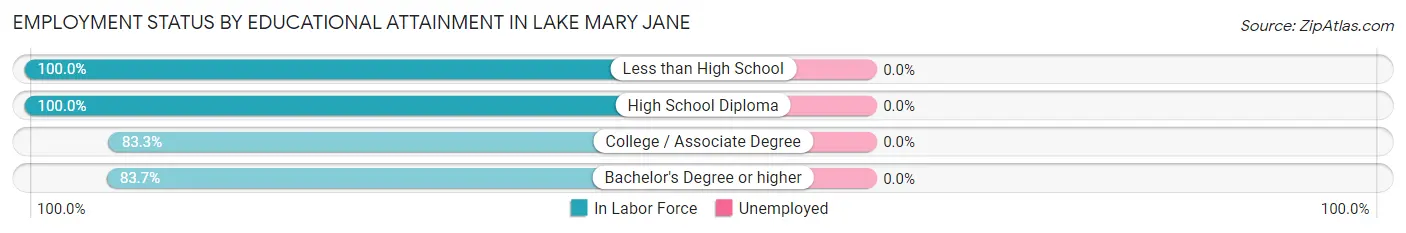
| Educational Attainment | In Labor Force | Unemployed |
| Less than High School | 92 (100.0%) | 0 (0.0%) |
| High School Diploma | 231 (100.0%) | 0 (0.0%) |
| College / Associate Degree | 413 (83.3%) | 0 (0.0%) |
| Bachelor's Degree or higher | 340 (83.7%) | 0 (0.0%) |
| Total | 1,076 (87.8%) | 0 (0.0%) |
Employment Occupations by Sex in Lake Mary Jane
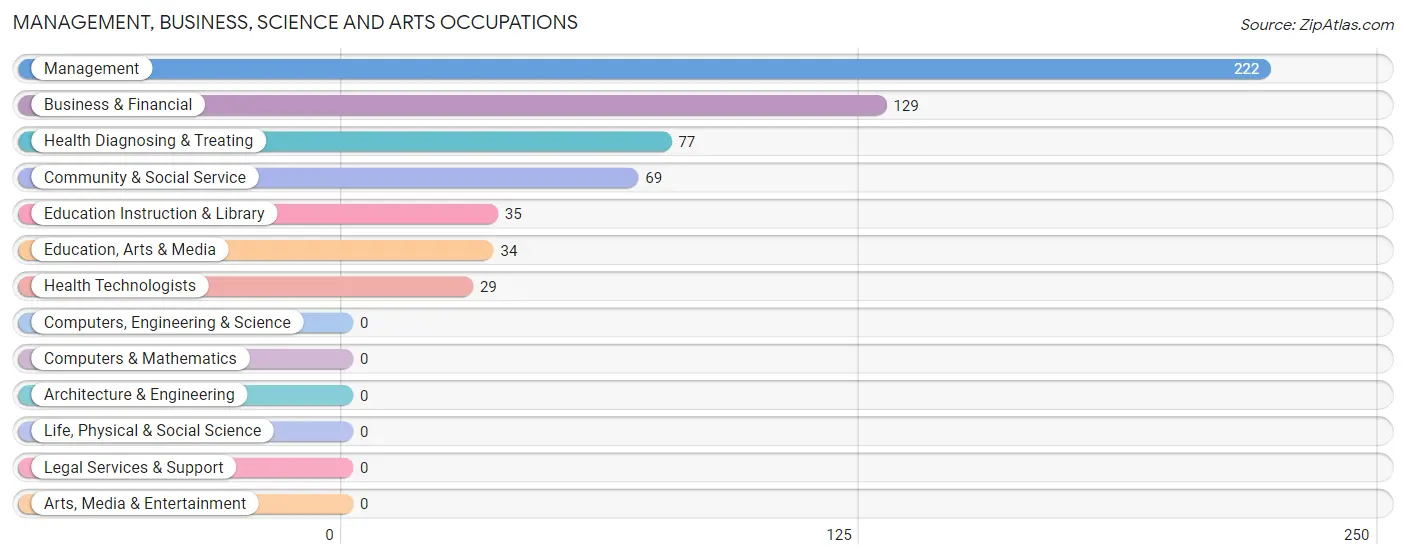
Management, Business, Science and Arts Occupations
The most common Management, Business, Science and Arts occupations in Lake Mary Jane are Management (222 | 18.4%), Business & Financial (129 | 10.7%), Health Diagnosing & Treating (77 | 6.4%), Community & Social Service (69 | 5.7%), and Education Instruction & Library (35 | 2.9%).
Management, Business, Science and Arts Occupations by Sex
Within the Management, Business, Science and Arts occupations in Lake Mary Jane, the most male-oriented occupations are Business & Financial (81.4%), Health Diagnosing & Treating (76.6%), and Education Instruction & Library (68.6%), while the most female-oriented occupations are Health Technologists (62.1%), Management (54.0%), and Education, Arts & Media (47.1%).
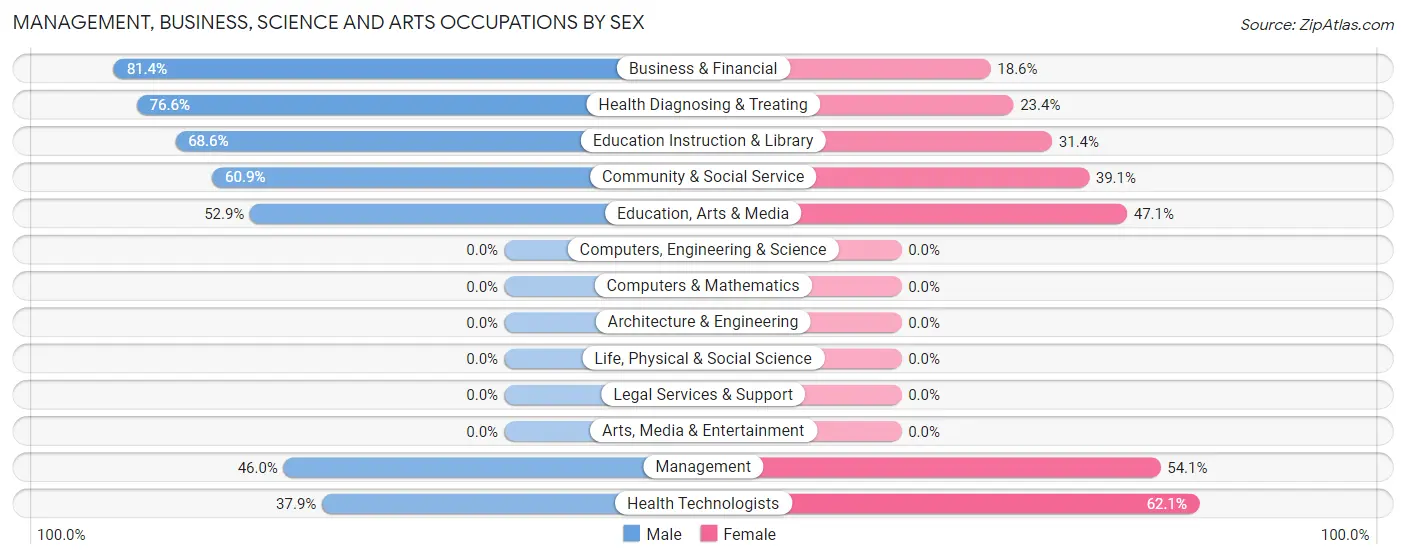
| Occupation | Male | Female |
| Management | 102 (46.0%) | 120 (54.0%) |
| Business & Financial | 105 (81.4%) | 24 (18.6%) |
| Computers, Engineering & Science | 0 (0.0%) | 0 (0.0%) |
| Computers & Mathematics | 0 (0.0%) | 0 (0.0%) |
| Architecture & Engineering | 0 (0.0%) | 0 (0.0%) |
| Life, Physical & Social Science | 0 (0.0%) | 0 (0.0%) |
| Community & Social Service | 42 (60.9%) | 27 (39.1%) |
| Education, Arts & Media | 18 (52.9%) | 16 (47.1%) |
| Legal Services & Support | 0 (0.0%) | 0 (0.0%) |
| Education Instruction & Library | 24 (68.6%) | 11 (31.4%) |
| Arts, Media & Entertainment | 0 (0.0%) | 0 (0.0%) |
| Health Diagnosing & Treating | 59 (76.6%) | 18 (23.4%) |
| Health Technologists | 11 (37.9%) | 18 (62.1%) |
| Total (Category) | 308 (62.0%) | 189 (38.0%) |
| Total (Overall) | 725 (60.3%) | 478 (39.7%) |
Services Occupations
Services Occupations by Sex
| Occupation | Male | Female |
| Healthcare Support | 0 (0.0%) | 0 (0.0%) |
| Security & Protection | 0 (0.0%) | 0 (0.0%) |
| Firefighting & Prevention | 0 (0.0%) | 0 (0.0%) |
| Law Enforcement | 0 (0.0%) | 0 (0.0%) |
| Food Preparation & Serving | 0 (0.0%) | 0 (0.0%) |
| Cleaning & Maintenance | 0 (0.0%) | 0 (0.0%) |
| Personal Care & Service | 0 (0.0%) | 0 (0.0%) |
| Total (Category) | 0 (0.0%) | 0 (0.0%) |
| Total (Overall) | 725 (60.3%) | 478 (39.7%) |
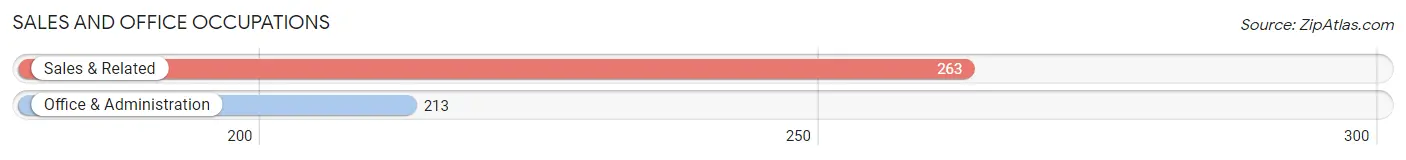
Sales and Office Occupations
The most common Sales and Office occupations in Lake Mary Jane are Sales & Related (263 | 21.9%), and Office & Administration (213 | 17.7%).
Sales and Office Occupations by Sex
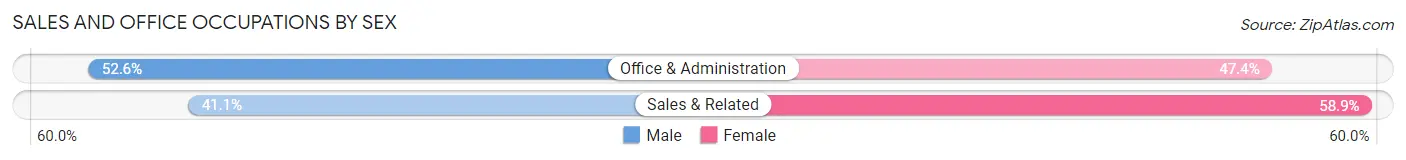
| Occupation | Male | Female |
| Sales & Related | 108 (41.1%) | 155 (58.9%) |
| Office & Administration | 112 (52.6%) | 101 (47.4%) |
| Total (Category) | 220 (46.2%) | 256 (53.8%) |
| Total (Overall) | 725 (60.3%) | 478 (39.7%) |
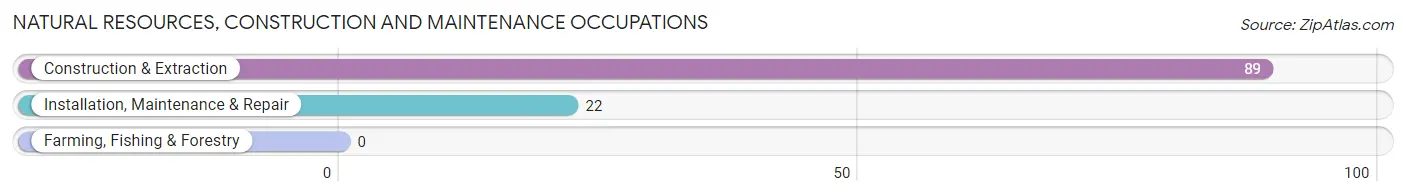
Natural Resources, Construction and Maintenance Occupations
The most common Natural Resources, Construction and Maintenance occupations in Lake Mary Jane are Construction & Extraction (89 | 7.4%), and Installation, Maintenance & Repair (22 | 1.8%).
Natural Resources, Construction and Maintenance Occupations by Sex
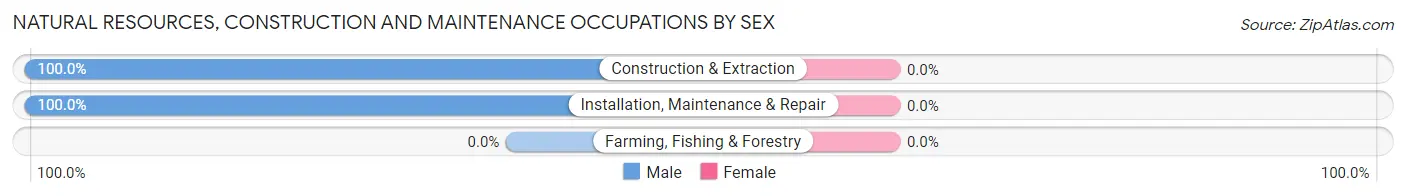
| Occupation | Male | Female |
| Farming, Fishing & Forestry | 0 (0.0%) | 0 (0.0%) |
| Construction & Extraction | 89 (100.0%) | 0 (0.0%) |
| Installation, Maintenance & Repair | 22 (100.0%) | 0 (0.0%) |
| Total (Category) | 111 (100.0%) | 0 (0.0%) |
| Total (Overall) | 725 (60.3%) | 478 (39.7%) |
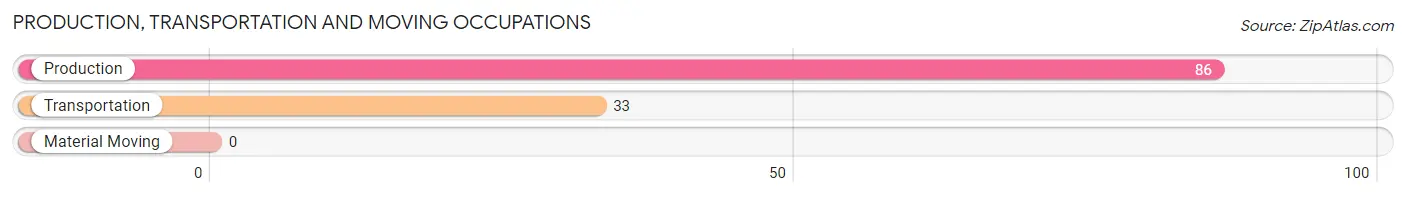
Production, Transportation and Moving Occupations
The most common Production, Transportation and Moving occupations in Lake Mary Jane are Production (86 | 7.1%), and Transportation (33 | 2.7%).
Production, Transportation and Moving Occupations by Sex
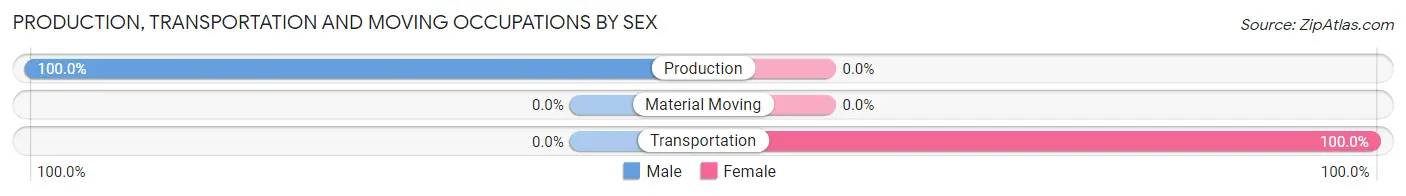
| Occupation | Male | Female |
| Production | 86 (100.0%) | 0 (0.0%) |
| Transportation | 0 (0.0%) | 33 (100.0%) |
| Material Moving | 0 (0.0%) | 0 (0.0%) |
| Total (Category) | 86 (72.3%) | 33 (27.7%) |
| Total (Overall) | 725 (60.3%) | 478 (39.7%) |
Employment Industries by Sex in Lake Mary Jane
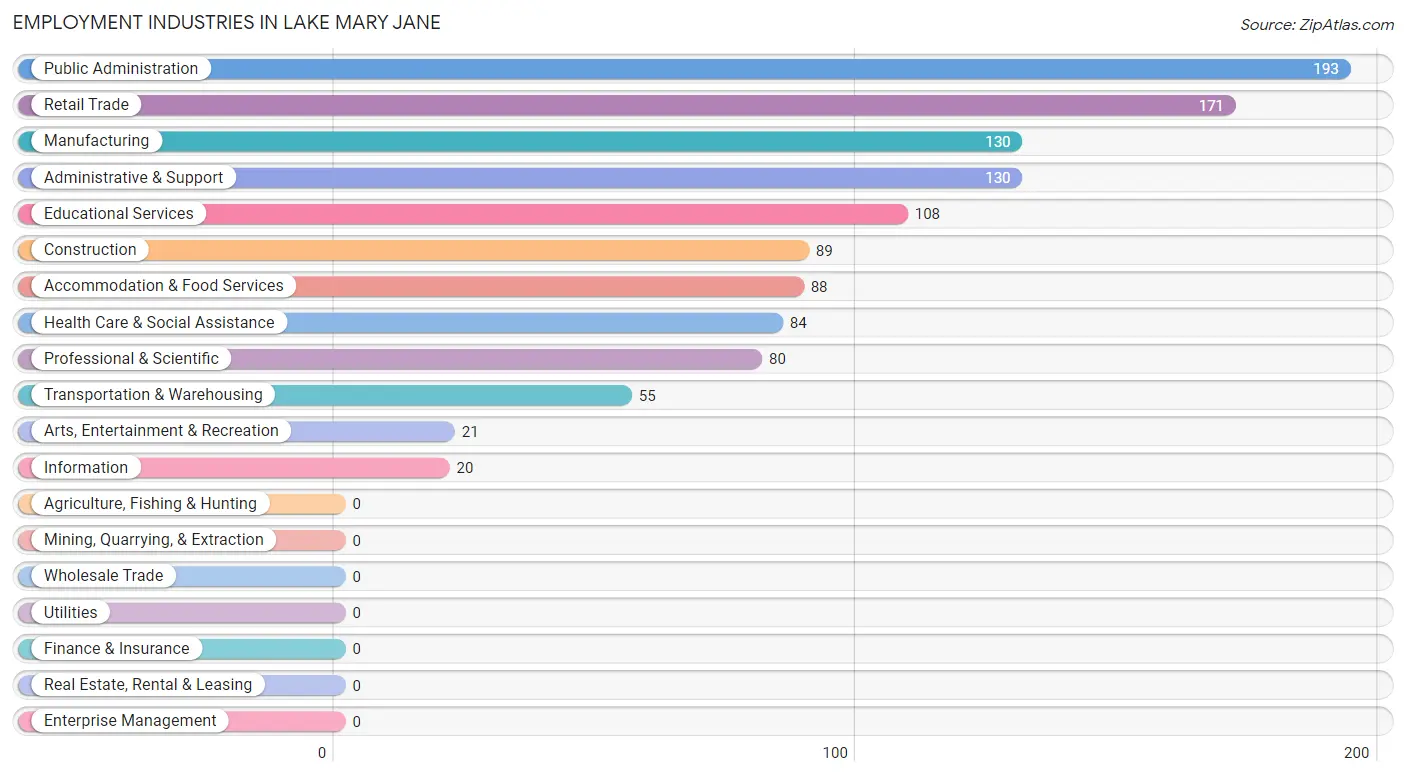
Employment Industries in Lake Mary Jane
The major employment industries in Lake Mary Jane include Public Administration (193 | 16.0%), Retail Trade (171 | 14.2%), Manufacturing (130 | 10.8%), Administrative & Support (130 | 10.8%), and Educational Services (108 | 9.0%).
Employment Industries by Sex in Lake Mary Jane
The Lake Mary Jane industries that see more men than women are Construction (100.0%), Manufacturing (100.0%), and Information (100.0%), whereas the industries that tend to have a higher number of women are Arts, Entertainment & Recreation (100.0%), Accommodation & Food Services (100.0%), and Health Care & Social Assistance (86.9%).
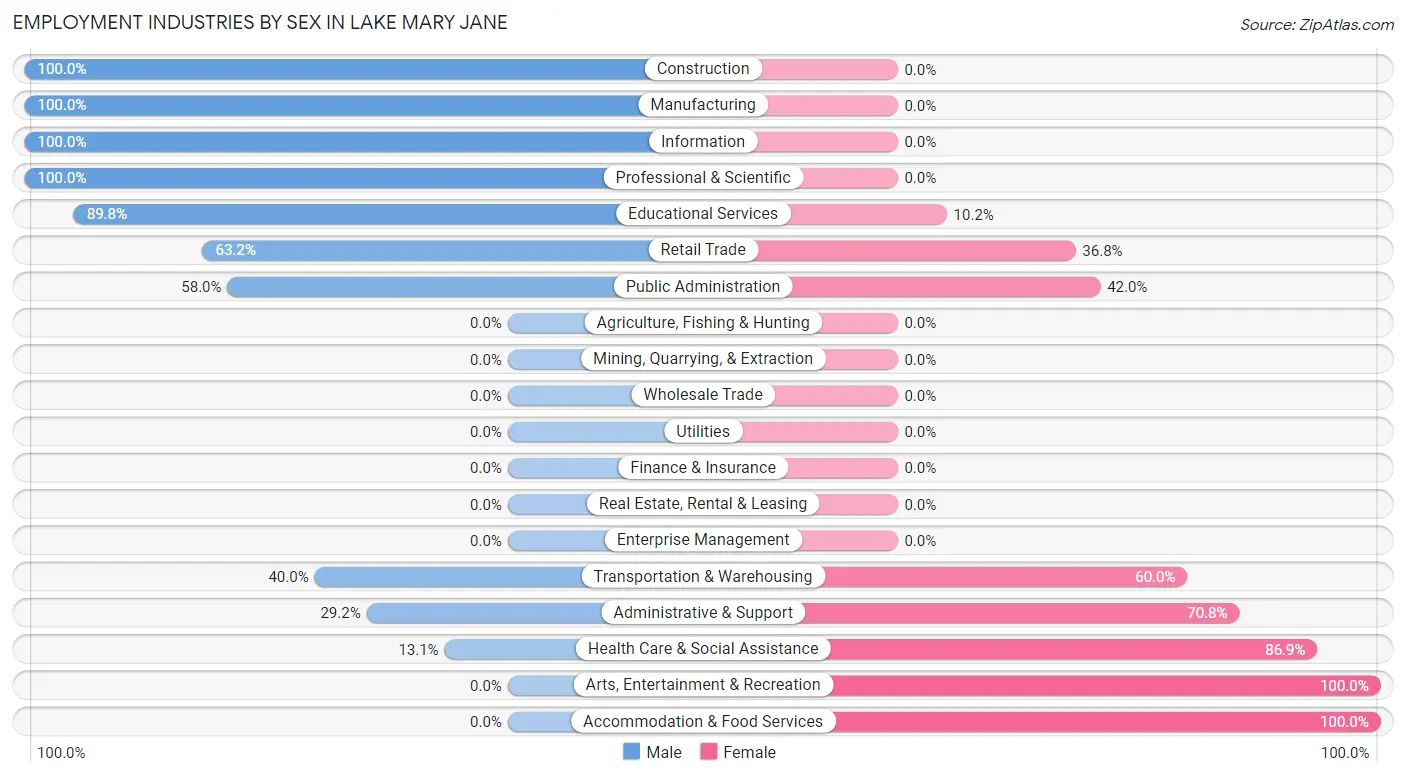
| Industry | Male | Female |
| Agriculture, Fishing & Hunting | 0 (0.0%) | 0 (0.0%) |
| Mining, Quarrying, & Extraction | 0 (0.0%) | 0 (0.0%) |
| Construction | 89 (100.0%) | 0 (0.0%) |
| Manufacturing | 130 (100.0%) | 0 (0.0%) |
| Wholesale Trade | 0 (0.0%) | 0 (0.0%) |
| Retail Trade | 108 (63.2%) | 63 (36.8%) |
| Transportation & Warehousing | 22 (40.0%) | 33 (60.0%) |
| Utilities | 0 (0.0%) | 0 (0.0%) |
| Information | 20 (100.0%) | 0 (0.0%) |
| Finance & Insurance | 0 (0.0%) | 0 (0.0%) |
| Real Estate, Rental & Leasing | 0 (0.0%) | 0 (0.0%) |
| Professional & Scientific | 80 (100.0%) | 0 (0.0%) |
| Enterprise Management | 0 (0.0%) | 0 (0.0%) |
| Administrative & Support | 38 (29.2%) | 92 (70.8%) |
| Educational Services | 97 (89.8%) | 11 (10.2%) |
| Health Care & Social Assistance | 11 (13.1%) | 73 (86.9%) |
| Arts, Entertainment & Recreation | 0 (0.0%) | 21 (100.0%) |
| Accommodation & Food Services | 0 (0.0%) | 88 (100.0%) |
| Public Administration | 112 (58.0%) | 81 (42.0%) |
| Total | 725 (60.3%) | 478 (39.7%) |
Education in Lake Mary Jane
School Enrollment in Lake Mary Jane
The most common levels of schooling among the 455 students in Lake Mary Jane are college / undergraduate (195 | 42.9%), middle school (122 | 26.8%), and elementary school (97 | 21.3%).
| School Level | # Students | % Students |
| Nursery / Preschool | 0 | 0.0% |
| Kindergarten | 22 | 4.8% |
| Elementary School | 97 | 21.3% |
| Middle School | 122 | 26.8% |
| High School | 19 | 4.2% |
| College / Undergraduate | 195 | 42.9% |
| Graduate / Professional | 0 | 0.0% |
| Total | 455 | 100.0% |
School Enrollment by Age by Funding Source in Lake Mary Jane
Out of a total of 455 students who are enrolled in schools in Lake Mary Jane, 102 (22.4%) attend a private institution, while the remaining 353 (77.6%) are enrolled in public schools. The age group of 5 to 9 year old has the highest likelihood of being enrolled in private schools, with 85 (71.4% in the age bracket) enrolled. Conversely, the age group of 15 to 17 year olds has the lowest likelihood of being enrolled in a private school, with 48 (100.0% in the age bracket) attending a public institution.
| Age Bracket | Public School | Private School |
| 3 to 4 Year Olds | 0 (0.0%) | 0 (0.0%) |
| 5 to 9 Year Old | 34 (28.6%) | 85 (71.4%) |
| 10 to 14 Year Olds | 105 (86.1%) | 17 (13.9%) |
| 15 to 17 Year Olds | 48 (100.0%) | 0 (0.0%) |
| 18 to 19 Year Olds | 19 (100.0%) | 0 (0.0%) |
| 20 to 24 Year Olds | 147 (100.0%) | 0 (0.0%) |
| 25 to 34 Year Olds | 0 (0.0%) | 0 (0.0%) |
| 35 Years and over | 0 (0.0%) | 0 (0.0%) |
| Total | 353 (77.6%) | 102 (22.4%) |
Educational Attainment by Field of Study in Lake Mary Jane
Business (180 | 37.2%), engineering (64 | 13.2%), education (47 | 9.7%), science & technology (46 | 9.5%), and liberal arts & history (36 | 7.4%) are the most common fields of study among 484 individuals in Lake Mary Jane who have obtained a bachelor's degree or higher.
| Field of Study | # Graduates | % Graduates |
| Computers & Mathematics | 24 | 5.0% |
| Bio, Nature & Agricultural | 0 | 0.0% |
| Physical & Health Sciences | 18 | 3.7% |
| Psychology | 0 | 0.0% |
| Social Sciences | 16 | 3.3% |
| Engineering | 64 | 13.2% |
| Multidisciplinary Studies | 29 | 6.0% |
| Science & Technology | 46 | 9.5% |
| Business | 180 | 37.2% |
| Education | 47 | 9.7% |
| Literature & Languages | 0 | 0.0% |
| Liberal Arts & History | 36 | 7.4% |
| Visual & Performing Arts | 0 | 0.0% |
| Communications | 24 | 5.0% |
| Arts & Humanities | 0 | 0.0% |
| Total | 484 | 100.0% |
Transportation & Commute in Lake Mary Jane
Vehicle Availability by Sex in Lake Mary Jane
The most prevalent vehicle ownership categories in Lake Mary Jane are males with 3 vehicles (510, accounting for 70.3%) and females with 3 vehicles (257, making up 106.7%).
| Vehicles Available | Male | Female |
| No Vehicle | 0 (0.0%) | 0 (0.0%) |
| 1 Vehicle | 0 (0.0%) | 21 (4.4%) |
| 2 Vehicles | 136 (18.8%) | 148 (31.0%) |
| 3 Vehicles | 510 (70.3%) | 257 (53.8%) |
| 4 Vehicles | 79 (10.9%) | 52 (10.9%) |
| 5 or more Vehicles | 0 (0.0%) | 0 (0.0%) |
| Total | 725 (100.0%) | 478 (100.0%) |
Commute Time in Lake Mary Jane
The most frequently occuring commute durations in Lake Mary Jane are 45 to 59 minutes (347 commuters, 29.3%), 40 to 44 minutes (301 commuters, 25.4%), and 10 to 14 minutes (185 commuters, 15.6%).
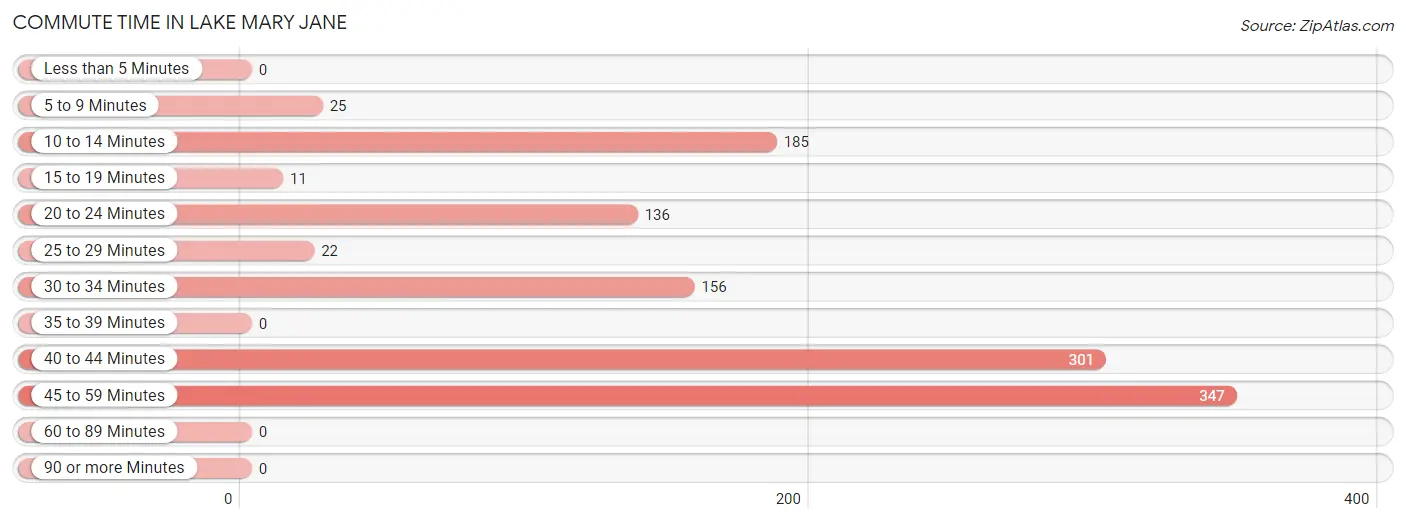
| Commute Time | # Commuters | % Commuters |
| Less than 5 Minutes | 0 | 0.0% |
| 5 to 9 Minutes | 25 | 2.1% |
| 10 to 14 Minutes | 185 | 15.6% |
| 15 to 19 Minutes | 11 | 0.9% |
| 20 to 24 Minutes | 136 | 11.5% |
| 25 to 29 Minutes | 22 | 1.9% |
| 30 to 34 Minutes | 156 | 13.2% |
| 35 to 39 Minutes | 0 | 0.0% |
| 40 to 44 Minutes | 301 | 25.4% |
| 45 to 59 Minutes | 347 | 29.3% |
| 60 to 89 Minutes | 0 | 0.0% |
| 90 or more Minutes | 0 | 0.0% |
Commute Time by Sex in Lake Mary Jane
The most common commute times in Lake Mary Jane are 45 to 59 minutes (347 commuters, 49.2%) for males and 30 to 34 minutes (156 commuters, 32.6%) for females.
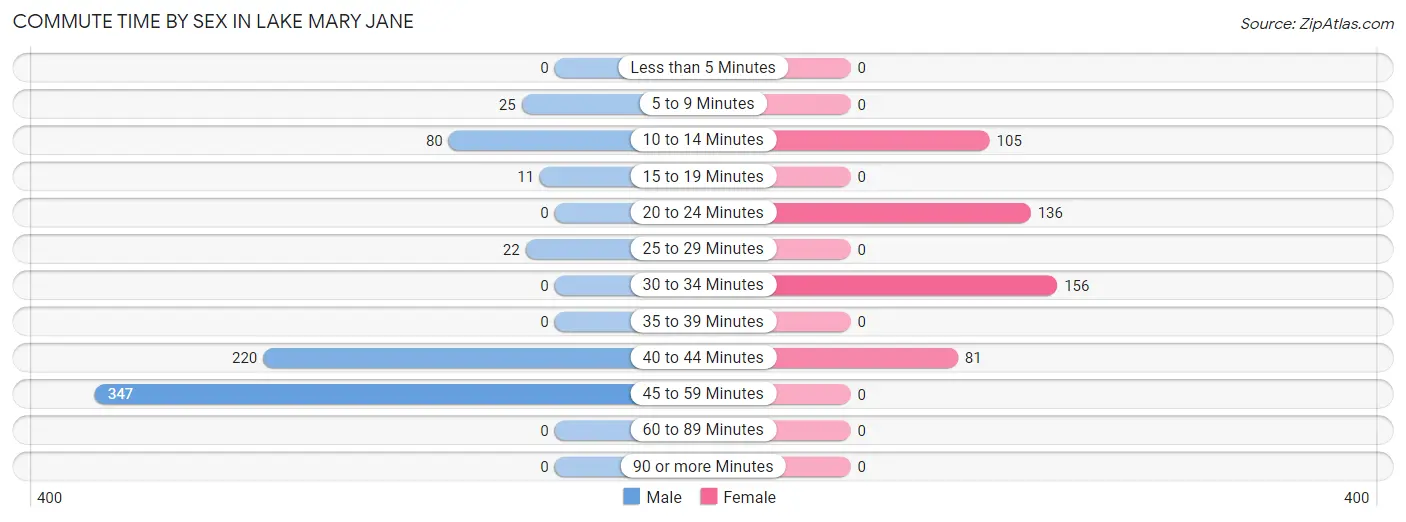
| Commute Time | Male | Female |
| Less than 5 Minutes | 0 (0.0%) | 0 (0.0%) |
| 5 to 9 Minutes | 25 (3.5%) | 0 (0.0%) |
| 10 to 14 Minutes | 80 (11.4%) | 105 (22.0%) |
| 15 to 19 Minutes | 11 (1.6%) | 0 (0.0%) |
| 20 to 24 Minutes | 0 (0.0%) | 136 (28.4%) |
| 25 to 29 Minutes | 22 (3.1%) | 0 (0.0%) |
| 30 to 34 Minutes | 0 (0.0%) | 156 (32.6%) |
| 35 to 39 Minutes | 0 (0.0%) | 0 (0.0%) |
| 40 to 44 Minutes | 220 (31.2%) | 81 (17.0%) |
| 45 to 59 Minutes | 347 (49.2%) | 0 (0.0%) |
| 60 to 89 Minutes | 0 (0.0%) | 0 (0.0%) |
| 90 or more Minutes | 0 (0.0%) | 0 (0.0%) |
Time of Departure to Work by Sex in Lake Mary Jane
The most frequent times of departure to work in Lake Mary Jane are 7:00 AM to 7:29 AM (277, 39.3%) for males and 7:00 AM to 7:29 AM (92, 19.3%) for females.
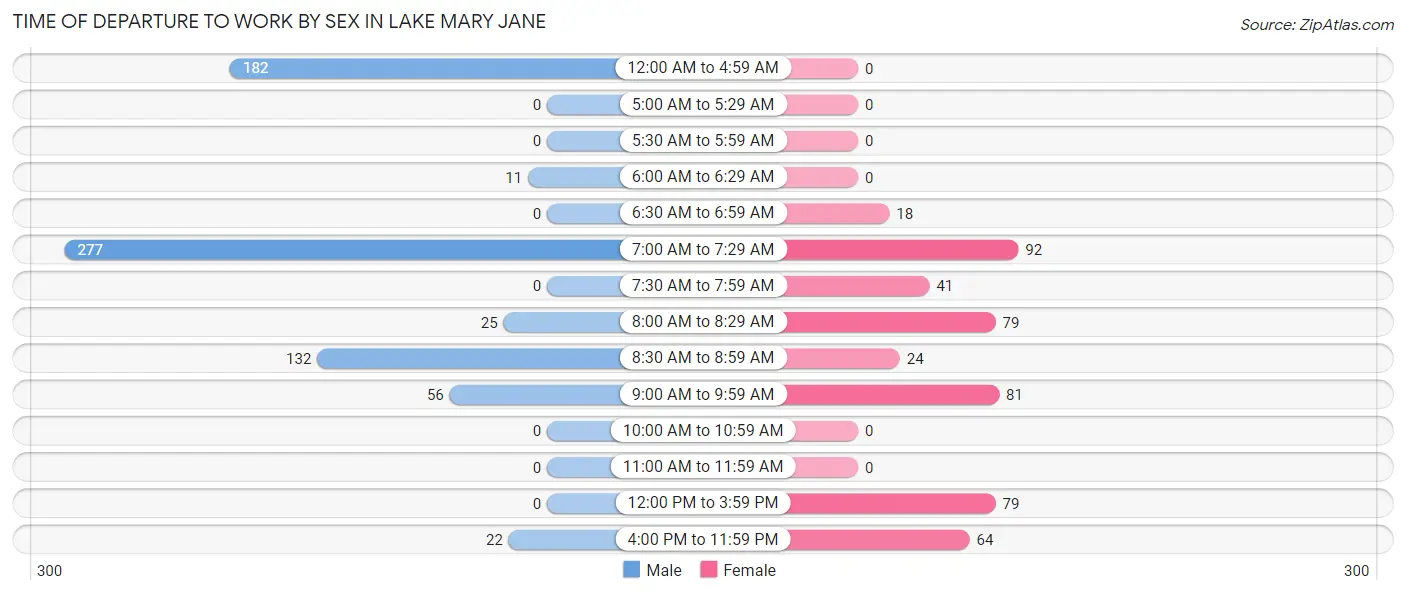
| Time of Departure | Male | Female |
| 12:00 AM to 4:59 AM | 182 (25.8%) | 0 (0.0%) |
| 5:00 AM to 5:29 AM | 0 (0.0%) | 0 (0.0%) |
| 5:30 AM to 5:59 AM | 0 (0.0%) | 0 (0.0%) |
| 6:00 AM to 6:29 AM | 11 (1.6%) | 0 (0.0%) |
| 6:30 AM to 6:59 AM | 0 (0.0%) | 18 (3.8%) |
| 7:00 AM to 7:29 AM | 277 (39.3%) | 92 (19.3%) |
| 7:30 AM to 7:59 AM | 0 (0.0%) | 41 (8.6%) |
| 8:00 AM to 8:29 AM | 25 (3.5%) | 79 (16.5%) |
| 8:30 AM to 8:59 AM | 132 (18.7%) | 24 (5.0%) |
| 9:00 AM to 9:59 AM | 56 (7.9%) | 81 (17.0%) |
| 10:00 AM to 10:59 AM | 0 (0.0%) | 0 (0.0%) |
| 11:00 AM to 11:59 AM | 0 (0.0%) | 0 (0.0%) |
| 12:00 PM to 3:59 PM | 0 (0.0%) | 79 (16.5%) |
| 4:00 PM to 11:59 PM | 22 (3.1%) | 64 (13.4%) |
| Total | 705 (100.0%) | 478 (100.0%) |
Housing Occupancy in Lake Mary Jane
Occupancy by Ownership in Lake Mary Jane
Of the total 716 dwellings in Lake Mary Jane, owner-occupied units account for 695 (97.1%), while renter-occupied units make up 21 (2.9%).
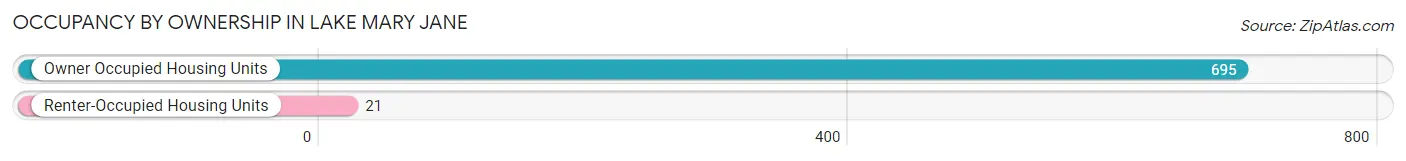
| Occupancy | # Housing Units | % Housing Units |
| Owner Occupied Housing Units | 695 | 97.1% |
| Renter-Occupied Housing Units | 21 | 2.9% |
| Total Occupied Housing Units | 716 | 100.0% |
Occupancy by Household Size in Lake Mary Jane
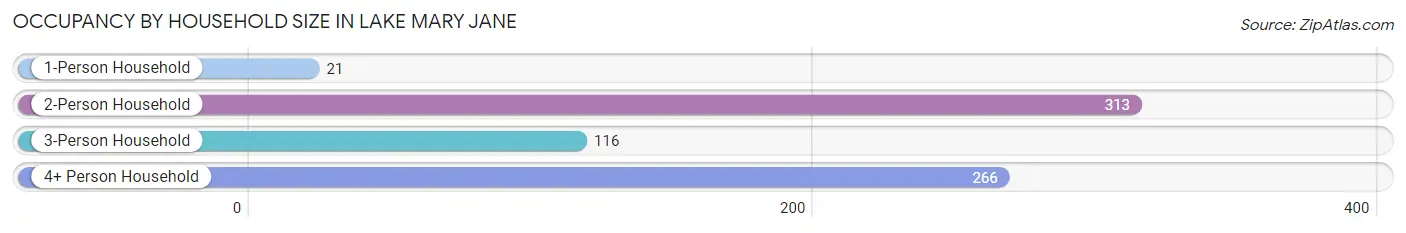
| Household Size | # Housing Units | % Housing Units |
| 1-Person Household | 21 | 2.9% |
| 2-Person Household | 313 | 43.7% |
| 3-Person Household | 116 | 16.2% |
| 4+ Person Household | 266 | 37.1% |
| Total Housing Units | 716 | 100.0% |
Occupancy by Ownership by Household Size in Lake Mary Jane
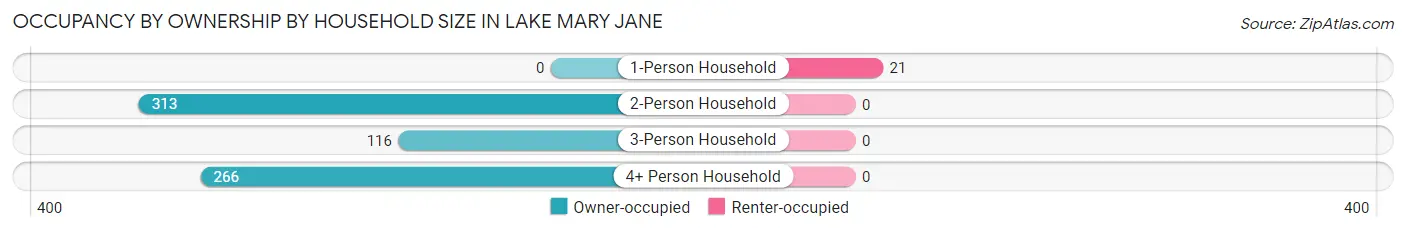
| Household Size | Owner-occupied | Renter-occupied |
| 1-Person Household | 0 (0.0%) | 21 (100.0%) |
| 2-Person Household | 313 (100.0%) | 0 (0.0%) |
| 3-Person Household | 116 (100.0%) | 0 (0.0%) |
| 4+ Person Household | 266 (100.0%) | 0 (0.0%) |
| Total Housing Units | 695 (97.1%) | 21 (2.9%) |
Occupancy by Educational Attainment in Lake Mary Jane
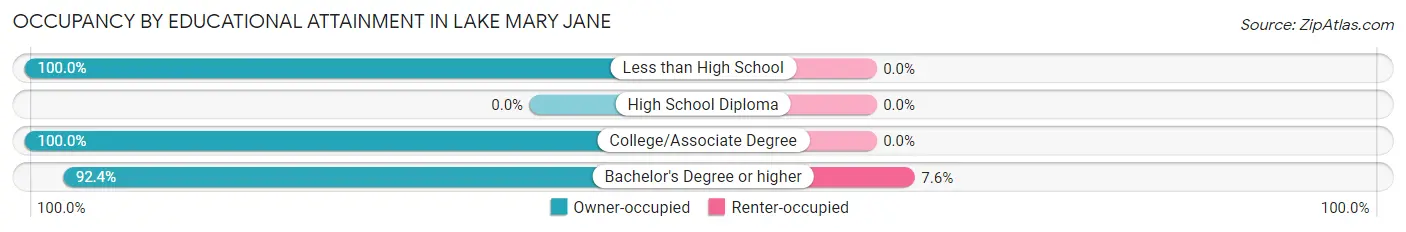
| Household Size | Owner-occupied | Renter-occupied |
| Less than High School | 92 (100.0%) | 0 (0.0%) |
| High School Diploma | 0 (0.0%) | 0 (0.0%) |
| College/Associate Degree | 347 (100.0%) | 0 (0.0%) |
| Bachelor's Degree or higher | 256 (92.4%) | 21 (7.6%) |
Occupancy by Age of Householder in Lake Mary Jane
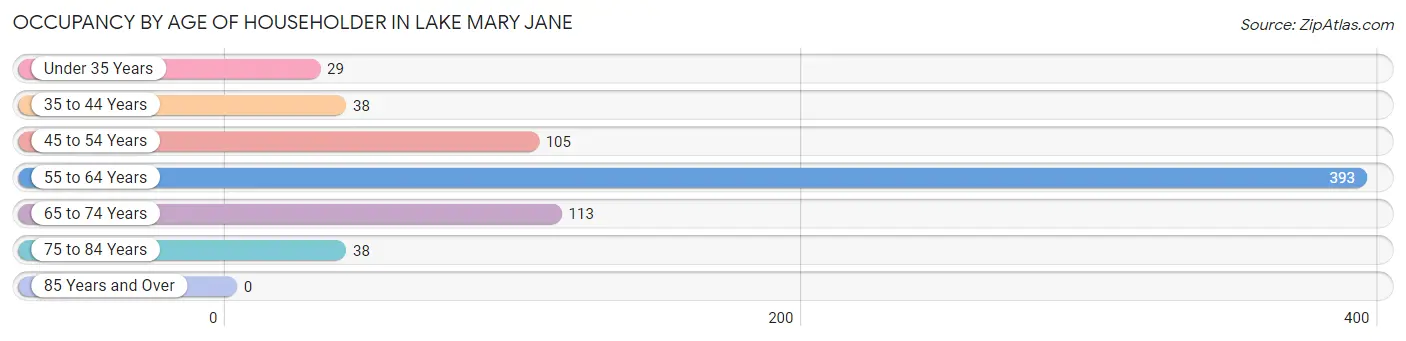
| Age Bracket | # Households | % Households |
| Under 35 Years | 29 | 4.1% |
| 35 to 44 Years | 38 | 5.3% |
| 45 to 54 Years | 105 | 14.7% |
| 55 to 64 Years | 393 | 54.9% |
| 65 to 74 Years | 113 | 15.8% |
| 75 to 84 Years | 38 | 5.3% |
| 85 Years and Over | 0 | 0.0% |
| Total | 716 | 100.0% |
Housing Finances in Lake Mary Jane
Median Income by Occupancy in Lake Mary Jane
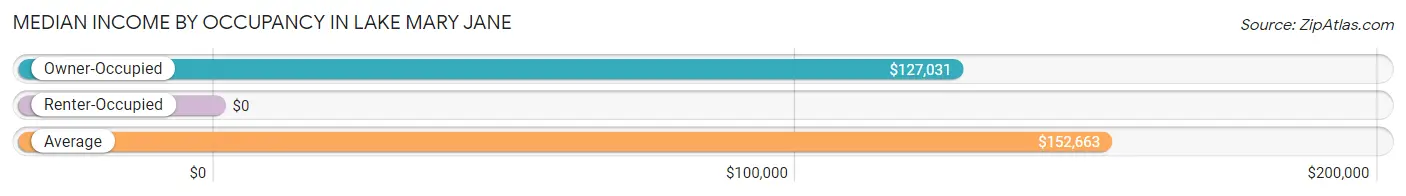
| Occupancy Type | # Households | Median Income |
| Owner-Occupied | 695 (97.1%) | $127,031 |
| Renter-Occupied | 21 (2.9%) | $0 |
| Average | 716 (100.0%) | $152,663 |
Occupancy by Householder Income Bracket in Lake Mary Jane
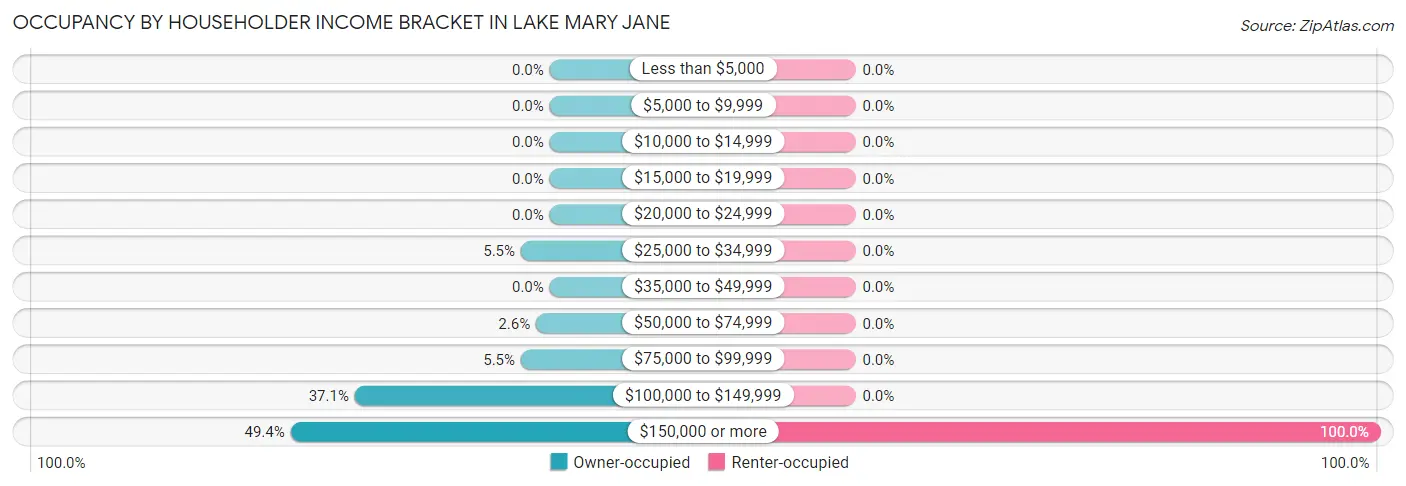
| Income Bracket | Owner-occupied | Renter-occupied |
| Less than $5,000 | 0 (0.0%) | 0 (0.0%) |
| $5,000 to $9,999 | 0 (0.0%) | 0 (0.0%) |
| $10,000 to $14,999 | 0 (0.0%) | 0 (0.0%) |
| $15,000 to $19,999 | 0 (0.0%) | 0 (0.0%) |
| $20,000 to $24,999 | 0 (0.0%) | 0 (0.0%) |
| $25,000 to $34,999 | 38 (5.5%) | 0 (0.0%) |
| $35,000 to $49,999 | 0 (0.0%) | 0 (0.0%) |
| $50,000 to $74,999 | 18 (2.6%) | 0 (0.0%) |
| $75,000 to $99,999 | 38 (5.5%) | 0 (0.0%) |
| $100,000 to $149,999 | 258 (37.1%) | 0 (0.0%) |
| $150,000 or more | 343 (49.3%) | 21 (100.0%) |
| Total | 695 (100.0%) | 21 (100.0%) |
Monthly Housing Cost Tiers in Lake Mary Jane
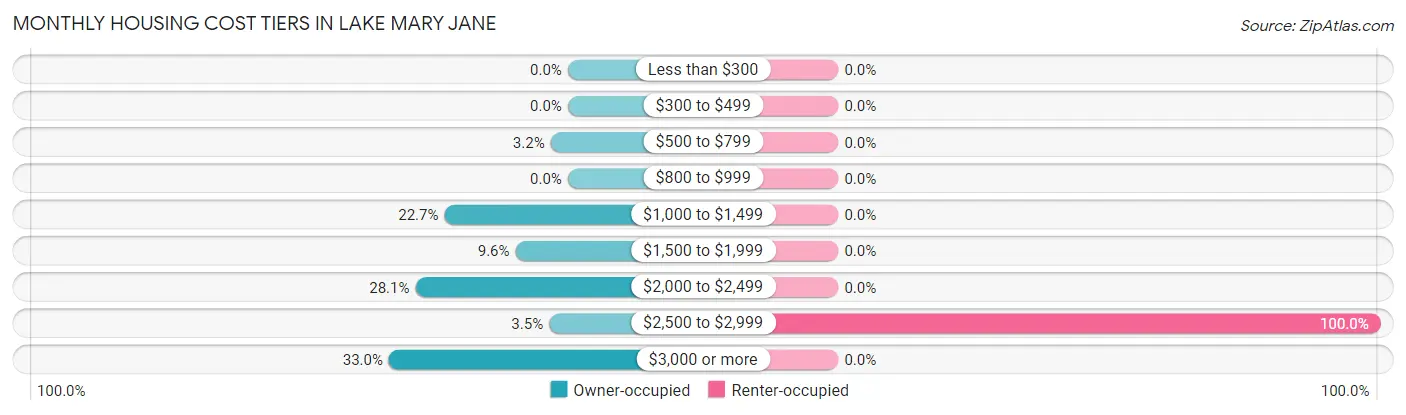
| Monthly Cost | Owner-occupied | Renter-occupied |
| Less than $300 | 0 (0.0%) | 0 (0.0%) |
| $300 to $499 | 0 (0.0%) | 0 (0.0%) |
| $500 to $799 | 22 (3.2%) | 0 (0.0%) |
| $800 to $999 | 0 (0.0%) | 0 (0.0%) |
| $1,000 to $1,499 | 158 (22.7%) | 0 (0.0%) |
| $1,500 to $1,999 | 67 (9.6%) | 0 (0.0%) |
| $2,000 to $2,499 | 195 (28.1%) | 0 (0.0%) |
| $2,500 to $2,999 | 24 (3.5%) | 21 (100.0%) |
| $3,000 or more | 229 (33.0%) | 0 (0.0%) |
| Total | 695 (100.0%) | 21 (100.0%) |
Physical Housing Characteristics in Lake Mary Jane
Housing Structures in Lake Mary Jane
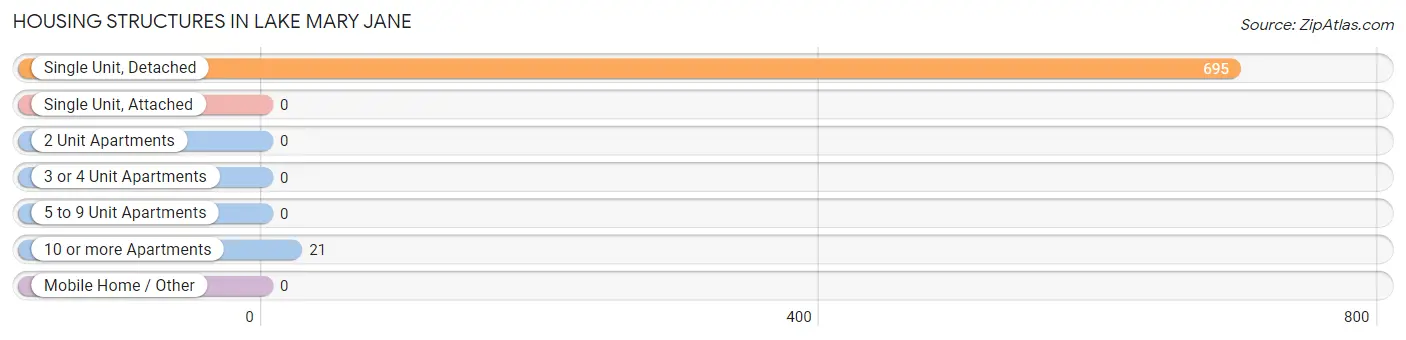
| Structure Type | # Housing Units | % Housing Units |
| Single Unit, Detached | 695 | 97.1% |
| Single Unit, Attached | 0 | 0.0% |
| 2 Unit Apartments | 0 | 0.0% |
| 3 or 4 Unit Apartments | 0 | 0.0% |
| 5 to 9 Unit Apartments | 0 | 0.0% |
| 10 or more Apartments | 21 | 2.9% |
| Mobile Home / Other | 0 | 0.0% |
| Total | 716 | 100.0% |
Housing Structures by Occupancy in Lake Mary Jane
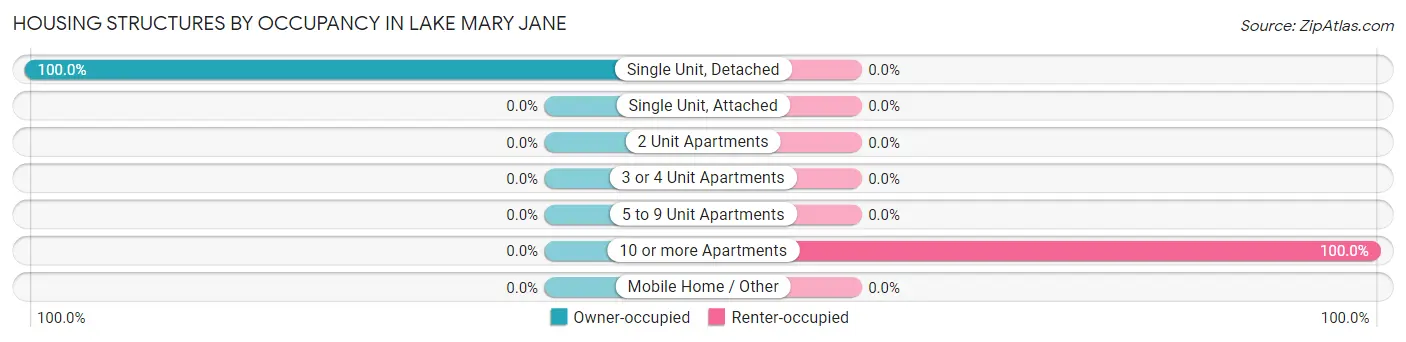
| Structure Type | Owner-occupied | Renter-occupied |
| Single Unit, Detached | 695 (100.0%) | 0 (0.0%) |
| Single Unit, Attached | 0 (0.0%) | 0 (0.0%) |
| 2 Unit Apartments | 0 (0.0%) | 0 (0.0%) |
| 3 or 4 Unit Apartments | 0 (0.0%) | 0 (0.0%) |
| 5 to 9 Unit Apartments | 0 (0.0%) | 0 (0.0%) |
| 10 or more Apartments | 0 (0.0%) | 21 (100.0%) |
| Mobile Home / Other | 0 (0.0%) | 0 (0.0%) |
| Total | 695 (97.1%) | 21 (2.9%) |
Housing Structures by Number of Rooms in Lake Mary Jane
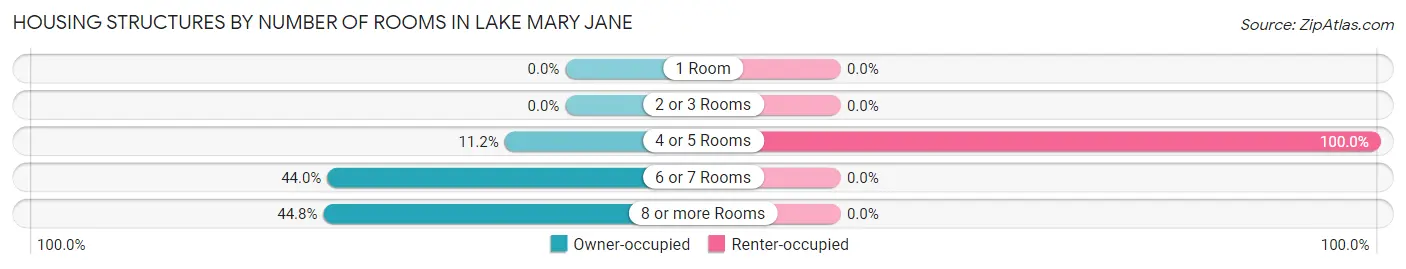
| Number of Rooms | Owner-occupied | Renter-occupied |
| 1 Room | 0 (0.0%) | 0 (0.0%) |
| 2 or 3 Rooms | 0 (0.0%) | 0 (0.0%) |
| 4 or 5 Rooms | 78 (11.2%) | 21 (100.0%) |
| 6 or 7 Rooms | 306 (44.0%) | 0 (0.0%) |
| 8 or more Rooms | 311 (44.8%) | 0 (0.0%) |
| Total | 695 (100.0%) | 21 (100.0%) |
Housing Structure by Heating Type in Lake Mary Jane
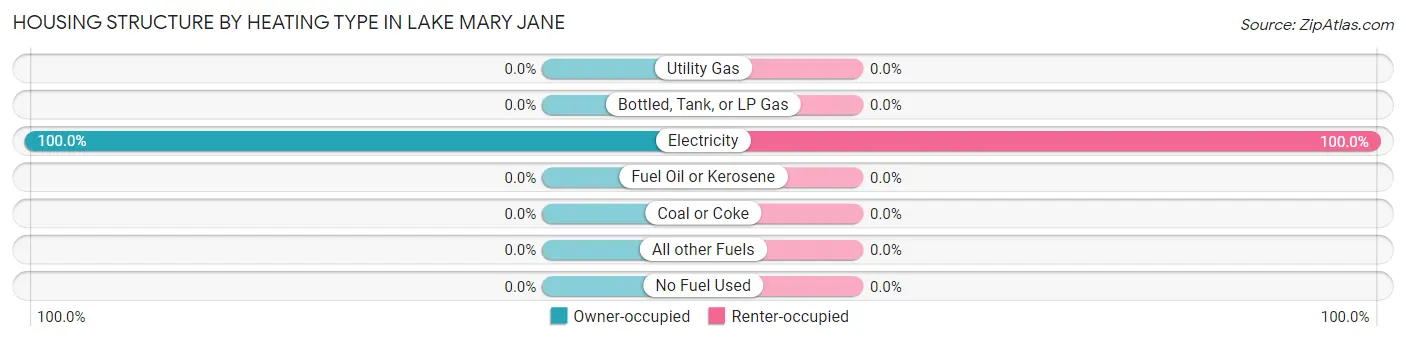
| Heating Type | Owner-occupied | Renter-occupied |
| Utility Gas | 0 (0.0%) | 0 (0.0%) |
| Bottled, Tank, or LP Gas | 0 (0.0%) | 0 (0.0%) |
| Electricity | 695 (100.0%) | 21 (100.0%) |
| Fuel Oil or Kerosene | 0 (0.0%) | 0 (0.0%) |
| Coal or Coke | 0 (0.0%) | 0 (0.0%) |
| All other Fuels | 0 (0.0%) | 0 (0.0%) |
| No Fuel Used | 0 (0.0%) | 0 (0.0%) |
| Total | 695 (100.0%) | 21 (100.0%) |
Household Vehicle Usage in Lake Mary Jane
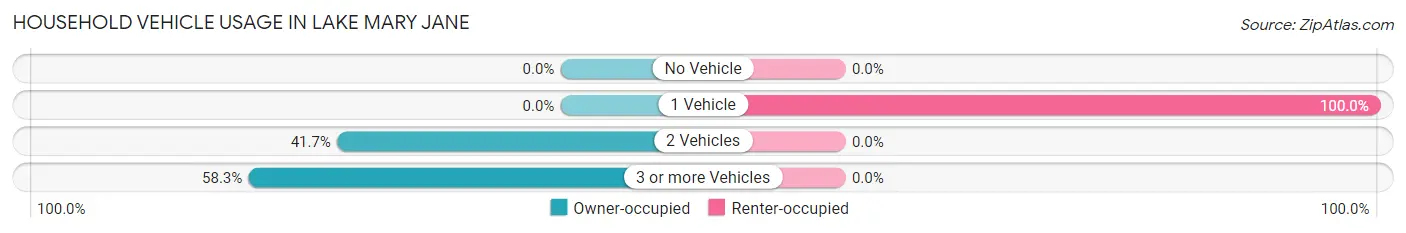
| Vehicles per Household | Owner-occupied | Renter-occupied |
| No Vehicle | 0 (0.0%) | 0 (0.0%) |
| 1 Vehicle | 0 (0.0%) | 21 (100.0%) |
| 2 Vehicles | 290 (41.7%) | 0 (0.0%) |
| 3 or more Vehicles | 405 (58.3%) | 0 (0.0%) |
| Total | 695 (100.0%) | 21 (100.0%) |
Real Estate & Mortgages in Lake Mary Jane
Real Estate and Mortgage Overview in Lake Mary Jane
| Characteristic | Without Mortgage | With Mortgage |
| Housing Units | 115 | 580 |
| Median Property Value | - | - |
| Median Household Income | $199,349 | $228 |
| Monthly Housing Costs | $1,274 | $229 |
| Real Estate Taxes | - | - |
Property Value by Mortgage Status in Lake Mary Jane
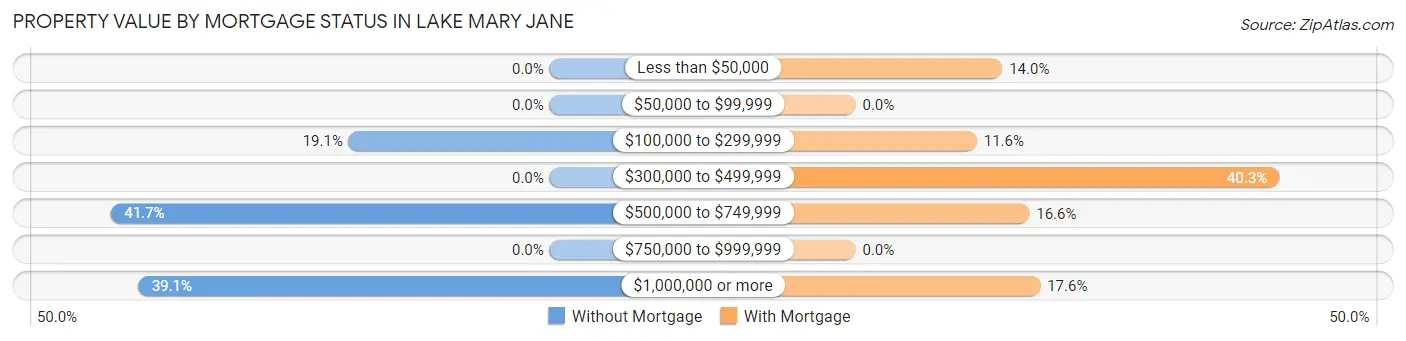
| Property Value | Without Mortgage | With Mortgage |
| Less than $50,000 | 0 (0.0%) | 81 (14.0%) |
| $50,000 to $99,999 | 0 (0.0%) | 0 (0.0%) |
| $100,000 to $299,999 | 22 (19.1%) | 67 (11.6%) |
| $300,000 to $499,999 | 0 (0.0%) | 234 (40.3%) |
| $500,000 to $749,999 | 48 (41.7%) | 96 (16.6%) |
| $750,000 to $999,999 | 0 (0.0%) | 0 (0.0%) |
| $1,000,000 or more | 45 (39.1%) | 102 (17.6%) |
| Total | 115 (100.0%) | 580 (100.0%) |
Household Income by Mortgage Status in Lake Mary Jane
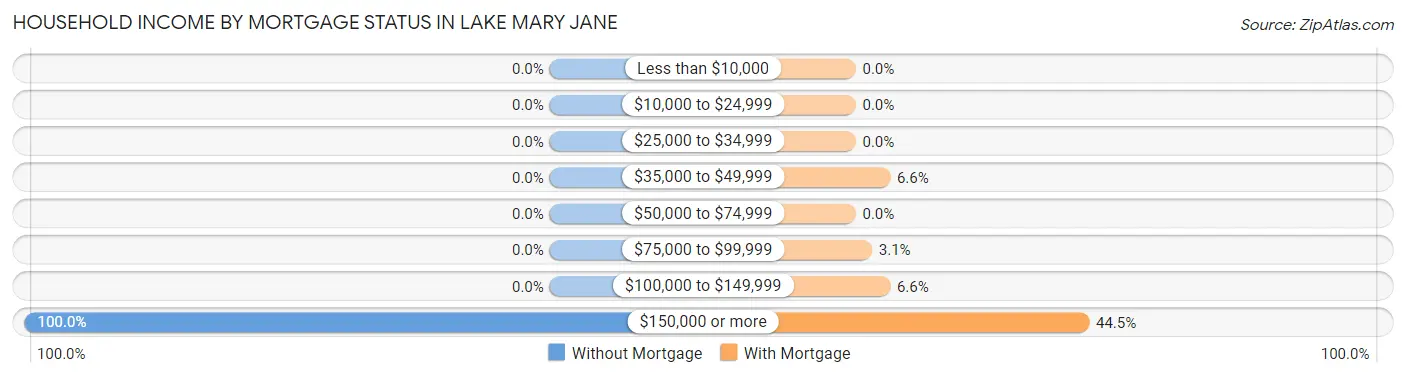
| Household Income | Without Mortgage | With Mortgage |
| Less than $10,000 | 0 (0.0%) | 0 (0.0%) |
| $10,000 to $24,999 | 0 (0.0%) | 0 (0.0%) |
| $25,000 to $34,999 | 0 (0.0%) | 0 (0.0%) |
| $35,000 to $49,999 | 0 (0.0%) | 38 (6.6%) |
| $50,000 to $74,999 | 0 (0.0%) | 0 (0.0%) |
| $75,000 to $99,999 | 0 (0.0%) | 18 (3.1%) |
| $100,000 to $149,999 | 0 (0.0%) | 38 (6.6%) |
| $150,000 or more | 115 (100.0%) | 258 (44.5%) |
| Total | 115 (100.0%) | 580 (100.0%) |
Property Value to Household Income Ratio in Lake Mary Jane
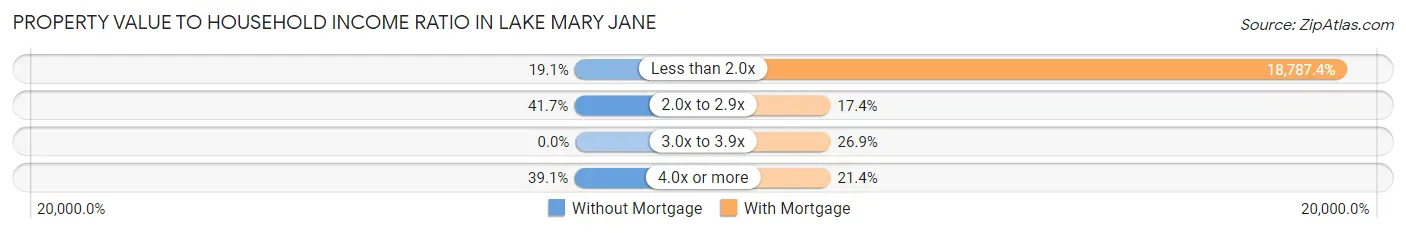
| Value-to-Income Ratio | Without Mortgage | With Mortgage |
| Less than 2.0x | 22 (19.1%) | 108,967 (18,787.4%) |
| 2.0x to 2.9x | 48 (41.7%) | 101 (17.4%) |
| 3.0x to 3.9x | 0 (0.0%) | 156 (26.9%) |
| 4.0x or more | 45 (39.1%) | 124 (21.4%) |
| Total | 115 (100.0%) | 580 (100.0%) |
Real Estate Taxes by Mortgage Status in Lake Mary Jane
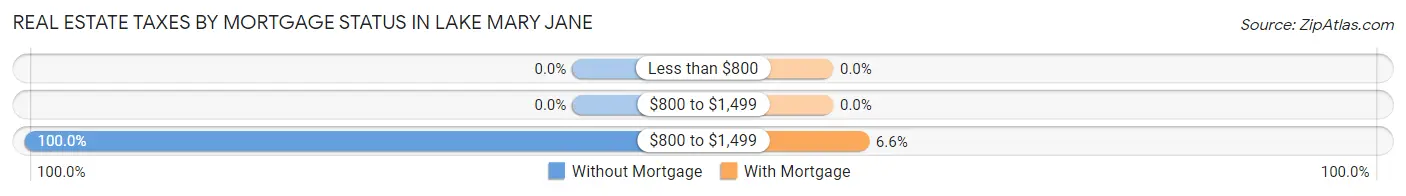
| Property Taxes | Without Mortgage | With Mortgage |
| Less than $800 | 0 (0.0%) | 0 (0.0%) |
| $800 to $1,499 | 0 (0.0%) | 0 (0.0%) |
| $800 to $1,499 | 115 (100.0%) | 38 (6.6%) |
| Total | 115 (100.0%) | 580 (100.0%) |
Health & Disability in Lake Mary Jane
Health Insurance Coverage by Age in Lake Mary Jane
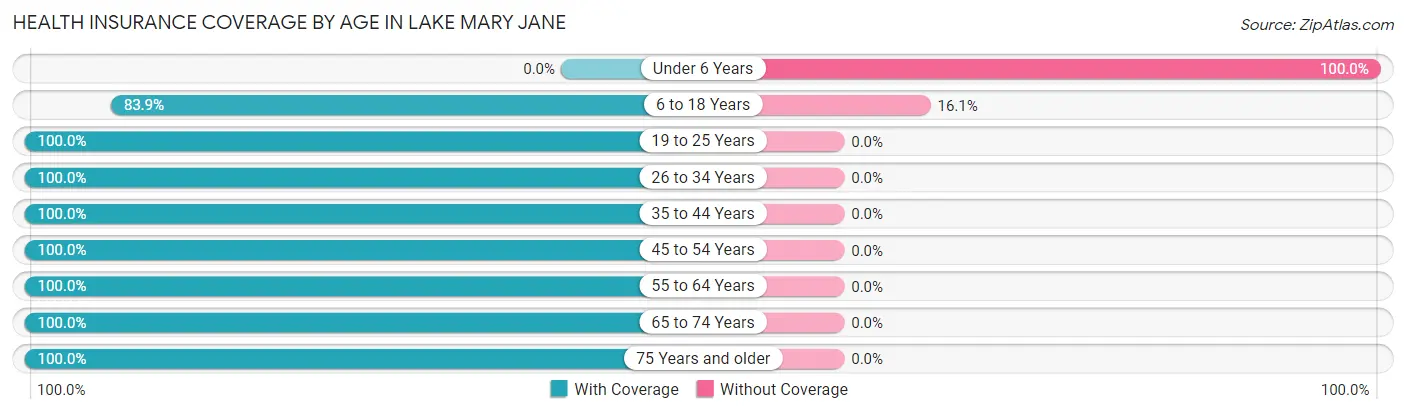
| Age Bracket | With Coverage | Without Coverage |
| Under 6 Years | 0 (0.0%) | 22 (100.0%) |
| 6 to 18 Years | 240 (83.9%) | 46 (16.1%) |
| 19 to 25 Years | 185 (100.0%) | 0 (0.0%) |
| 26 to 34 Years | 118 (100.0%) | 0 (0.0%) |
| 35 to 44 Years | 248 (100.0%) | 0 (0.0%) |
| 45 to 54 Years | 218 (100.0%) | 0 (0.0%) |
| 55 to 64 Years | 641 (100.0%) | 0 (0.0%) |
| 65 to 74 Years | 268 (100.0%) | 0 (0.0%) |
| 75 Years and older | 136 (100.0%) | 0 (0.0%) |
| Total | 2,054 (96.8%) | 68 (3.2%) |
Health Insurance Coverage by Citizenship Status in Lake Mary Jane
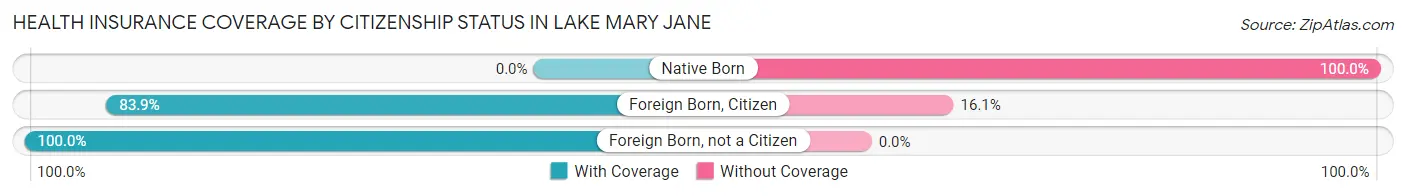
| Citizenship Status | With Coverage | Without Coverage |
| Native Born | 0 (0.0%) | 22 (100.0%) |
| Foreign Born, Citizen | 240 (83.9%) | 46 (16.1%) |
| Foreign Born, not a Citizen | 185 (100.0%) | 0 (0.0%) |
Health Insurance Coverage by Household Income in Lake Mary Jane
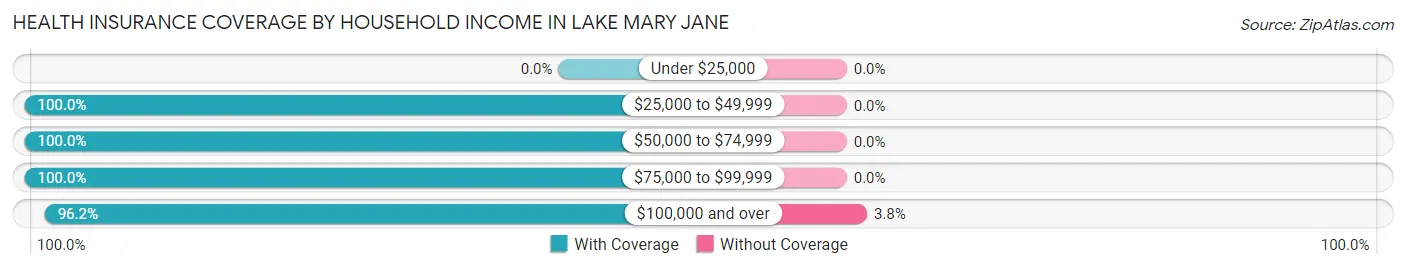
| Household Income | With Coverage | Without Coverage |
| Under $25,000 | 0 (0.0%) | 0 (0.0%) |
| $25,000 to $49,999 | 79 (100.0%) | 0 (0.0%) |
| $50,000 to $74,999 | 68 (100.0%) | 0 (0.0%) |
| $75,000 to $99,999 | 174 (100.0%) | 0 (0.0%) |
| $100,000 and over | 1,733 (96.2%) | 68 (3.8%) |
Public vs Private Health Insurance Coverage by Age in Lake Mary Jane
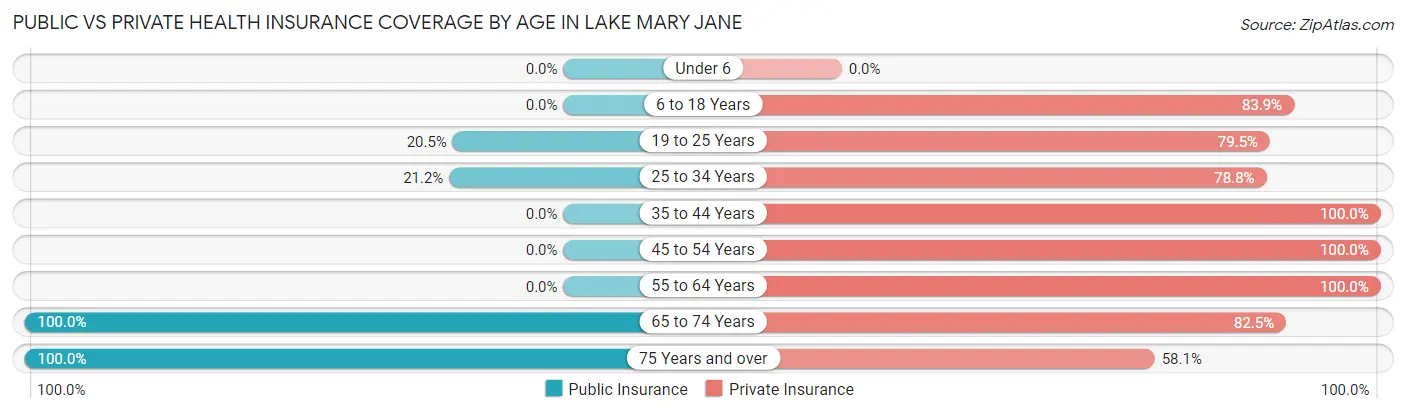
| Age Bracket | Public Insurance | Private Insurance |
| Under 6 | 0 (0.0%) | 0 (0.0%) |
| 6 to 18 Years | 0 (0.0%) | 240 (83.9%) |
| 19 to 25 Years | 38 (20.5%) | 147 (79.5%) |
| 25 to 34 Years | 25 (21.2%) | 93 (78.8%) |
| 35 to 44 Years | 0 (0.0%) | 248 (100.0%) |
| 45 to 54 Years | 0 (0.0%) | 218 (100.0%) |
| 55 to 64 Years | 0 (0.0%) | 641 (100.0%) |
| 65 to 74 Years | 268 (100.0%) | 221 (82.5%) |
| 75 Years and over | 136 (100.0%) | 79 (58.1%) |
| Total | 467 (22.0%) | 1,887 (88.9%) |
Disability Status by Sex by Age in Lake Mary Jane
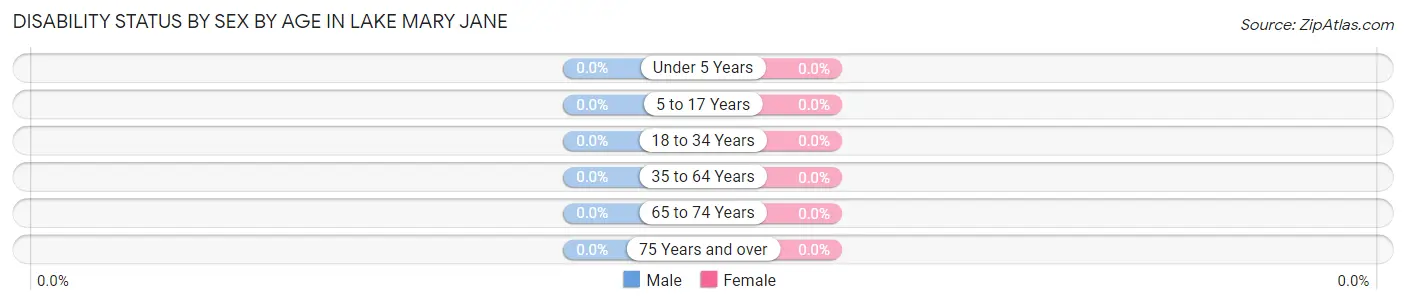
| Age Bracket | Male | Female |
| Under 5 Years | 0 (0.0%) | 0 (0.0%) |
| 5 to 17 Years | 0 (0.0%) | 0 (0.0%) |
| 18 to 34 Years | 0 (0.0%) | 0 (0.0%) |
| 35 to 64 Years | 0 (0.0%) | 0 (0.0%) |
| 65 to 74 Years | 0 (0.0%) | 0 (0.0%) |
| 75 Years and over | 0 (0.0%) | 0 (0.0%) |
Disability Class by Sex by Age in Lake Mary Jane
Disability Class: Hearing Difficulty
| Age Bracket | Male | Female |
| Under 5 Years | 0 (0.0%) | 0 (0.0%) |
| 5 to 17 Years | 0 (0.0%) | 0 (0.0%) |
| 18 to 34 Years | 0 (0.0%) | 0 (0.0%) |
| 35 to 64 Years | 0 (0.0%) | 0 (0.0%) |
| 65 to 74 Years | 0 (0.0%) | 0 (0.0%) |
| 75 Years and over | 0 (0.0%) | 0 (0.0%) |
Disability Class: Vision Difficulty
| Age Bracket | Male | Female |
| Under 5 Years | 0 (0.0%) | 0 (0.0%) |
| 5 to 17 Years | 0 (0.0%) | 0 (0.0%) |
| 18 to 34 Years | 0 (0.0%) | 0 (0.0%) |
| 35 to 64 Years | 0 (0.0%) | 0 (0.0%) |
| 65 to 74 Years | 0 (0.0%) | 0 (0.0%) |
| 75 Years and over | 0 (0.0%) | 0 (0.0%) |
Disability Class: Cognitive Difficulty
| Age Bracket | Male | Female |
| 5 to 17 Years | 0 (0.0%) | 0 (0.0%) |
| 18 to 34 Years | 0 (0.0%) | 0 (0.0%) |
| 35 to 64 Years | 0 (0.0%) | 0 (0.0%) |
| 65 to 74 Years | 0 (0.0%) | 0 (0.0%) |
| 75 Years and over | 0 (0.0%) | 0 (0.0%) |
Disability Class: Ambulatory Difficulty
| Age Bracket | Male | Female |
| 5 to 17 Years | 0 (0.0%) | 0 (0.0%) |
| 18 to 34 Years | 0 (0.0%) | 0 (0.0%) |
| 35 to 64 Years | 0 (0.0%) | 0 (0.0%) |
| 65 to 74 Years | 0 (0.0%) | 0 (0.0%) |
| 75 Years and over | 0 (0.0%) | 0 (0.0%) |
Disability Class: Self-Care Difficulty
| Age Bracket | Male | Female |
| 5 to 17 Years | 0 (0.0%) | 0 (0.0%) |
| 18 to 34 Years | 0 (0.0%) | 0 (0.0%) |
| 35 to 64 Years | 0 (0.0%) | 0 (0.0%) |
| 65 to 74 Years | 0 (0.0%) | 0 (0.0%) |
| 75 Years and over | 0 (0.0%) | 0 (0.0%) |
Technology Access in Lake Mary Jane
Computing Device Access in Lake Mary Jane
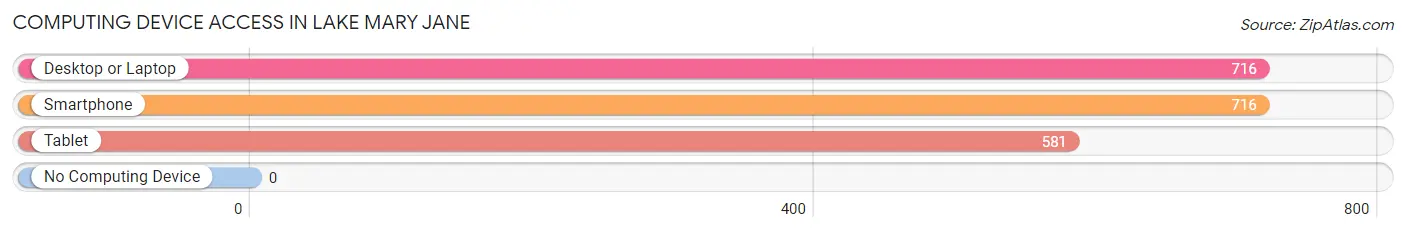
| Device Type | # Households | % Households |
| Desktop or Laptop | 716 | 100.0% |
| Smartphone | 716 | 100.0% |
| Tablet | 581 | 81.1% |
| No Computing Device | 0 | 0.0% |
| Total | 716 | 100.0% |
Internet Access in Lake Mary Jane
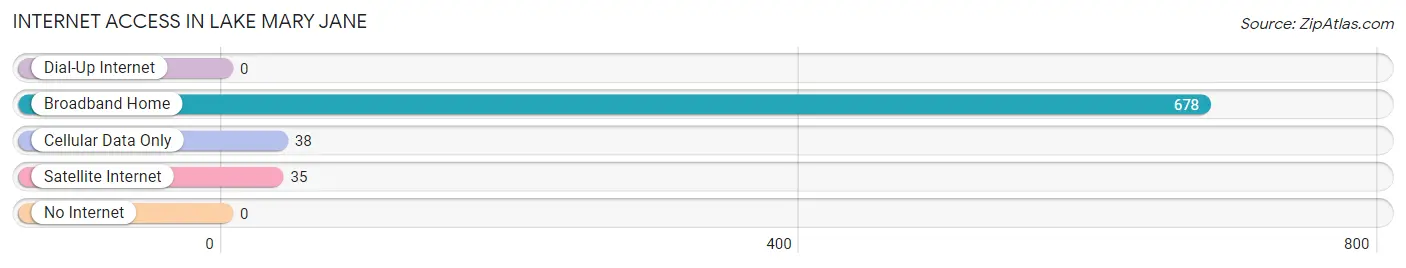
| Internet Type | # Households | % Households |
| Dial-Up Internet | 0 | 0.0% |
| Broadband Home | 678 | 94.7% |
| Cellular Data Only | 38 | 5.3% |
| Satellite Internet | 35 | 4.9% |
| No Internet | 0 | 0.0% |
| Total | 716 | 100.0% |
Lake Mary Jane Summary
Mary Jane, Florida is a small unincorporated community located in Seminole County, Florida. It is situated on the eastern shore of Lake Mary Jane, a small lake that is part of the larger Lake Jesup. The community is located approximately 20 miles northeast of Orlando and is part of the Orlando-Kissimmee-Sanford Metropolitan Statistical Area.
History
The area that is now Mary Jane, Florida was originally inhabited by the Seminole Indians. The first European settlers arrived in the area in the late 1800s and began to establish homesteads. The area was named after Mary Jane, the daughter of one of the first settlers.
In the early 1900s, the area began to develop as a small farming community. The area was known for its citrus groves and vegetable farms. In the 1950s, the area began to experience rapid growth as the Orlando area began to expand.
Geography
Mary Jane, Florida is located in Seminole County, Florida. It is situated on the eastern shore of Lake Mary Jane, a small lake that is part of the larger Lake Jesup. The community is located approximately 20 miles northeast of Orlando and is part of the Orlando-Kissimmee-Sanford Metropolitan Statistical Area.
The area is characterized by flat terrain and is mostly covered in pine and palmetto trees. The area is also home to a variety of wildlife, including deer, wild turkeys, and alligators.
Economy
The economy of Mary Jane, Florida is largely based on agriculture and tourism. The area is known for its citrus groves and vegetable farms. In addition, the area is home to several small businesses, including restaurants, convenience stores, and gas stations.
The area is also a popular destination for tourists, as it is close to the attractions of Orlando. The area is home to several campgrounds and RV parks, as well as a variety of outdoor activities, such as fishing, boating, and hiking.
Demographics
As of the 2010 census, the population of Mary Jane, Florida was 1,845. The population is largely white (90.2%) and Hispanic (7.2%). The median household income is $45,938 and the median age is 43.
Conclusion
Mary Jane, Florida is a small unincorporated community located in Seminole County, Florida. It is situated on the eastern shore of Lake Mary Jane, a small lake that is part of the larger Lake Jesup. The area was originally inhabited by the Seminole Indians and was later settled by European settlers in the late 1800s. The economy of Mary Jane, Florida is largely based on agriculture and tourism. As of the 2010 census, the population of Mary Jane, Florida was 1,845. The population is largely white (90.2%) and Hispanic (7.2%). The median household income is $45,938 and the median age is 43.
Common Questions
What is Per Capita Income in Lake Mary Jane?
Per Capita income in Lake Mary Jane is $54,179.
What is the Median Family Income in Lake Mary Jane?
Median Family Income in Lake Mary Jane is $127,031.
What is the Median Household income in Lake Mary Jane?
Median Household Income in Lake Mary Jane is $152,663.
What is Inequality or Gini Index in Lake Mary Jane?
Inequality or Gini Index in Lake Mary Jane is 0.31.
What is the Total Population of Lake Mary Jane?
Total Population of Lake Mary Jane is 2,122.
What is the Total Male Population of Lake Mary Jane?
Total Male Population of Lake Mary Jane is 1,188.
What is the Total Female Population of Lake Mary Jane?
Total Female Population of Lake Mary Jane is 934.
What is the Ratio of Males per 100 Females in Lake Mary Jane?
There are 127.19 Males per 100 Females in Lake Mary Jane.
What is the Ratio of Females per 100 Males in Lake Mary Jane?
There are 78.62 Females per 100 Males in Lake Mary Jane.
What is the Median Population Age in Lake Mary Jane?
Median Population Age in Lake Mary Jane is 54.3 Years.
What is the Average Family Size in Lake Mary Jane
Average Family Size in Lake Mary Jane is 2.9 People.
What is the Average Household Size in Lake Mary Jane
Average Household Size in Lake Mary Jane is 3.0 People.
How Large is the Labor Force in Lake Mary Jane?
There are 1,241 People in the Labor Forcein in Lake Mary Jane.
What is the Percentage of People in the Labor Force in Lake Mary Jane?
66.0% of People are in the Labor Force in Lake Mary Jane.
What is the Unemployment Rate in Lake Mary Jane?
Unemployment Rate in Lake Mary Jane is 3.1%.