Ugandan vs Colombian Disability Age 5 to 17
COMPARE
Ugandan
Colombian
Disability Age 5 to 17
Disability Age 5 to 17 Comparison
Ugandans
Colombians
6.2%
DISABILITY AGE 5 TO 17
0.0/ 100
METRIC RATING
283rd/ 347
METRIC RANK
5.5%
DISABILITY AGE 5 TO 17
88.0/ 100
METRIC RATING
142nd/ 347
METRIC RANK
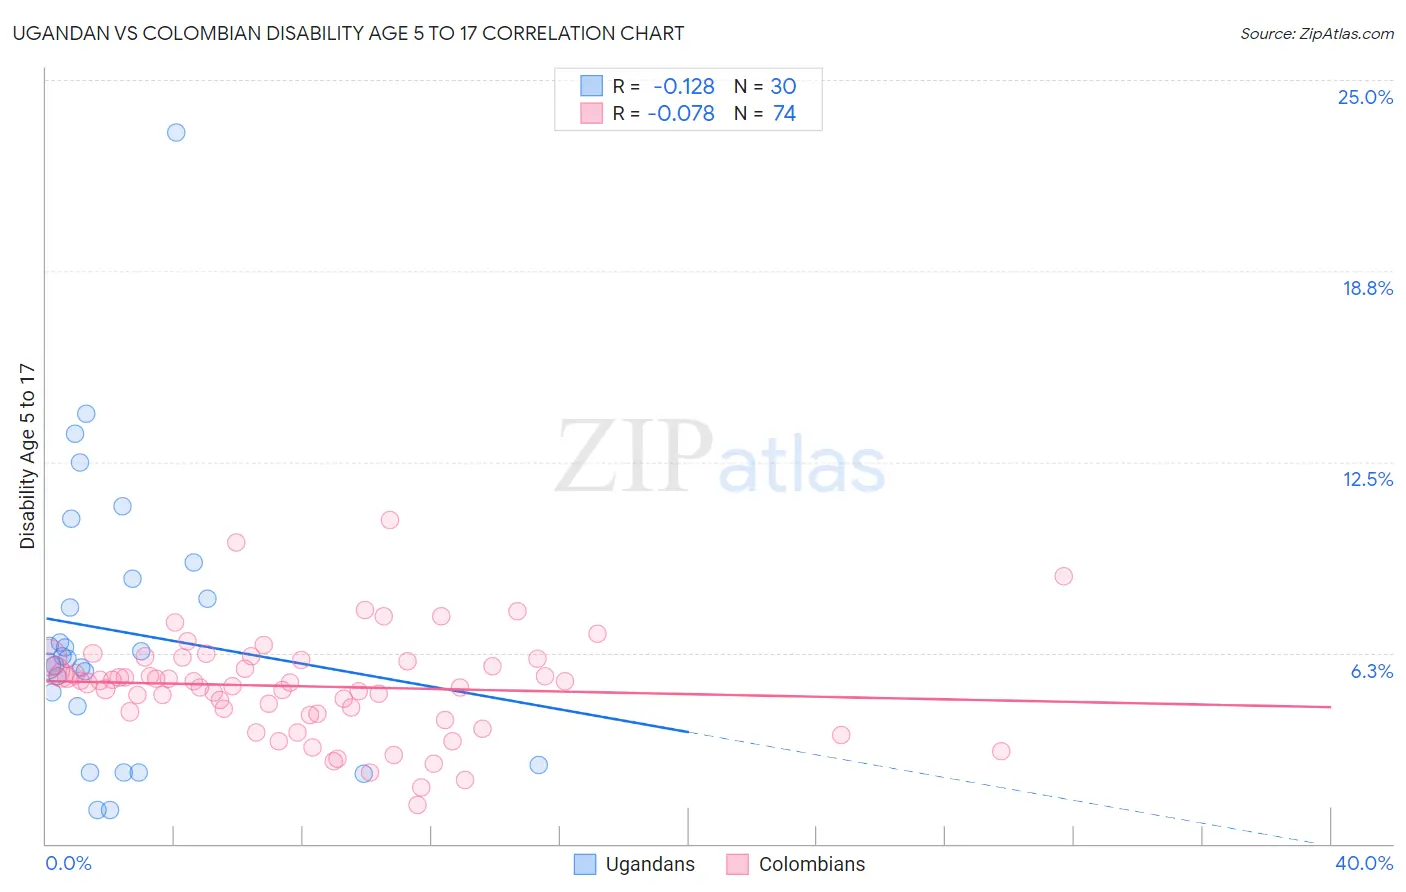
Ugandan vs Colombian Disability Age 5 to 17 Correlation Chart
The statistical analysis conducted on geographies consisting of 93,800,816 people shows a poor negative correlation between the proportion of Ugandans and percentage of population with a disability between the ages 5 and 17 in the United States with a correlation coefficient (R) of -0.128 and weighted average of 6.2%. Similarly, the statistical analysis conducted on geographies consisting of 416,048,287 people shows a slight negative correlation between the proportion of Colombians and percentage of population with a disability between the ages 5 and 17 in the United States with a correlation coefficient (R) of -0.078 and weighted average of 5.5%, a difference of 12.7%.
Disability Age 5 to 17 Correlation Summary
| Measurement | Ugandan | Colombian |
| Minimum | 1.1% | 1.3% |
| Maximum | 23.3% | 10.6% |
| Range | 22.2% | 9.3% |
| Mean | 7.0% | 5.2% |
| Median | 6.1% | 5.3% |
| Interquartile 25% (IQ1) | 4.5% | 4.3% |
| Interquartile 75% (IQ3) | 8.7% | 6.0% |
| Interquartile Range (IQR) | 4.2% | 1.7% |
| Standard Deviation (Sample) | 4.6% | 1.7% |
| Standard Deviation (Population) | 4.6% | 1.7% |
Similar Demographics by Disability Age 5 to 17
Demographics Similar to Ugandans by Disability Age 5 to 17
In terms of disability age 5 to 17, the demographic groups most similar to Ugandans are Subsaharan African (6.2%, a difference of 0.030%), English (6.2%, a difference of 0.030%), Colville (6.2%, a difference of 0.070%), German (6.1%, a difference of 0.16%), and Pima (6.2%, a difference of 0.26%).
| Demographics | Rating | Rank | Disability Age 5 to 17 |
| Japanese | 0.1 /100 | #276 | Tragic 6.1% |
| Puget Sound Salish | 0.1 /100 | #277 | Tragic 6.1% |
| Immigrants | Liberia | 0.1 /100 | #278 | Tragic 6.1% |
| Immigrants | Jamaica | 0.1 /100 | #279 | Tragic 6.1% |
| Portuguese | 0.1 /100 | #280 | Tragic 6.1% |
| Scottish | 0.0 /100 | #281 | Tragic 6.1% |
| Germans | 0.0 /100 | #282 | Tragic 6.1% |
| Ugandans | 0.0 /100 | #283 | Tragic 6.2% |
| Sub-Saharan Africans | 0.0 /100 | #284 | Tragic 6.2% |
| English | 0.0 /100 | #285 | Tragic 6.2% |
| Colville | 0.0 /100 | #286 | Tragic 6.2% |
| Pima | 0.0 /100 | #287 | Tragic 6.2% |
| Jamaicans | 0.0 /100 | #288 | Tragic 6.2% |
| Yaqui | 0.0 /100 | #289 | Tragic 6.2% |
| Immigrants | Congo | 0.0 /100 | #290 | Tragic 6.2% |
Demographics Similar to Colombians by Disability Age 5 to 17
In terms of disability age 5 to 17, the demographic groups most similar to Colombians are Immigrants from Hungary (5.5%, a difference of 0.020%), Pakistani (5.5%, a difference of 0.090%), South American Indian (5.5%, a difference of 0.15%), Immigrants from Guatemala (5.5%, a difference of 0.16%), and Immigrants from Netherlands (5.4%, a difference of 0.32%).
| Demographics | Rating | Rank | Disability Age 5 to 17 |
| Immigrants | Belize | 91.7 /100 | #135 | Exceptional 5.4% |
| Immigrants | Denmark | 91.4 /100 | #136 | Exceptional 5.4% |
| Navajo | 90.9 /100 | #137 | Exceptional 5.4% |
| Immigrants | Oceania | 90.8 /100 | #138 | Exceptional 5.4% |
| Belizeans | 90.8 /100 | #139 | Exceptional 5.4% |
| Immigrants | Netherlands | 90.5 /100 | #140 | Exceptional 5.4% |
| South American Indians | 89.3 /100 | #141 | Excellent 5.5% |
| Colombians | 88.0 /100 | #142 | Excellent 5.5% |
| Immigrants | Hungary | 87.9 /100 | #143 | Excellent 5.5% |
| Pakistanis | 87.3 /100 | #144 | Excellent 5.5% |
| Immigrants | Guatemala | 86.6 /100 | #145 | Excellent 5.5% |
| Albanians | 83.7 /100 | #146 | Excellent 5.5% |
| Immigrants | Albania | 83.1 /100 | #147 | Excellent 5.5% |
| Samoans | 81.9 /100 | #148 | Excellent 5.5% |
| Central Americans | 81.6 /100 | #149 | Excellent 5.5% |