Kiowa vs Immigrants from Iraq Disability Age 5 to 17
COMPARE
Kiowa
Immigrants from Iraq
Disability Age 5 to 17
Disability Age 5 to 17 Comparison
Kiowa
Immigrants from Iraq
6.4%
DISABILITY AGE 5 TO 17
0.0/ 100
METRIC RATING
317th/ 347
METRIC RANK
5.6%
DISABILITY AGE 5 TO 17
53.9/ 100
METRIC RATING
171st/ 347
METRIC RANK
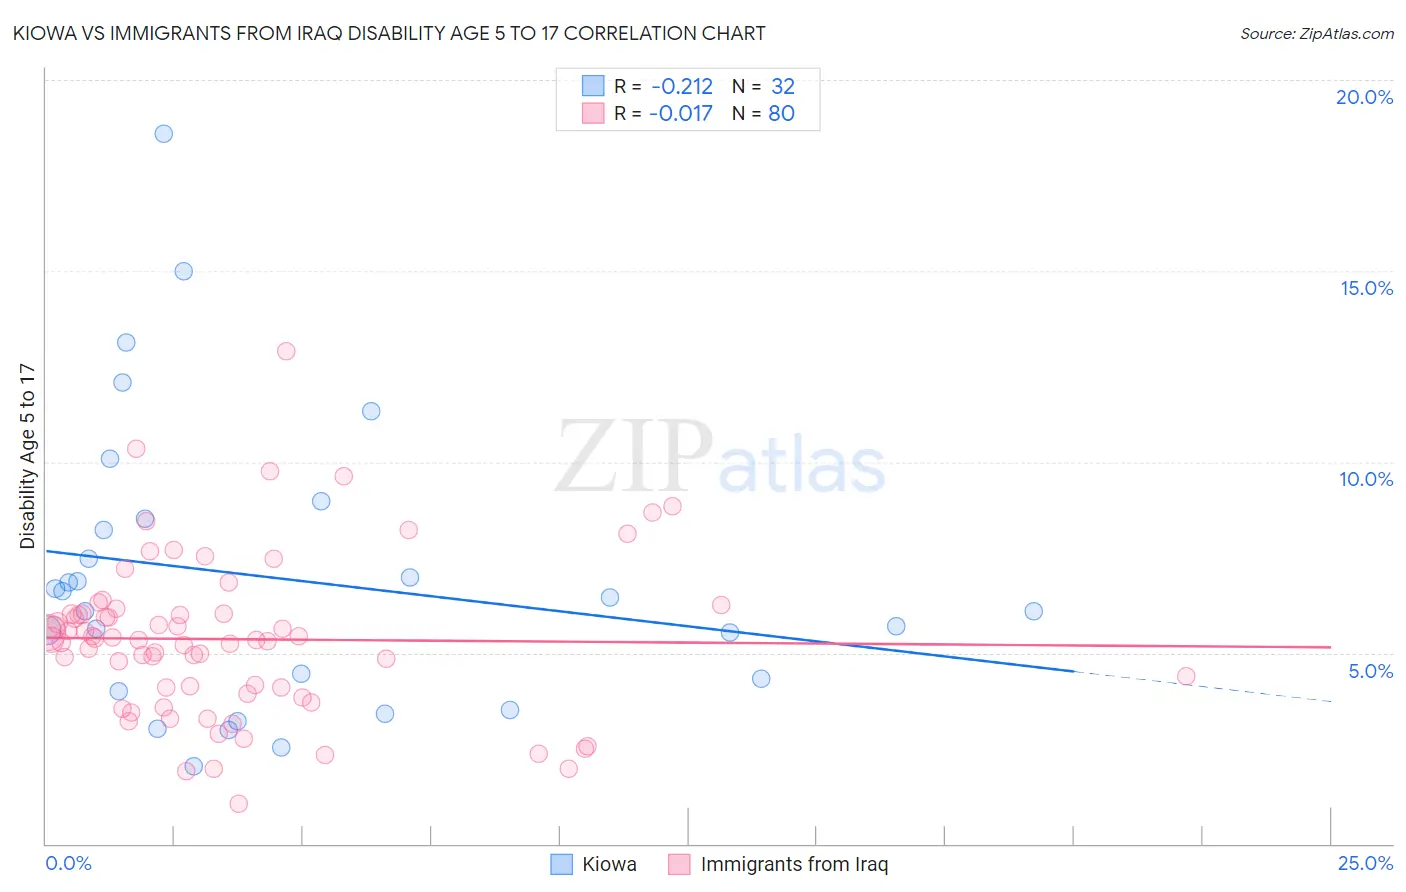
Kiowa vs Immigrants from Iraq Disability Age 5 to 17 Correlation Chart
The statistical analysis conducted on geographies consisting of 55,978,349 people shows a weak negative correlation between the proportion of Kiowa and percentage of population with a disability between the ages 5 and 17 in the United States with a correlation coefficient (R) of -0.212 and weighted average of 6.4%. Similarly, the statistical analysis conducted on geographies consisting of 194,133,073 people shows no correlation between the proportion of Immigrants from Iraq and percentage of population with a disability between the ages 5 and 17 in the United States with a correlation coefficient (R) of -0.017 and weighted average of 5.6%, a difference of 15.3%.
Disability Age 5 to 17 Correlation Summary
| Measurement | Kiowa | Immigrants from Iraq |
| Minimum | 2.0% | 1.0% |
| Maximum | 18.6% | 12.9% |
| Range | 16.6% | 11.9% |
| Mean | 6.9% | 5.4% |
| Median | 6.3% | 5.3% |
| Interquartile 25% (IQ1) | 4.2% | 4.0% |
| Interquartile 75% (IQ3) | 8.4% | 6.0% |
| Interquartile Range (IQR) | 4.2% | 2.0% |
| Standard Deviation (Sample) | 3.8% | 2.1% |
| Standard Deviation (Population) | 3.7% | 2.1% |
Similar Demographics by Disability Age 5 to 17
Demographics Similar to Kiowa by Disability Age 5 to 17
In terms of disability age 5 to 17, the demographic groups most similar to Kiowa are Comanche (6.4%, a difference of 0.030%), Immigrants from Dominican Republic (6.4%, a difference of 0.13%), Immigrants from Portugal (6.4%, a difference of 0.31%), French (6.4%, a difference of 0.48%), and Delaware (6.5%, a difference of 0.58%).
| Demographics | Rating | Rank | Disability Age 5 to 17 |
| Alaskan Athabascans | 0.0 /100 | #310 | Tragic 6.3% |
| Immigrants | Dominica | 0.0 /100 | #311 | Tragic 6.3% |
| Bermudans | 0.0 /100 | #312 | Tragic 6.4% |
| Apache | 0.0 /100 | #313 | Tragic 6.4% |
| French | 0.0 /100 | #314 | Tragic 6.4% |
| Immigrants | Portugal | 0.0 /100 | #315 | Tragic 6.4% |
| Immigrants | Dominican Republic | 0.0 /100 | #316 | Tragic 6.4% |
| Kiowa | 0.0 /100 | #317 | Tragic 6.4% |
| Comanche | 0.0 /100 | #318 | Tragic 6.4% |
| Delaware | 0.0 /100 | #319 | Tragic 6.5% |
| Africans | 0.0 /100 | #320 | Tragic 6.5% |
| Tohono O'odham | 0.0 /100 | #321 | Tragic 6.5% |
| Slovaks | 0.0 /100 | #322 | Tragic 6.5% |
| Osage | 0.0 /100 | #323 | Tragic 6.5% |
| Dominicans | 0.0 /100 | #324 | Tragic 6.5% |
Demographics Similar to Immigrants from Iraq by Disability Age 5 to 17
In terms of disability age 5 to 17, the demographic groups most similar to Immigrants from Iraq are Serbian (5.6%, a difference of 0.0%), Immigrants from Norway (5.6%, a difference of 0.090%), Iraqi (5.6%, a difference of 0.11%), Ukrainian (5.6%, a difference of 0.12%), and Uruguayan (5.6%, a difference of 0.15%).
| Demographics | Rating | Rank | Disability Age 5 to 17 |
| Immigrants | Scotland | 61.9 /100 | #164 | Good 5.6% |
| Lebanese | 61.4 /100 | #165 | Good 5.6% |
| Greeks | 60.6 /100 | #166 | Good 5.6% |
| Immigrants | Burma/Myanmar | 59.3 /100 | #167 | Average 5.6% |
| Iraqis | 56.0 /100 | #168 | Average 5.6% |
| Immigrants | Norway | 55.7 /100 | #169 | Average 5.6% |
| Serbians | 54.0 /100 | #170 | Average 5.6% |
| Immigrants | Iraq | 53.9 /100 | #171 | Average 5.6% |
| Ukrainians | 51.5 /100 | #172 | Average 5.6% |
| Uruguayans | 51.0 /100 | #173 | Average 5.6% |
| Costa Ricans | 50.0 /100 | #174 | Average 5.6% |
| Shoshone | 49.4 /100 | #175 | Average 5.6% |
| Immigrants | Central America | 49.4 /100 | #176 | Average 5.6% |
| Immigrants | Western Europe | 47.8 /100 | #177 | Average 5.6% |
| Immigrants | Trinidad and Tobago | 47.6 /100 | #178 | Average 5.6% |