Kiowa Single Female Poverty

COMPARE

Kiowa
Race
Ancestry
AfghanAfricanAlaska NativeAlaskan AthabascanAlbanianAleutAlsatianAmericanApacheArabArapahoArgentineanArmenianAssyrian/Chaldean/SyriacAustralianAustrianBahamianBangladeshiBarbadianBasqueBelgianBelizeanBermudanBhutaneseBlackfeetBolivianBrazilianBritishBritish West IndianBulgarianBurmeseCajunCambodianCanadianCape VerdeanCarpatho RusynCelticCentral AmericanCentral American IndianCherokeeCheyenneChickasawChileanChineseChippewaChoctawColombianColvilleComancheCosta RicanCreeCreekCroatianCrowCubanCypriotCzechCzechoslovakianDanishDelawareDominicanDutchDutch West IndianEastern EuropeanEcuadorianEgyptianEnglishEstonianEthiopianEuropeanFijianFilipinoFinnishFrenchFrench American IndianFrench CanadianGermanGerman RussianGhanaianGreekGuamanian/ChamorroGuatemalanGuyaneseHaitianHmongHonduranHopiHoumaHungarianIcelanderIndian (Asian)IndonesianInupiatIranianIraqiIrishIroquoisIsraeliItalianJamaicanJapaneseJordanianKenyanKiowaKoreanLaotianLatvianLebaneseLiberianLithuanianLumbeeLuxembourgerMacedonianMalaysianMalteseMarshalleseMenomineeMexicanMexican American IndianMongolianMoroccanNative HawaiianNavajoNepaleseNew ZealanderNicaraguanNigerianNorthern EuropeanNorwegianOkinawanOsageOttawaPaiutePakistaniPalestinianPanamanianParaguayanPennsylvania GermanPeruvianPimaPolishPortuguesePotawatomiPuebloPuerto RicanPuget Sound SalishRomanianRussianSalvadoranSamoanScandinavianScotch-IrishScottishSeminoleSenegaleseSerbianShoshoneSierra LeoneanSiouxSlavicSlovakSloveneSomaliSouth AfricanSouth AmericanSouth American IndianSoviet UnionSpaniardSpanishSpanish AmericanSpanish American IndianSri LankanSubsaharan AfricanSudaneseSwedishSwissSyrianTaiwaneseThaiTlingit-HaidaTohono O'OdhamTonganTrinidadian and TobagonianTsimshianTurkishU.S. Virgin IslanderUgandanUkrainianUruguayanUteVenezuelanVietnameseWelshWest IndianYakamaYaquiYugoslavianYumanYup'ikZimbabwean
Immigration
NonimmigrantsImmigrantsAfghanistanAfricaAlbaniaArgentinaArmeniaAsiaAustraliaAustriaBahamasBangladeshBarbadosBelarusBelgiumBelizeBoliviaBosnia and HerzegovinaBrazilBulgariaBurma/MyanmarCabo VerdeCambodiaCameroonCanadaCaribbeanCentral AmericaChileChinaColombiaCongoCosta RicaCroatiaCubaCzechoslovakiaDenmarkDominicaDominican RepublicEastern AfricaEastern AsiaEastern EuropeEcuadorEgyptEl SalvadorEnglandEritreaEthiopiaEuropeFijiFranceGermanyGhanaGreeceGrenadaGuatemalaGuyanaHaitiHondurasHong KongHungaryIndiaIndonesiaIranIraqIrelandIsraelItalyJamaicaJapanJordanKazakhstanKenyaKoreaKuwaitLaosLatin AmericaLatviaLebanonLiberiaLithuaniaMalaysiaMexicoMicronesiaMiddle AfricaMoldovaMoroccoNepalNetherlandsNicaraguaNigeriaNorth AmericaNorth MacedoniaNorthern AfricaNorthern EuropeNorwayOceaniaPakistanPanamaPeruPhilippinesPolandPortugalRomaniaRussiaSaudi ArabiaScotlandSenegalSerbiaSierra LeoneSingaporeSomaliaSouth AfricaSouth AmericaSouth Central AsiaSouth Eastern AsiaSouthern EuropeSpainSri LankaSt. Vincent and the GrenadinesSudanSwedenSwitzerlandSyriaTaiwanThailandTrinidad and TobagoTurkeyUgandaUkraineUruguayUzbekistanVenezuelaVietnamWest IndiesWestern AfricaWestern AsiaWestern EuropeYemenZaireZimbabweAzores
Select to Compare
Race
Ancestry
AfghanAfricanAlaska NativeAlaskan AthabascanAlbanianAleutAlsatianAmericanApacheArabArapahoArgentineanArmenianAssyrian/Chaldean/SyriacAustralianAustrianBahamianBangladeshiBarbadianBasqueBelgianBelizeanBermudanBhutaneseBlackfeetBolivianBrazilianBritishBritish West IndianBulgarianBurmeseCajunCambodianCanadianCape VerdeanCarpatho RusynCelticCentral AmericanCentral American IndianCherokeeCheyenneChickasawChileanChineseChippewaChoctawColombianColvilleComancheCosta RicanCreeCreekCroatianCrowCubanCypriotCzechCzechoslovakianDanishDelawareDominicanDutchDutch West IndianEastern EuropeanEcuadorianEgyptianEnglishEstonianEthiopianEuropeanFijianFilipinoFinnishFrenchFrench American IndianFrench CanadianGermanGerman RussianGhanaianGreekGuamanian/ChamorroGuatemalanGuyaneseHaitianHmongHonduranHopiHoumaHungarianIcelanderIndian (Asian)IndonesianInupiatIranianIraqiIrishIroquoisIsraeliItalianJamaicanJapaneseJordanianKenyanKoreanLaotianLatvianLebaneseLiberianLithuanianLumbeeLuxembourgerMacedonianMalaysianMalteseMarshalleseMenomineeMexicanMexican American IndianMongolianMoroccanNative HawaiianNavajoNepaleseNew ZealanderNicaraguanNigerianNorthern EuropeanNorwegianOkinawanOsageOttawaPaiutePakistaniPalestinianPanamanianParaguayanPennsylvania GermanPeruvianPimaPolishPortuguesePotawatomiPuebloPuerto RicanPuget Sound SalishRomanianRussianSalvadoranSamoanScandinavianScotch-IrishScottishSeminoleSenegaleseSerbianShoshoneSierra LeoneanSiouxSlavicSlovakSloveneSomaliSouth AfricanSouth AmericanSouth American IndianSoviet UnionSpaniardSpanishSpanish AmericanSpanish American IndianSri LankanSubsaharan AfricanSudaneseSwedishSwissSyrianTaiwaneseThaiTlingit-HaidaTohono O'OdhamTonganTrinidadian and TobagonianTsimshianTurkishU.S. Virgin IslanderUgandanUkrainianUruguayanUteVenezuelanVietnameseWelshWest IndianYakamaYaquiYugoslavianYumanYup'ikZimbabwean
Immigration
NonimmigrantsImmigrantsAfghanistanAfricaAlbaniaArgentinaArmeniaAsiaAustraliaAustriaBahamasBangladeshBarbadosBelarusBelgiumBelizeBoliviaBosnia and HerzegovinaBrazilBulgariaBurma/MyanmarCabo VerdeCambodiaCameroonCanadaCaribbeanCentral AmericaChileChinaColombiaCongoCosta RicaCroatiaCubaCzechoslovakiaDenmarkDominicaDominican RepublicEastern AfricaEastern AsiaEastern EuropeEcuadorEgyptEl SalvadorEnglandEritreaEthiopiaEuropeFijiFranceGermanyGhanaGreeceGrenadaGuatemalaGuyanaHaitiHondurasHong KongHungaryIndiaIndonesiaIranIraqIrelandIsraelItalyJamaicaJapanJordanKazakhstanKenyaKoreaKuwaitLaosLatin AmericaLatviaLebanonLiberiaLithuaniaMalaysiaMexicoMicronesiaMiddle AfricaMoldovaMoroccoNepalNetherlandsNicaraguaNigeriaNorth AmericaNorth MacedoniaNorthern AfricaNorthern EuropeNorwayOceaniaPakistanPanamaPeruPhilippinesPolandPortugalRomaniaRussiaSaudi ArabiaScotlandSenegalSerbiaSierra LeoneSingaporeSomaliaSouth AfricaSouth AmericaSouth Central AsiaSouth Eastern AsiaSouthern EuropeSpainSri LankaSt. Vincent and the GrenadinesSudanSwedenSwitzerlandSyriaTaiwanThailandTrinidad and TobagoTurkeyUgandaUkraineUruguayUzbekistanVenezuelaVietnamWest IndiesWestern AfricaWestern AsiaWestern EuropeYemenZaireZimbabweAzores
Single Female Poverty
Income
Poverty
Unemployment
Labor Participation
Family Structure
Vehicle Availability
Education Level
Disability

Kiowa Single Female Poverty
Tragic

26.9%
POVERTY | SINGLE FEMALES
0.0/ 100
METRIC RATING
324th/ 347
METRIC RANK

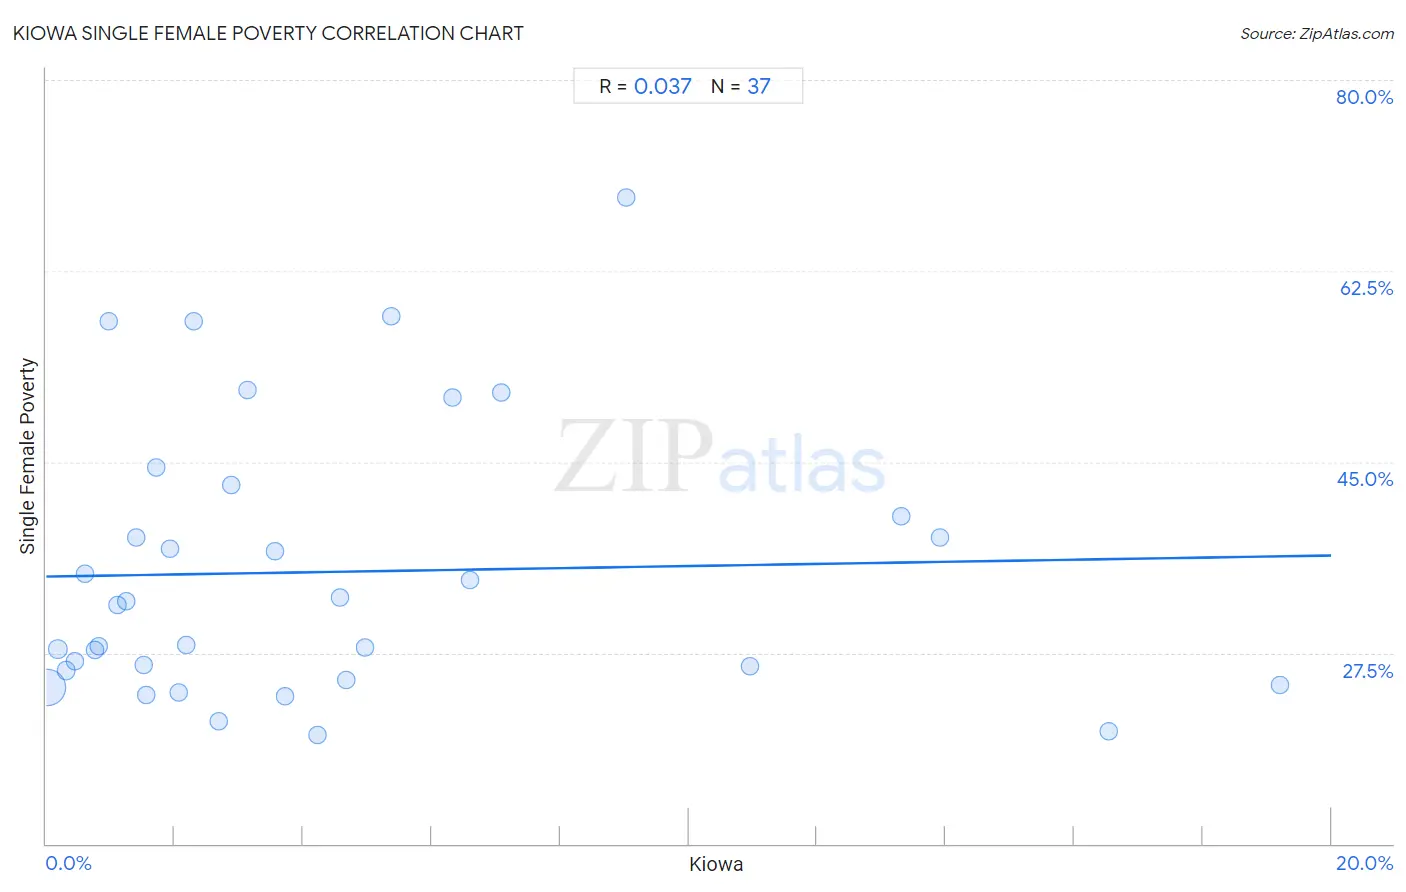
Kiowa Single Female Poverty Correlation Chart

The statistical analysis conducted on geographies consisting of 55,984,677 people shows no correlation between the proportion of Kiowa and poverty level among single females in the United States with a correlation coefficient (R) of 0.037 and weighted average of 26.9%. On average, for every 1% (one percent) increase in Kiowa within a typical geography, there is an increase of 0.097% in poverty level among single females.
Kiowa Single Female Poverty
It is essential to understand that the correlation between the percentage of Kiowa and poverty level among single females does not imply a direct cause-and-effect relationship. It remains uncertain whether the presence of Kiowa influences an upward or downward trend in the level of poverty level among single females within an area, or if Kiowa simply ended up residing in those areas with higher or lower levels of poverty level among single females due to other factors.

Demographics Similar to Kiowa by Single Female Poverty

In terms of single female poverty, the demographic groups most similar to Kiowa are Chippewa (26.8%, a difference of 0.41%), Seminole (26.8%, a difference of 0.52%), Choctaw (27.2%, a difference of 0.98%), Yup'ik (26.6%, a difference of 1.3%), and Creek (27.4%, a difference of 1.9%).
DemographicsRating | RankSingle Female Poverty
Ottawa
0.0
/100
|
#317
Tragic
26.0%
Chickasaw
0.0
/100
|
#318
Tragic
26.3%
Blacks/African Americans
0.0
/100
|
#319
Tragic
26.4%
Arapaho
0.0
/100
|
#320
Tragic
26.4%
Yup'ik
0.0
/100
|
#321
Tragic
26.6%
Seminole
0.0
/100
|
#322
Tragic
26.8%
Chippewa
0.0
/100
|
#323
Tragic
26.8%
Kiowa
0.0
/100
|
#324
Tragic
26.9%
Choctaw
0.0
/100
|
#325
Tragic
27.2%
Creek
0.0
/100
|
#326
Tragic
27.4%
Dutch West Indians
0.0
/100
|
#327
Tragic
27.5%
Apache
0.0
/100
|
#328
Tragic
27.7%
Menominee
0.0
/100
|
#329
Tragic
27.8%
Hopi
0.0
/100
|
#330
Tragic
28.0%
Natives/Alaskans
0.0
/100
|
#331
Tragic
28.2%

Kiowa Single Female Poverty Correlation Summary

MeasurementKiowa DataSingle Female Poverty Data
Minimum0.014%20.0%
Maximum19.2%69.2%
Range19.2%49.2%
Mean4.4%34.9%
Median2.7%31.9%
Interquartile 25% (IQ1)1.2%25.4%
Interquartile 75% (IQ3)5.8%41.4%
Interquartile Range (IQR)4.7%16.0%
Standard Deviation (Sample)4.8%12.6%
Standard Deviation (Population)4.7%12.4%

Correlation Details

Kiowa PercentileSample SizeSingle Female Poverty
[
0.0%
-
0.5%
]
0.014%
53,147,63624.3%
[
0.0%
-
0.5%
]
0.18%
1,488,48327.8%
[
0.0%
-
0.5%
]
0.31%
592,26025.9%
[
0.0%
-
0.5%
]
0.45%
321,15326.7%
[
0.5%
-
1.0%
]
0.60%
91,59934.7%
[
0.5%
-
1.0%
]
0.75%
42,63027.8%
[
0.5%
-
1.0%
]
0.82%
111,87728.1%
[
0.5%
-
1.0%
]
0.98%
3,05957.9%
[
1.0%
-
1.5%
]
1.11%
95,35631.9%
[
1.0%
-
1.5%
]
1.25%
9,61932.2%
[
1.0%
-
1.5%
]
1.40%
1,71338.0%
[
1.5%
-
2.0%
]
1.51%
2,45226.3%
[
1.5%
-
2.0%
]
1.57%
21,91123.6%
[
1.5%
-
2.0%
]
1.70%
17644.4%
[
1.5%
-
2.0%
]
1.93%
21,97137.1%
[
2.0%
-
2.5%
]
2.07%
1,06523.8%
[
2.0%
-
2.5%
]
2.17%
1,19628.3%
[
2.0%
-
2.5%
]
2.30%
1,08857.9%
[
2.5%
-
3.0%
]
2.68%
78321.2%
[
2.5%
-
3.0%
]
2.88%
80042.9%
[
3.0%
-
3.5%
]
3.14%
54251.6%
[
3.5%
-
4.0%
]
3.56%
47836.8%
[
3.5%
-
4.0%
]
3.72%
1,61323.6%
[
4.0%
-
4.5%
]
4.22%
16620.0%
[
4.5%
-
5.0%
]
4.58%
96132.6%
[
4.5%
-
5.0%
]
4.68%
27825.0%
[
4.5%
-
5.0%
]
4.95%
94928.0%
[
5.0%
-
5.5%
]
5.36%
37358.3%
[
6.0%
-
6.5%
]
6.32%
1,37750.9%
[
6.5%
-
7.0%
]
6.59%
1,15434.1%
[
7.0%
-
7.5%
]
7.08%
1,52651.4%
[
9.0%
-
9.5%
]
9.02%
49969.2%
[
10.5%
-
11.0%
]
10.96%
29226.3%
[
13.0%
-
13.5%
]
13.31%
1,58540.0%
[
13.5%
-
14.0%
]
13.91%
2,30138.1%
[
16.5%
-
17.0%
]
16.54%
8,03320.4%
[
19.0%
-
19.5%
]
19.20%
5,72324.5%