Immigrants from Guyana vs Immigrants from Bulgaria Disability Age 5 to 17
COMPARE
Immigrants from Guyana
Immigrants from Bulgaria
Disability Age 5 to 17
Disability Age 5 to 17 Comparison
Immigrants from Guyana
Immigrants from Bulgaria
5.2%
DISABILITY AGE 5 TO 17
99.6/ 100
METRIC RATING
76th/ 347
METRIC RANK
5.4%
DISABILITY AGE 5 TO 17
94.0/ 100
METRIC RATING
130th/ 347
METRIC RANK
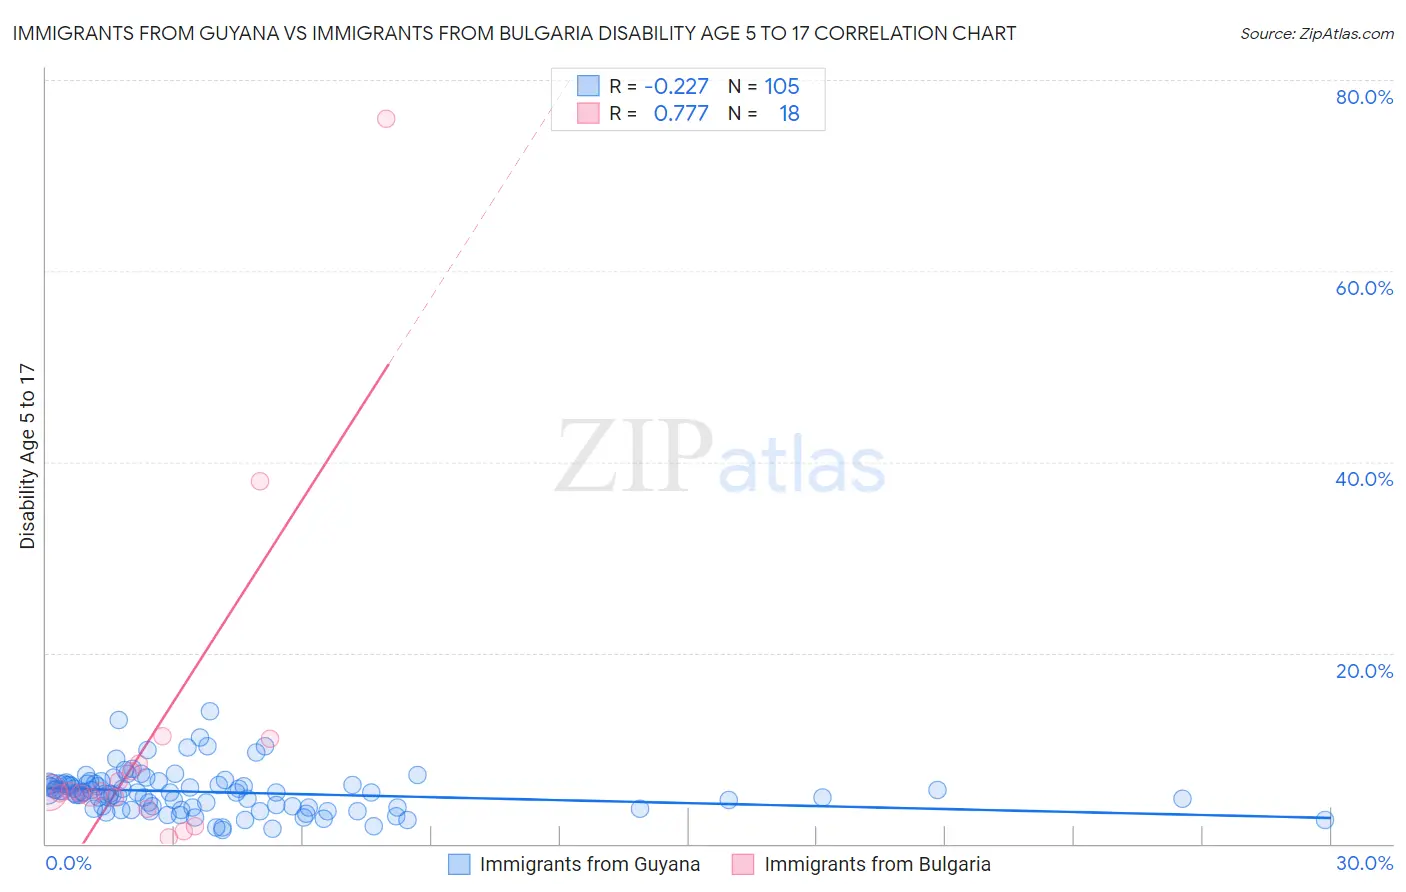
Immigrants from Guyana vs Immigrants from Bulgaria Disability Age 5 to 17 Correlation Chart
The statistical analysis conducted on geographies consisting of 183,069,872 people shows a weak negative correlation between the proportion of Immigrants from Guyana and percentage of population with a disability between the ages 5 and 17 in the United States with a correlation coefficient (R) of -0.227 and weighted average of 5.2%. Similarly, the statistical analysis conducted on geographies consisting of 171,828,354 people shows a strong positive correlation between the proportion of Immigrants from Bulgaria and percentage of population with a disability between the ages 5 and 17 in the United States with a correlation coefficient (R) of 0.777 and weighted average of 5.4%, a difference of 3.7%.
Disability Age 5 to 17 Correlation Summary
| Measurement | Immigrants from Guyana | Immigrants from Bulgaria |
| Minimum | 1.5% | 0.67% |
| Maximum | 13.9% | 76.0% |
| Range | 12.4% | 75.3% |
| Mean | 5.4% | 11.3% |
| Median | 5.3% | 5.4% |
| Interquartile 25% (IQ1) | 3.8% | 4.8% |
| Interquartile 75% (IQ3) | 6.3% | 8.4% |
| Interquartile Range (IQR) | 2.5% | 3.6% |
| Standard Deviation (Sample) | 2.3% | 18.1% |
| Standard Deviation (Population) | 2.2% | 17.6% |
Similar Demographics by Disability Age 5 to 17
Demographics Similar to Immigrants from Guyana by Disability Age 5 to 17
In terms of disability age 5 to 17, the demographic groups most similar to Immigrants from Guyana are Immigrants from Kazakhstan (5.2%, a difference of 0.030%), Immigrants from Moldova (5.2%, a difference of 0.040%), Immigrants from Cuba (5.2%, a difference of 0.040%), Afghan (5.2%, a difference of 0.070%), and Sri Lankan (5.2%, a difference of 0.10%).
| Demographics | Rating | Rank | Disability Age 5 to 17 |
| Guyanese | 99.7 /100 | #69 | Exceptional 5.2% |
| Immigrants | Belgium | 99.7 /100 | #70 | Exceptional 5.2% |
| Jordanians | 99.7 /100 | #71 | Exceptional 5.2% |
| Immigrants | Vietnam | 99.7 /100 | #72 | Exceptional 5.2% |
| Immigrants | Czechoslovakia | 99.7 /100 | #73 | Exceptional 5.2% |
| Immigrants | Romania | 99.7 /100 | #74 | Exceptional 5.2% |
| Immigrants | Moldova | 99.6 /100 | #75 | Exceptional 5.2% |
| Immigrants | Guyana | 99.6 /100 | #76 | Exceptional 5.2% |
| Immigrants | Kazakhstan | 99.6 /100 | #77 | Exceptional 5.2% |
| Immigrants | Cuba | 99.6 /100 | #78 | Exceptional 5.2% |
| Afghans | 99.6 /100 | #79 | Exceptional 5.2% |
| Sri Lankans | 99.6 /100 | #80 | Exceptional 5.2% |
| Native Hawaiians | 99.6 /100 | #81 | Exceptional 5.2% |
| Immigrants | Sweden | 99.5 /100 | #82 | Exceptional 5.2% |
| Immigrants | France | 99.5 /100 | #83 | Exceptional 5.2% |
Demographics Similar to Immigrants from Bulgaria by Disability Age 5 to 17
In terms of disability age 5 to 17, the demographic groups most similar to Immigrants from Bulgaria are Romanian (5.4%, a difference of 0.020%), Immigrants from Venezuela (5.4%, a difference of 0.11%), New Zealander (5.4%, a difference of 0.23%), Latvian (5.4%, a difference of 0.23%), and Arab (5.4%, a difference of 0.23%).
| Demographics | Rating | Rank | Disability Age 5 to 17 |
| Immigrants | Ethiopia | 95.5 /100 | #123 | Exceptional 5.4% |
| Crow | 95.0 /100 | #124 | Exceptional 5.4% |
| Immigrants | Chile | 95.0 /100 | #125 | Exceptional 5.4% |
| New Zealanders | 95.0 /100 | #126 | Exceptional 5.4% |
| Latvians | 95.0 /100 | #127 | Exceptional 5.4% |
| Immigrants | Venezuela | 94.5 /100 | #128 | Exceptional 5.4% |
| Romanians | 94.1 /100 | #129 | Exceptional 5.4% |
| Immigrants | Bulgaria | 94.0 /100 | #130 | Exceptional 5.4% |
| Arabs | 92.9 /100 | #131 | Exceptional 5.4% |
| Immigrants | Colombia | 92.9 /100 | #132 | Exceptional 5.4% |
| Venezuelans | 92.7 /100 | #133 | Exceptional 5.4% |
| Yuman | 92.3 /100 | #134 | Exceptional 5.4% |
| Immigrants | Belize | 91.7 /100 | #135 | Exceptional 5.4% |
| Immigrants | Denmark | 91.4 /100 | #136 | Exceptional 5.4% |
| Navajo | 90.9 /100 | #137 | Exceptional 5.4% |