Earnings by Sex by Educational Attainment in Hissop
Educational Attainment
Male Income
Female Income
Less than High School
-
-
High School Diploma
-
-
College or Associate's Degree
-
-
Bachelor's Degree
-
-
Graduate Degree
-
-
Total
-
-
Family Income in Hissop
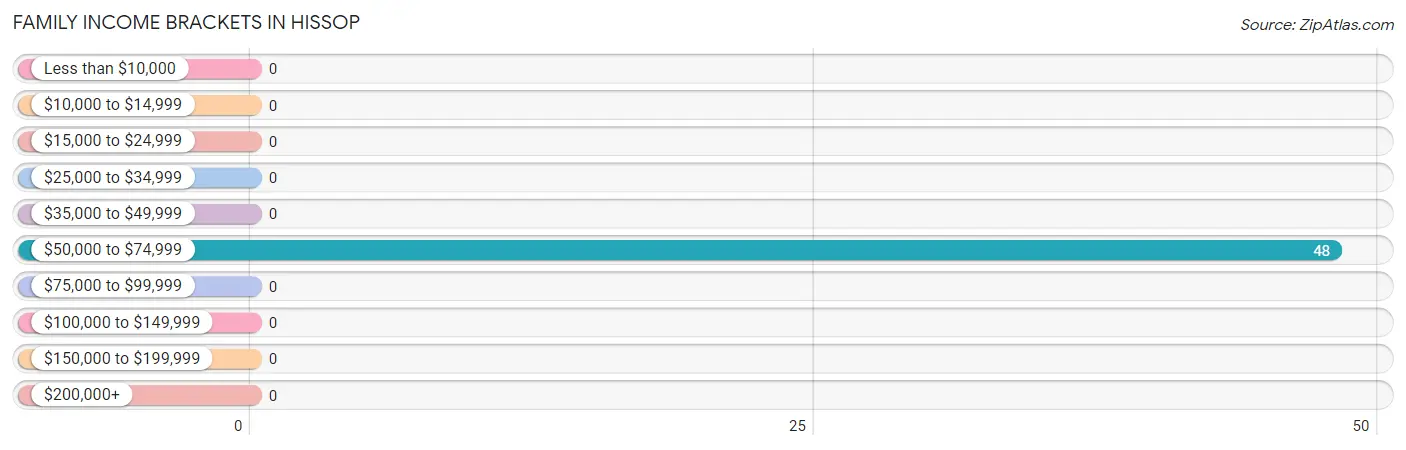
Family Income Brackets in Hissop
According to the Hissop family income data, there are 48 families falling into the $50,000 to $74,999 income range, which is the most common income bracket and makes up 100.0% of all families.
Income Bracket
# Families
% Families
Less than $10,000
0
0.0%
$10,000 to $14,999
0
0.0%
$15,000 to $24,999
0
0.0%
$25,000 to $34,999
0
0.0%
$35,000 to $49,999
0
0.0%
$50,000 to $74,999
48
100.0%
$75,000 to $99,999
0
0.0%
$100,000 to $149,999
0
0.0%
$150,000 to $199,999
0
0.0%
$200,000+
0
0.0%
Family Income by Famaliy Size in Hissop
Income Bracket
# Families
Median Income
2-Person Families
48 (100.0%)
$0
3-Person Families
0 (0.0%)
$0
4-Person Families
0 (0.0%)
$0
5-Person Families
0 (0.0%)
$0
6-Person Families
0 (0.0%)
$0
7+ Person Families
0 (0.0%)
$0
Total
48 (100.0%)
$0
Family Income by Number of Earners in Hissop
Number of Earners
# Families
Median Income
No Earners
0 (0.0%)
$0
1 Earner
48 (100.0%)
$0
2 Earners
0 (0.0%)
$0
3+ Earners
0 (0.0%)
$0
Total
48 (100.0%)
$0
Household Income in Hissop
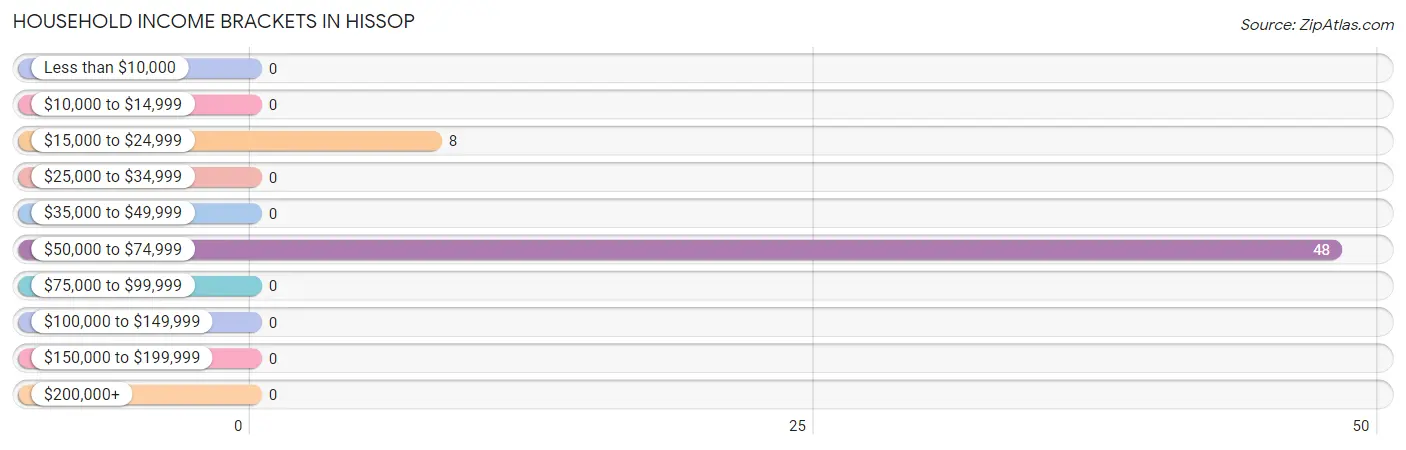
Household Income Brackets in Hissop
With 48 households falling in the category, the $50,000 to $74,999 income range is the most frequent in Hissop, accounting for 85.7% of all households.
Income Bracket
# Households
% Households
Less than $10,000
0
0.0%
$10,000 to $14,999
0
0.0%
$15,000 to $24,999
8
14.3%
$25,000 to $34,999
0
0.0%
$35,000 to $49,999
0
0.0%
$50,000 to $74,999
48
85.7%
$75,000 to $99,999
0
0.0%
$100,000 to $149,999
0
0.0%
$150,000 to $199,999
0
0.0%
$200,000+
0
0.0%
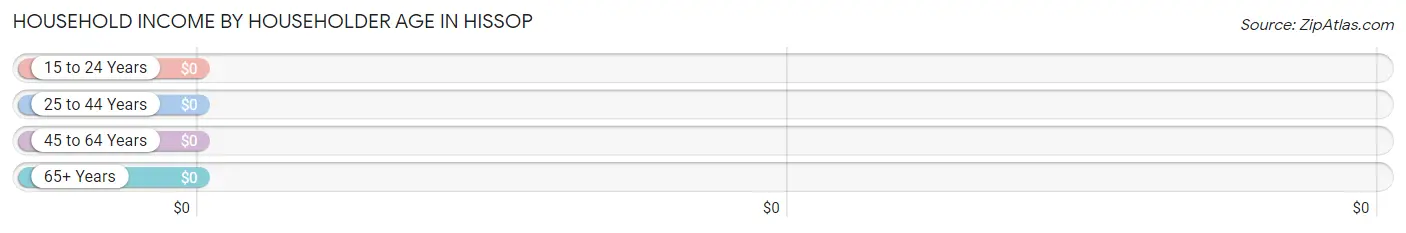
Household Income by Householder Age in Hissop
Income Bracket
# Households
Median Income
15 to 24 Years
0 (0.0%)
$0
25 to 44 Years
0 (0.0%)
$0
45 to 64 Years
48 (85.7%)
$0
65+ Years
8 (14.3%)
$0
Total
56 (100.0%)
$0
Poverty in Hissop
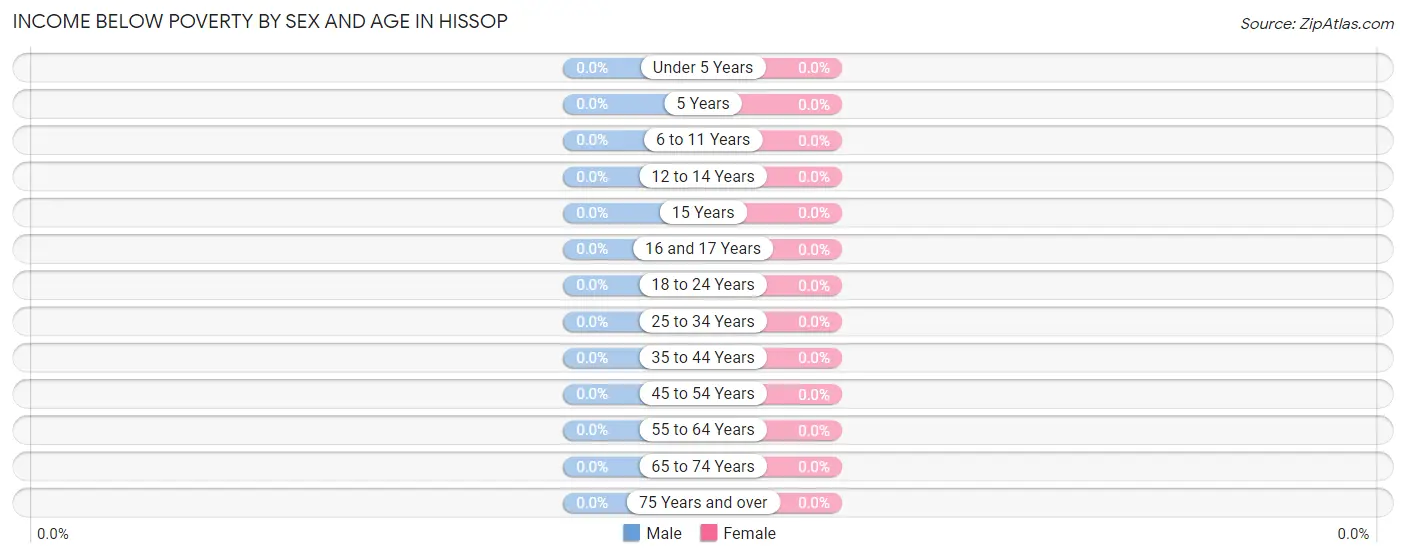
Income Below Poverty by Sex and Age in Hissop
Age Bracket
Male
Female
Under 5 Years
0 (0.0%)
0 (0.0%)
5 Years
0 (0.0%)
0 (0.0%)
6 to 11 Years
0 (0.0%)
0 (0.0%)
12 to 14 Years
0 (0.0%)
0 (0.0%)
15 Years
0 (0.0%)
0 (0.0%)
16 and 17 Years
0 (0.0%)
0 (0.0%)
18 to 24 Years
0 (0.0%)
0 (0.0%)
25 to 34 Years
0 (0.0%)
0 (0.0%)
35 to 44 Years
0 (0.0%)
0 (0.0%)
45 to 54 Years
0 (0.0%)
0 (0.0%)
55 to 64 Years
0 (0.0%)
0 (0.0%)
65 to 74 Years
0 (0.0%)
0 (0.0%)
75 Years and over
0 (0.0%)
0 (0.0%)
Total
0 (0.0%)
0 (0.0%)
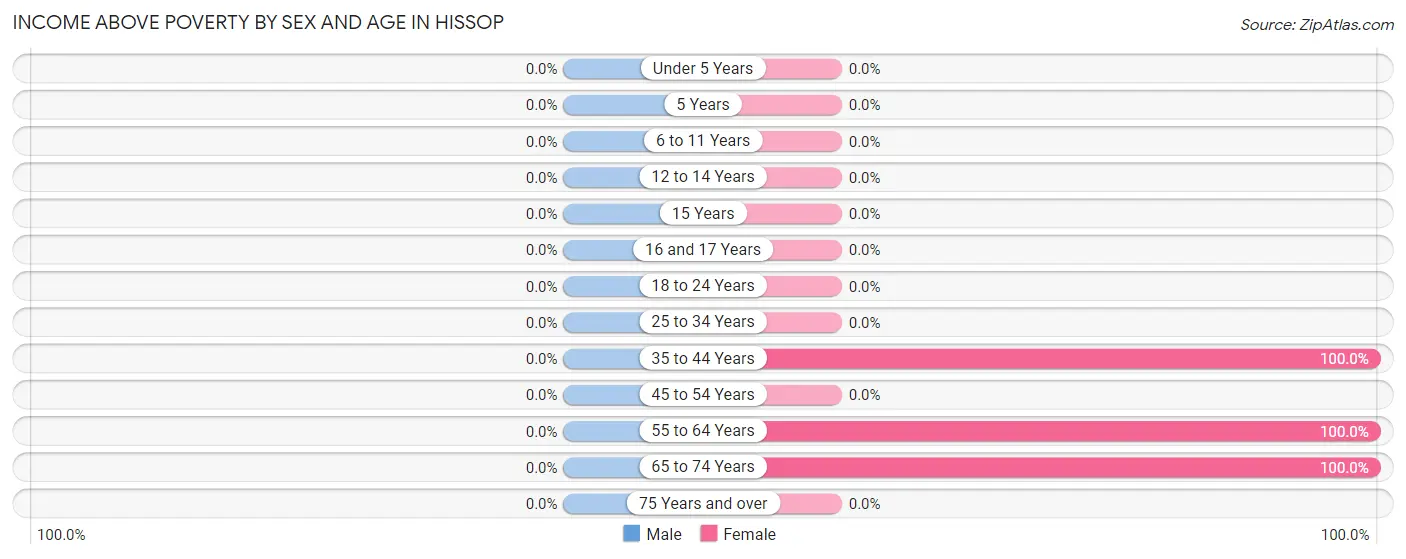
Income Above Poverty by Sex and Age in Hissop
Age Bracket
Male
Female
Under 5 Years
0 (0.0%)
0 (0.0%)
5 Years
0 (0.0%)
0 (0.0%)
6 to 11 Years
0 (0.0%)
0 (0.0%)
12 to 14 Years
0 (0.0%)
0 (0.0%)
15 Years
0 (0.0%)
0 (0.0%)
16 and 17 Years
0 (0.0%)
0 (0.0%)
18 to 24 Years
0 (0.0%)
0 (0.0%)
25 to 34 Years
0 (0.0%)
0 (0.0%)
35 to 44 Years
0 (0.0%)
65 (100.0%)
45 to 54 Years
0 (0.0%)
0 (0.0%)
55 to 64 Years
0 (0.0%)
48 (100.0%)
65 to 74 Years
0 (0.0%)
8 (100.0%)
75 Years and over
0 (0.0%)
0 (0.0%)
Total
0 (0.0%)
121 (100.0%)
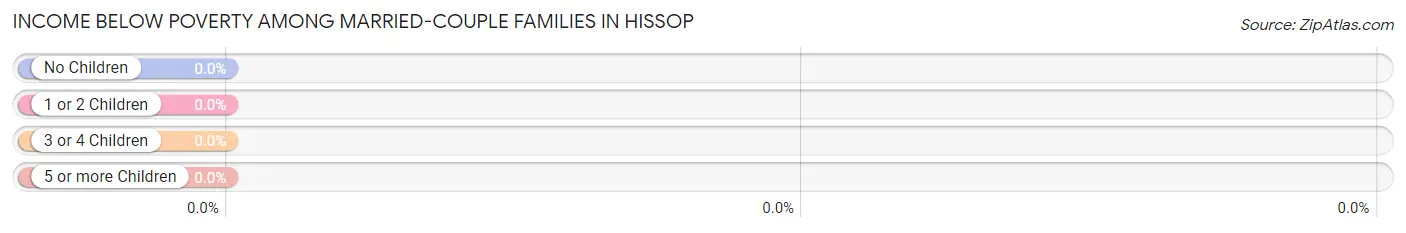
Income Below Poverty Among Married-Couple Families in Hissop
Children
Above Poverty
Below Poverty
No Children
0 (0.0%)
0 (0.0%)
1 or 2 Children
0 (0.0%)
0 (0.0%)
3 or 4 Children
0 (0.0%)
0 (0.0%)
5 or more Children
0 (0.0%)
0 (0.0%)
Total
0 (0.0%)
0 (0.0%)
Income Below Poverty Among Single-Parent Households in Hissop
Children
Single Father
Single Mother
No Children
0 (0.0%)
0 (0.0%)
1 or 2 Children
0 (0.0%)
0 (0.0%)
3 or 4 Children
0 (0.0%)
0 (0.0%)
5 or more Children
0 (0.0%)
0 (0.0%)
Total
0 (0.0%)
0 (0.0%)
Income Below Poverty Among Married-Couple vs Single-Parent Households in Hissop
Children
Married-Couple Families
Single-Parent Households
No Children
0 (0.0%)
0 (0.0%)
1 or 2 Children
0 (0.0%)
0 (0.0%)
3 or 4 Children
0 (0.0%)
0 (0.0%)
5 or more Children
0 (0.0%)
0 (0.0%)
Total
0 (0.0%)
0 (0.0%)
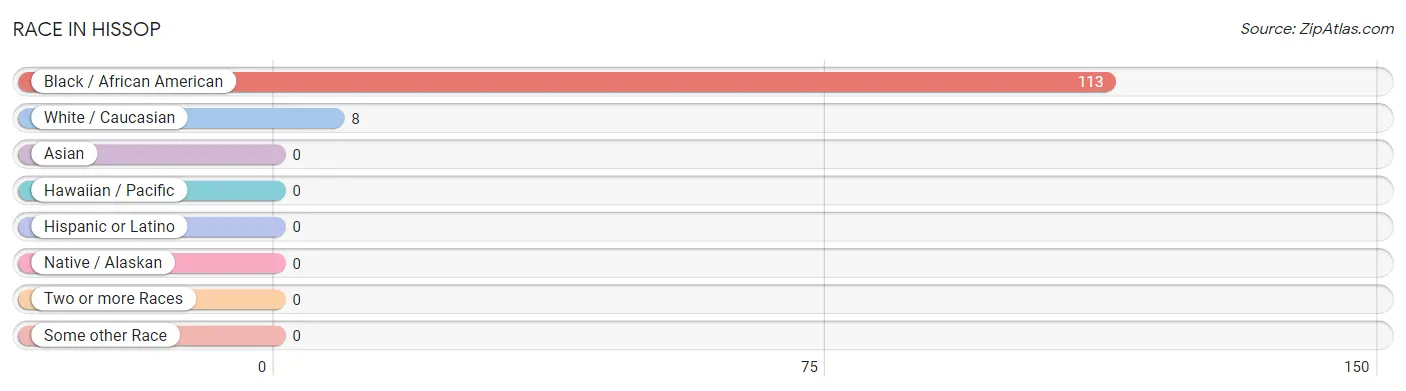
Race in Hissop
The most populous races in Hissop are Black / African American (113 | 93.4%), and White / Caucasian (8 | 6.6%).
Race
# Population
% Population
Asian
0
0.0%
Black / African American
113
93.4%
Hawaiian / Pacific
0
0.0%
Hispanic or Latino
0
0.0%
Native / Alaskan
0
0.0%
White / Caucasian
8
6.6%
Two or more Races
0
0.0%
Some other Race
0
0.0%
Total
121
100.0%
Ancestry in Hissop
Ancestry
# Population
% Population
View All 0 Rows
Immigrants in Hissop
Immigration Origin
# Population
% Population
View All 0 Rows
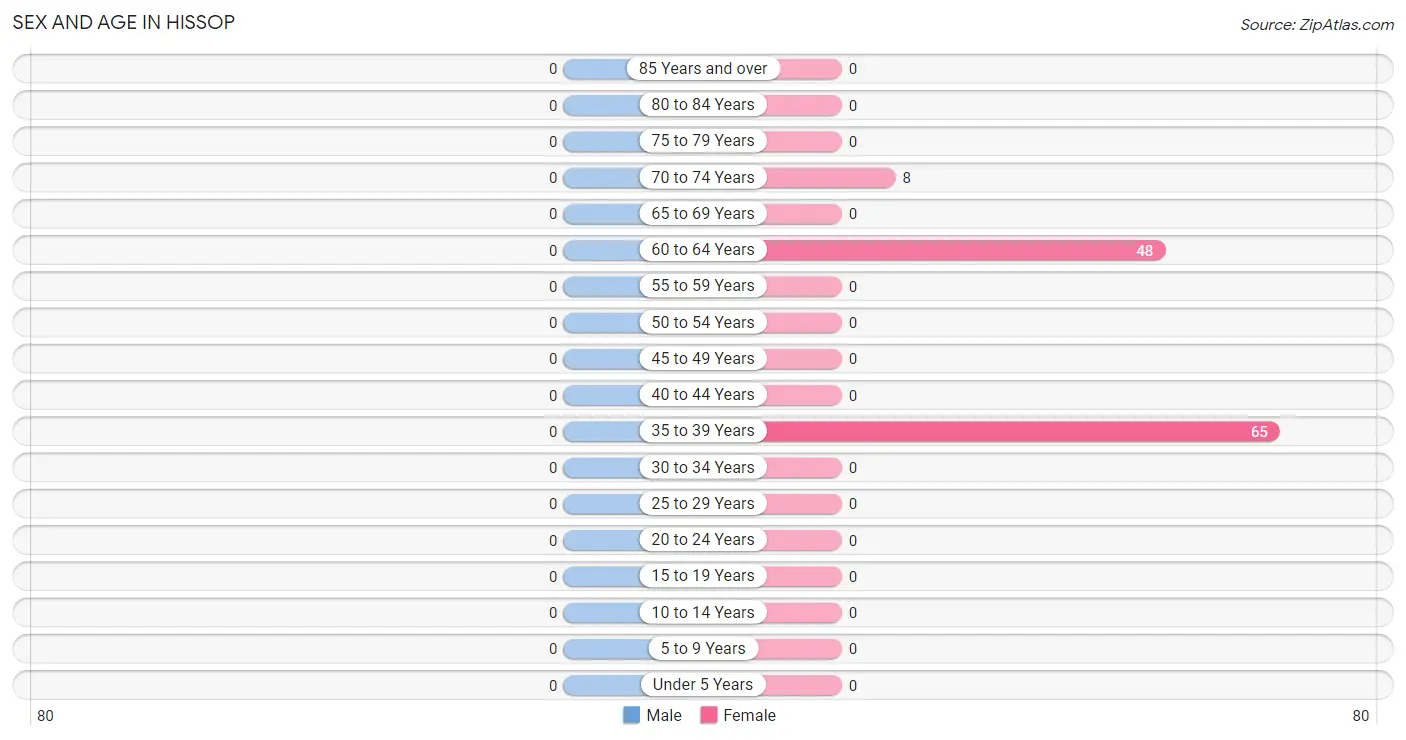
Sex and Age in Hissop
Sex and Age in Hissop
Age Bracket
Male
Female
Under 5 Years
0 (0.0%)
0 (0.0%)
5 to 9 Years
0 (0.0%)
0 (0.0%)
10 to 14 Years
0 (0.0%)
0 (0.0%)
15 to 19 Years
0 (0.0%)
0 (0.0%)
20 to 24 Years
0 (0.0%)
0 (0.0%)
25 to 29 Years
0 (0.0%)
0 (0.0%)
30 to 34 Years
0 (0.0%)
0 (0.0%)
35 to 39 Years
0 (0.0%)
65 (53.7%)
40 to 44 Years
0 (0.0%)
0 (0.0%)
45 to 49 Years
0 (0.0%)
0 (0.0%)
50 to 54 Years
0 (0.0%)
0 (0.0%)
55 to 59 Years
0 (0.0%)
0 (0.0%)
60 to 64 Years
0 (0.0%)
48 (39.7%)
65 to 69 Years
0 (0.0%)
0 (0.0%)
70 to 74 Years
0 (0.0%)
8 (6.6%)
75 to 79 Years
0 (0.0%)
0 (0.0%)
80 to 84 Years
0 (0.0%)
0 (0.0%)
85 Years and over
0 (0.0%)
0 (0.0%)
Total
0 (0.0%)
121 (100.0%)
Families and Households in Hissop
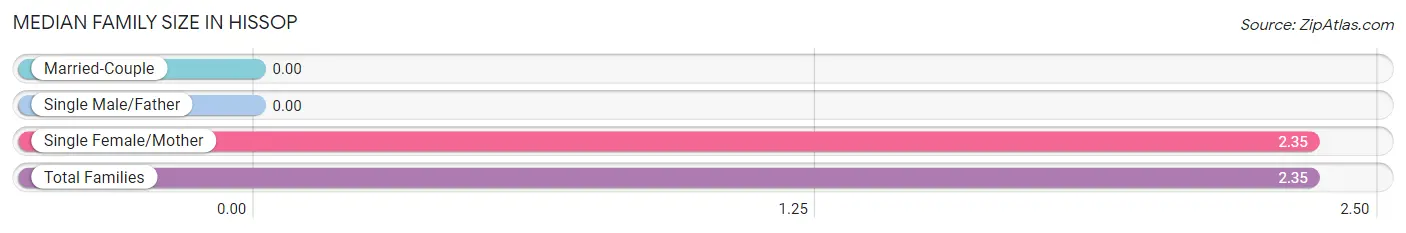
Median Family Size in Hissop
Family Type
# Families
Family Size
Married-Couple
0 (0.0%)
-
Single Male/Father
0 (0.0%)
-
Single Female/Mother
48 (100.0%)
2.35
Total Families
48 (100.0%)
2.35
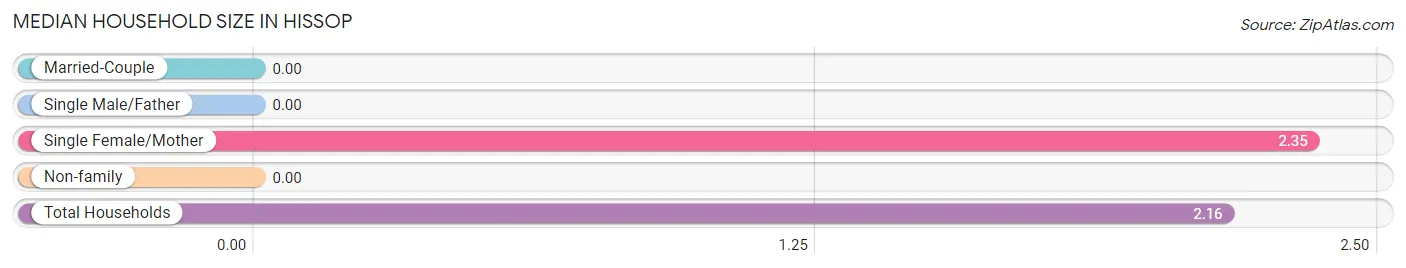
Median Household Size in Hissop
Household Type
# Households
Household Size
Married-Couple
0 (0.0%)
-
Single Male/Father
0 (0.0%)
-
Single Female/Mother
48 (85.7%)
2.35
Non-family
8 (14.3%)
-
Total Households
56 (100.0%)
2.16
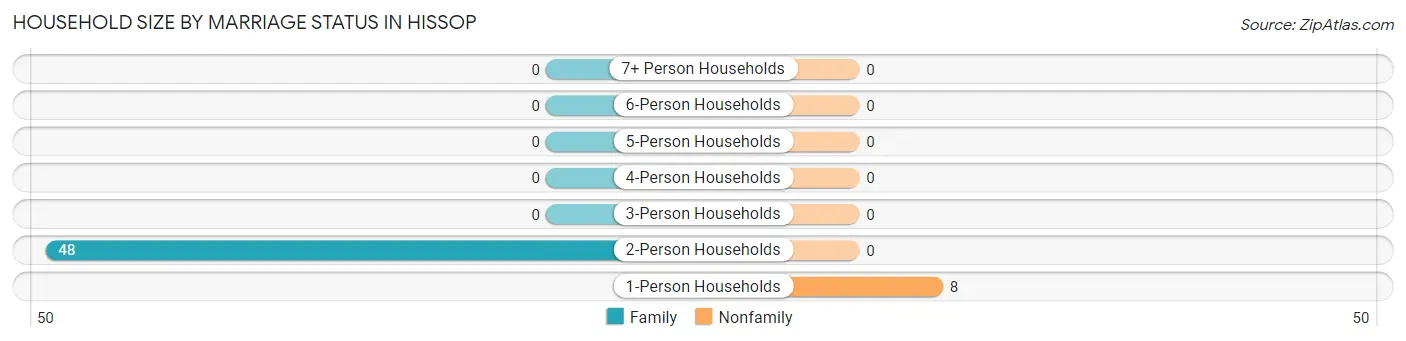
Household Size by Marriage Status in Hissop
Out of a total of 56 households in Hissop, 48 (85.7%) are family households, while 8 (14.3%) are nonfamily households. The most numerous type of family households are 2-person households, comprising 48, and the most common type of nonfamily households are 1-person households, comprising 8.
Household Size
Family Households
Nonfamily Households
1-Person Households
-
8 (14.3%)
2-Person Households
48 (85.7%)
0 (0.0%)
3-Person Households
0 (0.0%)
0 (0.0%)
4-Person Households
0 (0.0%)
0 (0.0%)
5-Person Households
0 (0.0%)
0 (0.0%)
6-Person Households
0 (0.0%)
0 (0.0%)
7+ Person Households
0 (0.0%)
0 (0.0%)
Total
48 (85.7%)
8 (14.3%)
Female Fertility in Hissop
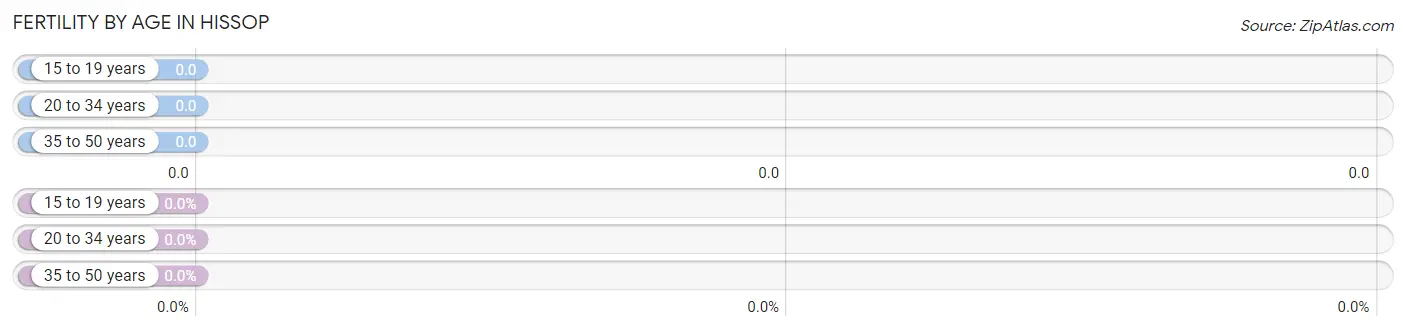
Fertility by Age in Hissop
Age Bracket
Women with Births
Births / 1,000 Women
15 to 19 years
0 (0.0%)
0.0
20 to 34 years
0 (0.0%)
0.0
35 to 50 years
0 (0.0%)
0.0
Total
0 (0.0%)
0.0
Fertility by Age by Marriage Status in Hissop
Age Bracket
Married
Unmarried
15 to 19 years
0 (0.0%)
0 (0.0%)
20 to 34 years
0 (0.0%)
0 (0.0%)
35 to 50 years
0 (0.0%)
0 (0.0%)
Total
0 (0.0%)
0 (0.0%)
Fertility by Education in Hissop
Educational Attainment
Women with Births
Births / 1,000 Women
Less than High School
0 (0.0%)
0.0
High School Diploma
0 (0.0%)
0.0
College or Associate's Degree
0 (0.0%)
0.0
Bachelor's Degree
0 (0.0%)
0.0
Graduate Degree
0 (0.0%)
0.0
Total
0 (0.0%)
0.0
Fertility by Education by Marriage Status in Hissop
Educational Attainment
Married
Unmarried
Less than High School
0 (0.0%)
0 (0.0%)
High School Diploma
0 (0.0%)
0 (0.0%)
College or Associate's Degree
0 (0.0%)
0 (0.0%)
Bachelor's Degree
0 (0.0%)
0 (0.0%)
Graduate Degree
0 (0.0%)
0 (0.0%)
Total
0 (0.0%)
0 (0.0%)
Employment Characteristics in Hissop
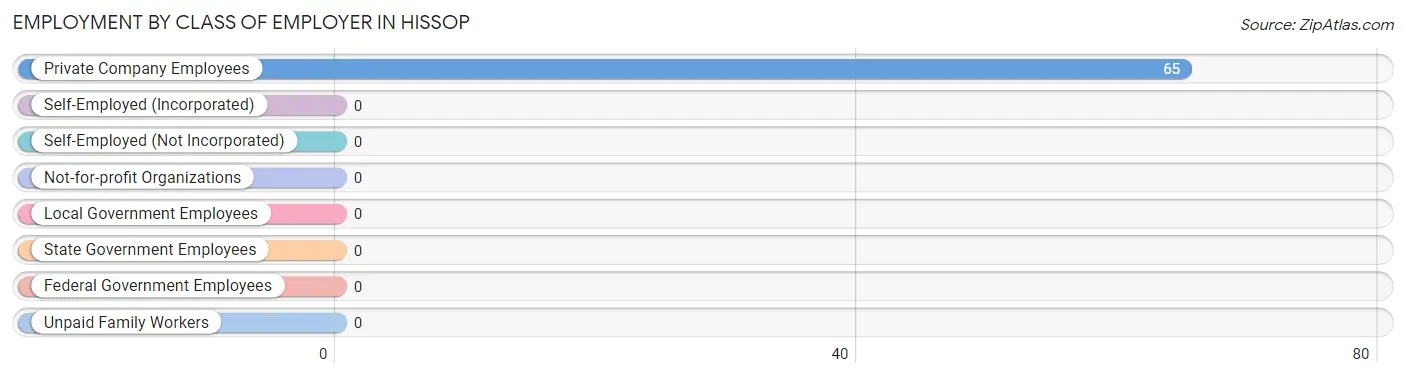
Employment by Class of Employer in Hissop
Among the 65 employed individuals in Hissop, , and private company employees (65 | 100.0%) make up the most common classes of employment.
Employer Class
# Employees
% Employees
Private Company Employees
65
100.0%
Self-Employed (Incorporated)
0
0.0%
Self-Employed (Not Incorporated)
0
0.0%
Not-for-profit Organizations
0
0.0%
Local Government Employees
0
0.0%
State Government Employees
0
0.0%
Federal Government Employees
0
0.0%
Unpaid Family Workers
0
0.0%
Total
65
100.0%
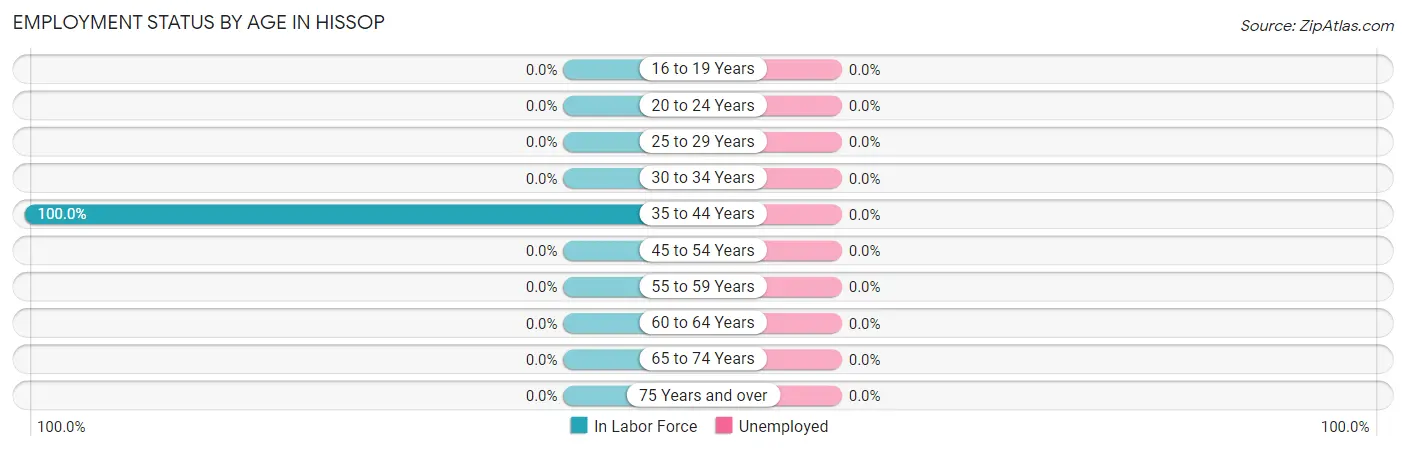
Employment Status by Age in Hissop
Age Bracket
In Labor Force
Unemployed
16 to 19 Years
0 (0.0%)
0 (0.0%)
20 to 24 Years
0 (0.0%)
0 (0.0%)
25 to 29 Years
0 (0.0%)
0 (0.0%)
30 to 34 Years
0 (0.0%)
0 (0.0%)
35 to 44 Years
65 (100.0%)
0 (0.0%)
45 to 54 Years
0 (0.0%)
0 (0.0%)
55 to 59 Years
0 (0.0%)
0 (0.0%)
60 to 64 Years
0 (0.0%)
0 (0.0%)
65 to 74 Years
0 (0.0%)
0 (0.0%)
75 Years and over
0 (0.0%)
0 (0.0%)
Total
65 (53.7%)
0 (0.0%)
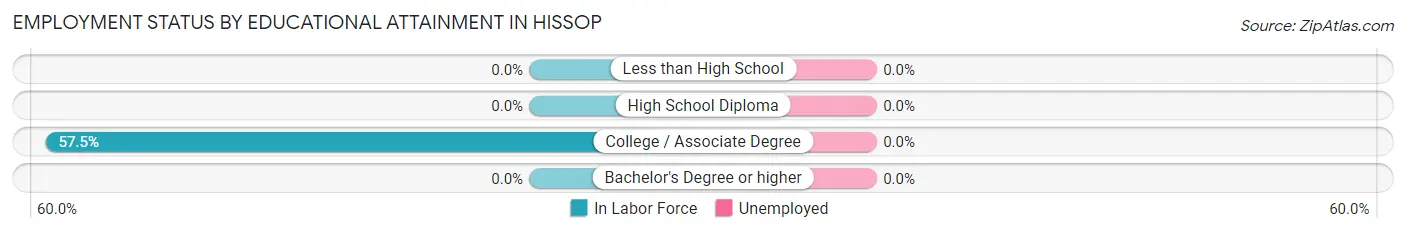
Employment Status by Educational Attainment in Hissop
Educational Attainment
In Labor Force
Unemployed
Less than High School
0 (0.0%)
0 (0.0%)
High School Diploma
0 (0.0%)
0 (0.0%)
College / Associate Degree
65 (57.5%)
0 (0.0%)
Bachelor's Degree or higher
0 (0.0%)
0 (0.0%)
Total
65 (57.5%)
0 (0.0%)
Employment Occupations by Sex in Hissop
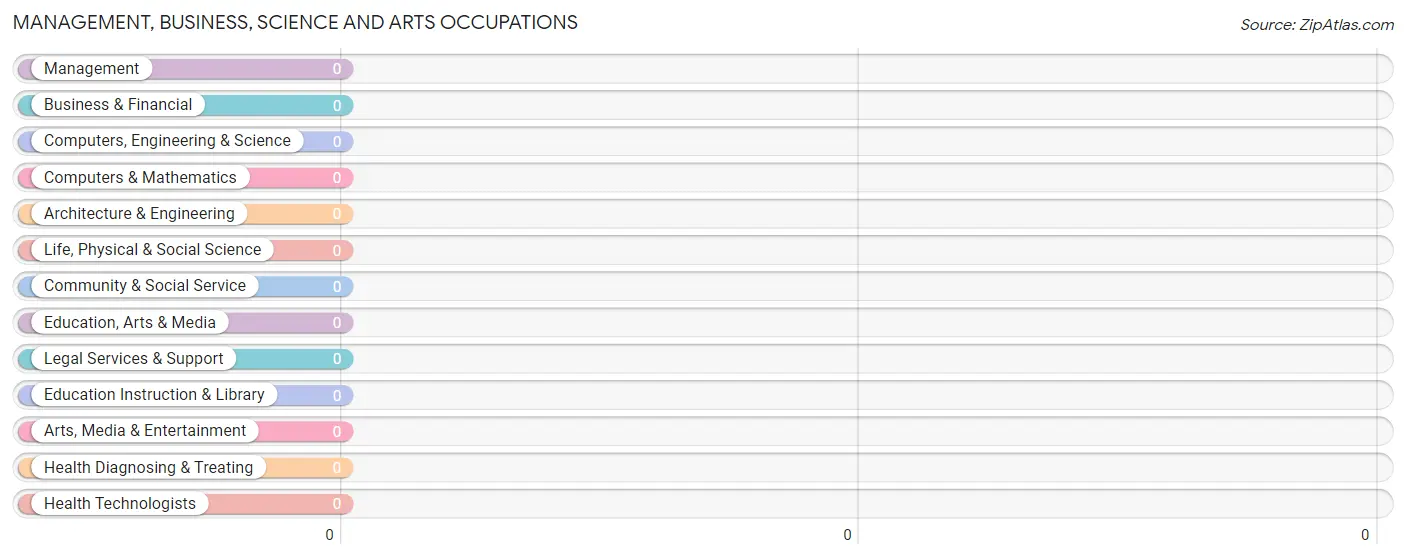
Management, Business, Science and Arts Occupations
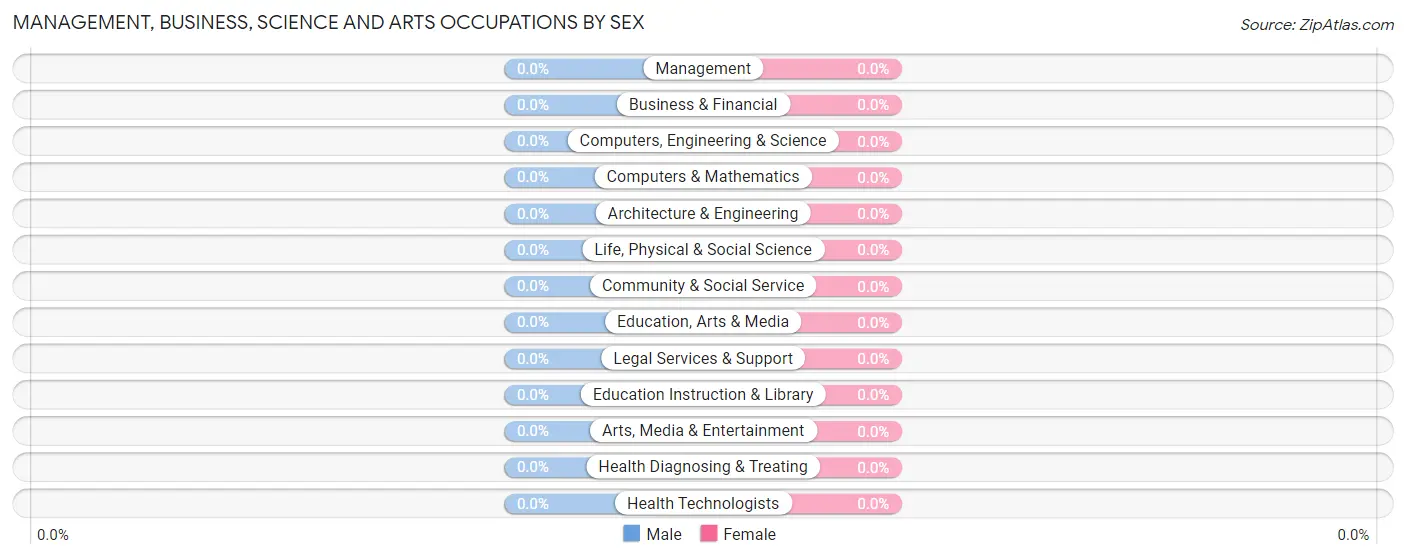
Management, Business, Science and Arts Occupations by Sex
Occupation
Male
Female
Management
0 (0.0%)
0 (0.0%)
Business & Financial
0 (0.0%)
0 (0.0%)
Computers, Engineering & Science
0 (0.0%)
0 (0.0%)
Computers & Mathematics
0 (0.0%)
0 (0.0%)
Architecture & Engineering
0 (0.0%)
0 (0.0%)
Life, Physical & Social Science
0 (0.0%)
0 (0.0%)
Community & Social Service
0 (0.0%)
0 (0.0%)
Education, Arts & Media
0 (0.0%)
0 (0.0%)
Legal Services & Support
0 (0.0%)
0 (0.0%)
Education Instruction & Library
0 (0.0%)
0 (0.0%)
Arts, Media & Entertainment
0 (0.0%)
0 (0.0%)
Health Diagnosing & Treating
0 (0.0%)
0 (0.0%)
Health Technologists
0 (0.0%)
0 (0.0%)
Total (Category)
0 (0.0%)
0 (0.0%)
Total (Overall)
0 (0.0%)
65 (100.0%)
Services Occupations
Services Occupations by Sex
Occupation
Male
Female
Healthcare Support
0 (0.0%)
0 (0.0%)
Security & Protection
0 (0.0%)
0 (0.0%)
Firefighting & Prevention
0 (0.0%)
0 (0.0%)
Law Enforcement
0 (0.0%)
0 (0.0%)
Food Preparation & Serving
0 (0.0%)
0 (0.0%)
Cleaning & Maintenance
0 (0.0%)
0 (0.0%)
Personal Care & Service
0 (0.0%)
0 (0.0%)
Total (Category)
0 (0.0%)
0 (0.0%)
Total (Overall)
0 (0.0%)
65 (100.0%)
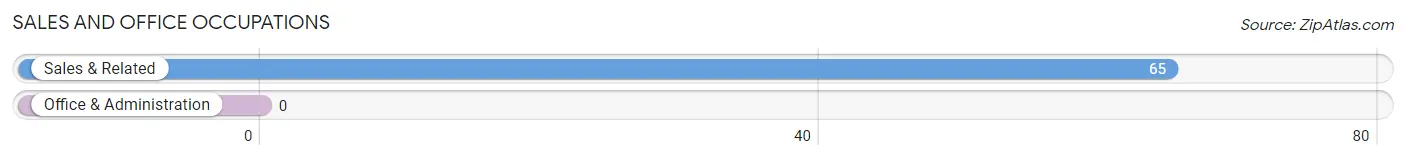
Sales and Office Occupations
The most common Sales and Office occupations in Hissop are , and Sales & Related (65 | 100.0%).
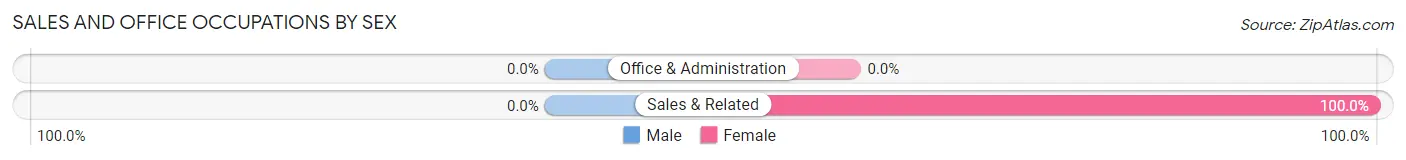
Sales and Office Occupations by Sex
Occupation
Male
Female
Sales & Related
0 (0.0%)
65 (100.0%)
Office & Administration
0 (0.0%)
0 (0.0%)
Total (Category)
0 (0.0%)
65 (100.0%)
Total (Overall)
0 (0.0%)
65 (100.0%)
Natural Resources, Construction and Maintenance Occupations
Natural Resources, Construction and Maintenance Occupations by Sex
Occupation
Male
Female
Farming, Fishing & Forestry
0 (0.0%)
0 (0.0%)
Construction & Extraction
0 (0.0%)
0 (0.0%)
Installation, Maintenance & Repair
0 (0.0%)
0 (0.0%)
Total (Category)
0 (0.0%)
0 (0.0%)
Total (Overall)
0 (0.0%)
65 (100.0%)
Production, Transportation and Moving Occupations
Production, Transportation and Moving Occupations by Sex
Occupation
Male
Female
Production
0 (0.0%)
0 (0.0%)
Transportation
0 (0.0%)
0 (0.0%)
Material Moving
0 (0.0%)
0 (0.0%)
Total (Category)
0 (0.0%)
0 (0.0%)
Total (Overall)
0 (0.0%)
65 (100.0%)
Employment Industries by Sex in Hissop
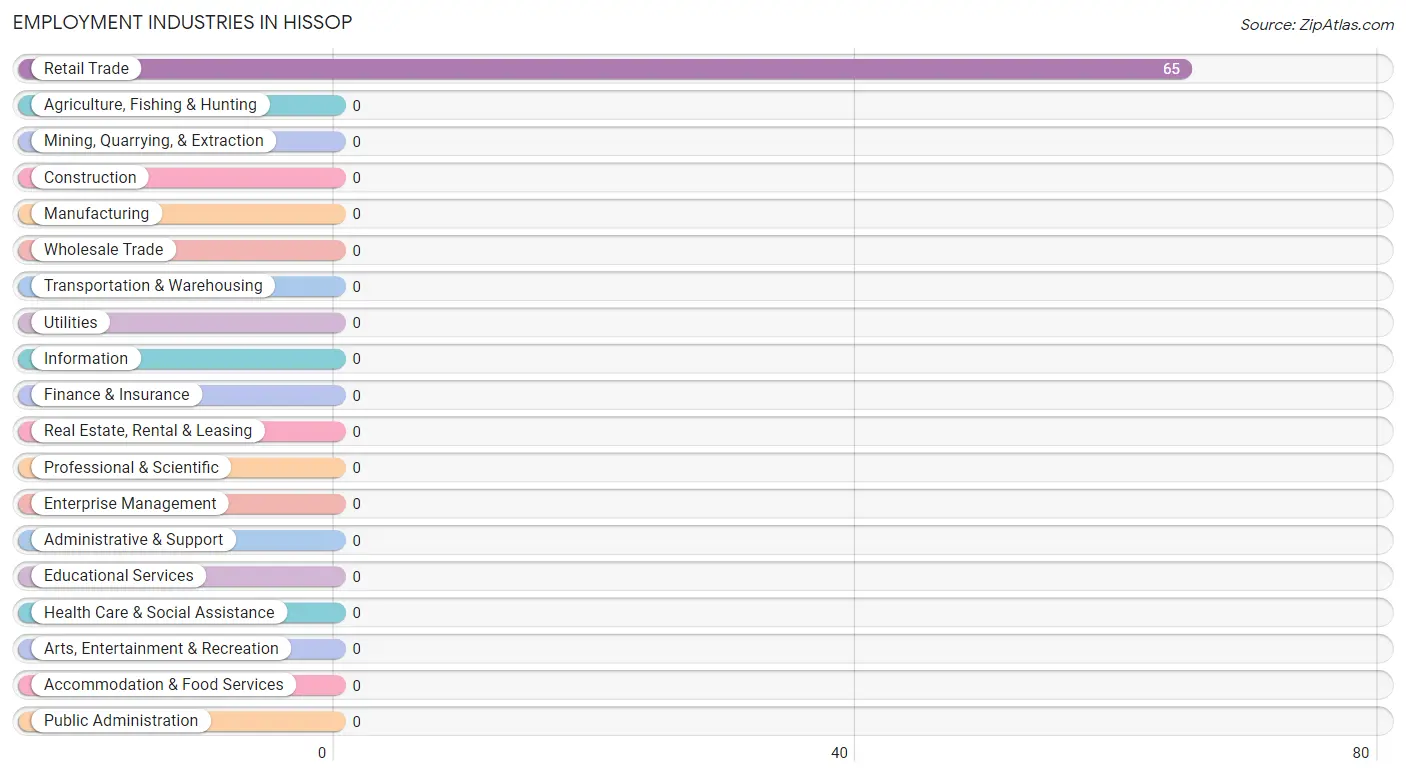
Employment Industries in Hissop
The major employment industries in Hissop include , and Retail Trade (65 | 100.0%).
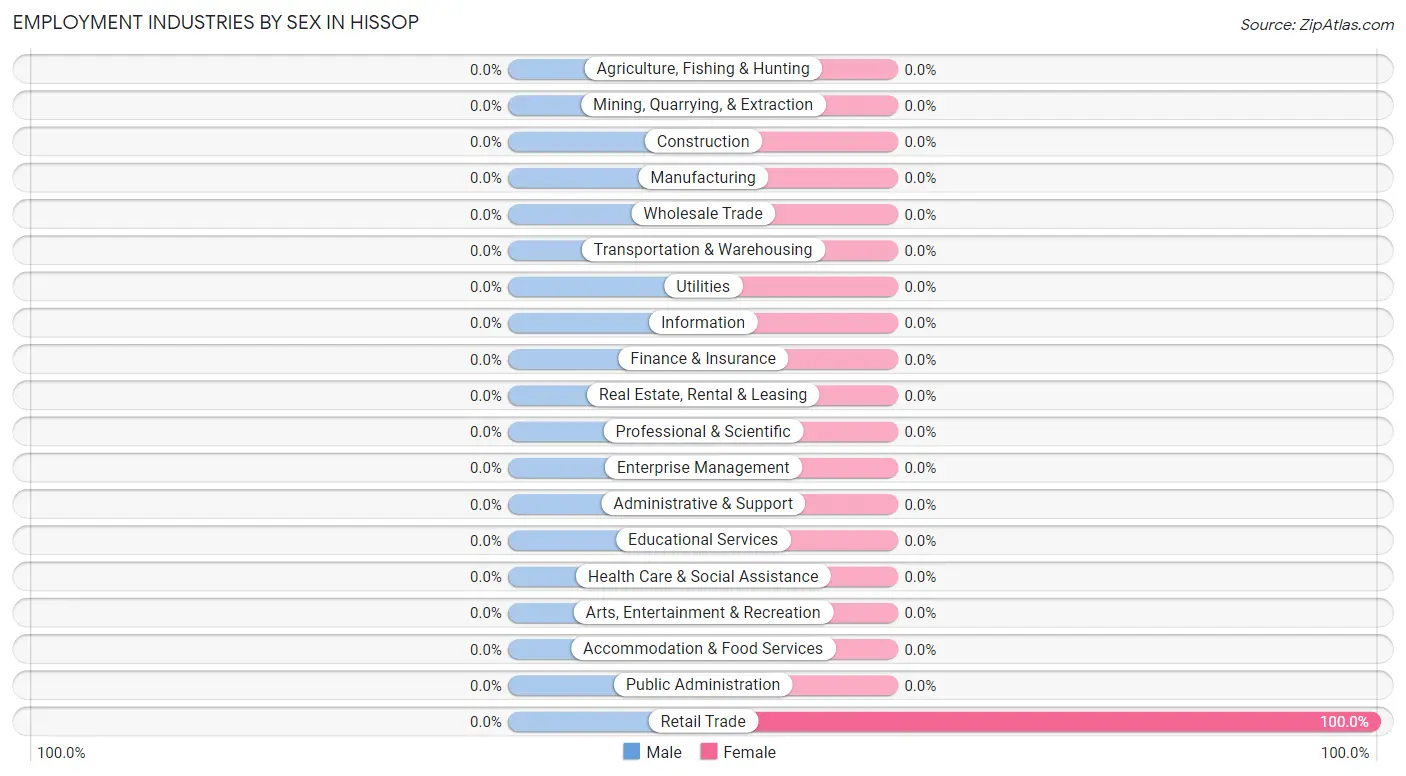
Employment Industries by Sex in Hissop
Industry
Male
Female
Agriculture, Fishing & Hunting
0 (0.0%)
0 (0.0%)
Mining, Quarrying, & Extraction
0 (0.0%)
0 (0.0%)
Construction
0 (0.0%)
0 (0.0%)
Manufacturing
0 (0.0%)
0 (0.0%)
Wholesale Trade
0 (0.0%)
0 (0.0%)
Retail Trade
0 (0.0%)
65 (100.0%)
Transportation & Warehousing
0 (0.0%)
0 (0.0%)
Utilities
0 (0.0%)
0 (0.0%)
Information
0 (0.0%)
0 (0.0%)
Finance & Insurance
0 (0.0%)
0 (0.0%)
Real Estate, Rental & Leasing
0 (0.0%)
0 (0.0%)
Professional & Scientific
0 (0.0%)
0 (0.0%)
Enterprise Management
0 (0.0%)
0 (0.0%)
Administrative & Support
0 (0.0%)
0 (0.0%)
Educational Services
0 (0.0%)
0 (0.0%)
Health Care & Social Assistance
0 (0.0%)
0 (0.0%)
Arts, Entertainment & Recreation
0 (0.0%)
0 (0.0%)
Accommodation & Food Services
0 (0.0%)
0 (0.0%)
Public Administration
0 (0.0%)
0 (0.0%)
Total
0 (0.0%)
65 (100.0%)
Education in Hissop
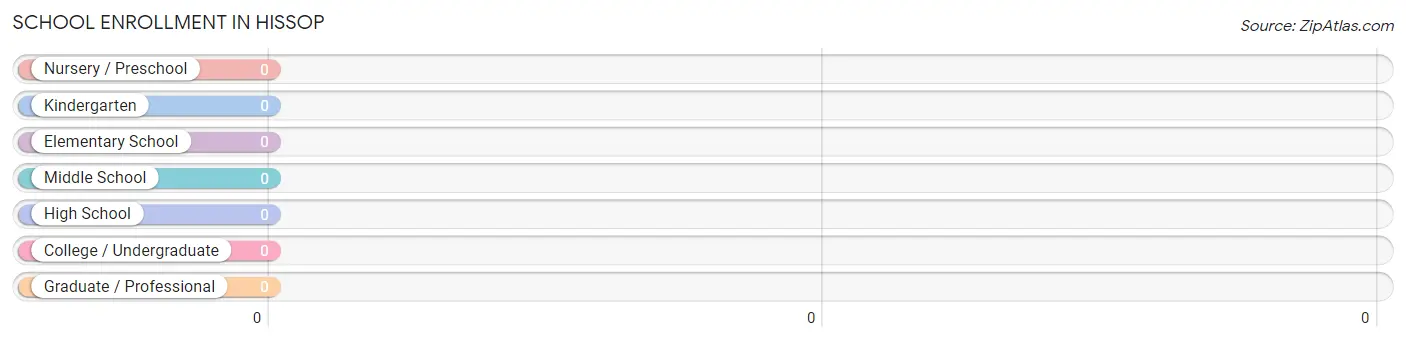
School Enrollment in Hissop
School Level
# Students
% Students
Nursery / Preschool
0
0.0%
Kindergarten
0
0.0%
Elementary School
0
0.0%
Middle School
0
0.0%
High School
0
0.0%
College / Undergraduate
0
0.0%
Graduate / Professional
0
0.0%
Total
0
0.0%
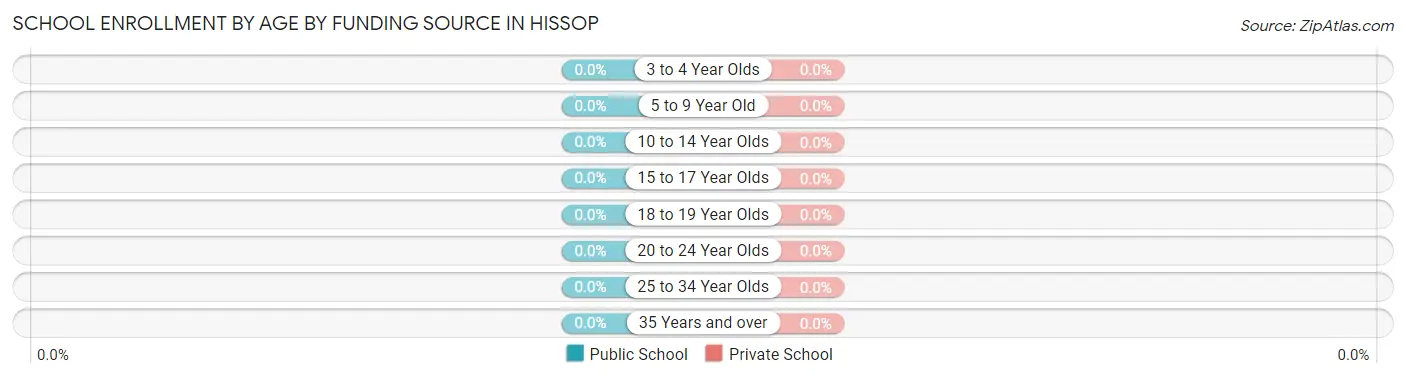
School Enrollment by Age by Funding Source in Hissop
Age Bracket
Public School
Private School
3 to 4 Year Olds
0 (0.0%)
0 (0.0%)
5 to 9 Year Old
0 (0.0%)
0 (0.0%)
10 to 14 Year Olds
0 (0.0%)
0 (0.0%)
15 to 17 Year Olds
0 (0.0%)
0 (0.0%)
18 to 19 Year Olds
0 (0.0%)
0 (0.0%)
20 to 24 Year Olds
0 (0.0%)
0 (0.0%)
25 to 34 Year Olds
0 (0.0%)
0 (0.0%)
35 Years and over
0 (0.0%)
0 (0.0%)
Total
0 (0.0%)
0 (0.0%)
Educational Attainment by Field of Study in Hissop
Field of Study
# Graduates
% Graduates
Computers & Mathematics
0
0.0%
Bio, Nature & Agricultural
0
0.0%
Physical & Health Sciences
0
0.0%
Psychology
0
0.0%
Social Sciences
0
0.0%
Engineering
0
0.0%
Multidisciplinary Studies
0
0.0%
Science & Technology
0
0.0%
Business
0
0.0%
Education
0
0.0%
Literature & Languages
0
0.0%
Liberal Arts & History
0
0.0%
Visual & Performing Arts
0
0.0%
Communications
0
0.0%
Arts & Humanities
0
0.0%
Total
0
0.0%
Transportation & Commute in Hissop
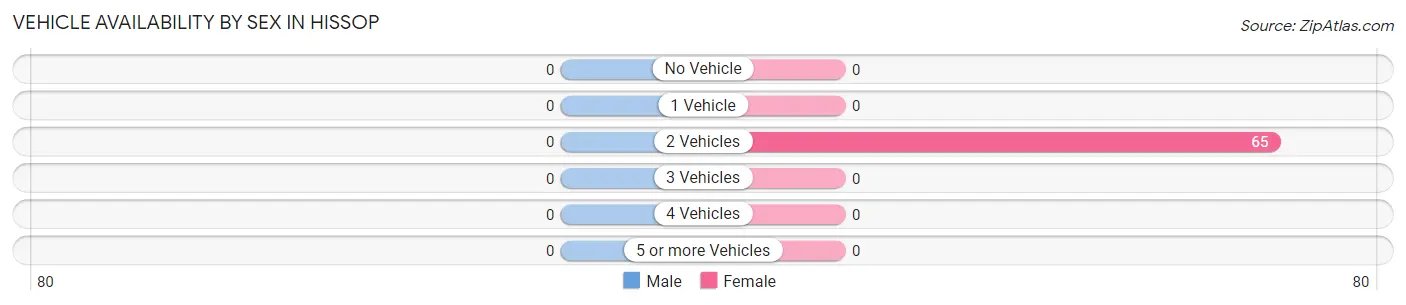
Vehicle Availability by Sex in Hissop
Vehicles Available
Male
Female
No Vehicle
0 (0.0%)
0 (0.0%)
1 Vehicle
0 (0.0%)
0 (0.0%)
2 Vehicles
0 (0.0%)
65 (100.0%)
3 Vehicles
0 (0.0%)
0 (0.0%)
4 Vehicles
0 (0.0%)
0 (0.0%)
5 or more Vehicles
0 (0.0%)
0 (0.0%)
Total
0 (0.0%)
65 (100.0%)
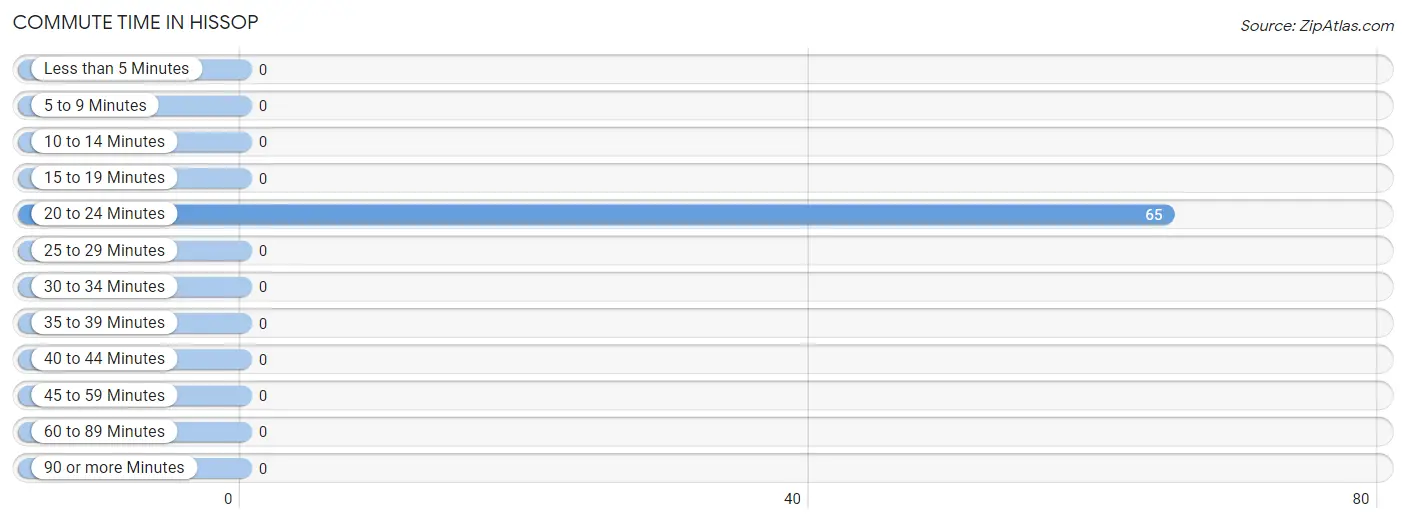
Commute Time in Hissop
The most frequently occuring commute durations in Hissop are 20 to 24 minutes (65 commuters, 100.0%), less than 5 minutes (0 commuters, 0.0%), and 5 to 9 minutes (0 commuters, 0.0%).
Commute Time
# Commuters
% Commuters
Less than 5 Minutes
0
0.0%
5 to 9 Minutes
0
0.0%
10 to 14 Minutes
0
0.0%
15 to 19 Minutes
0
0.0%
20 to 24 Minutes
65
100.0%
25 to 29 Minutes
0
0.0%
30 to 34 Minutes
0
0.0%
35 to 39 Minutes
0
0.0%
40 to 44 Minutes
0
0.0%
45 to 59 Minutes
0
0.0%
60 to 89 Minutes
0
0.0%
90 or more Minutes
0
0.0%
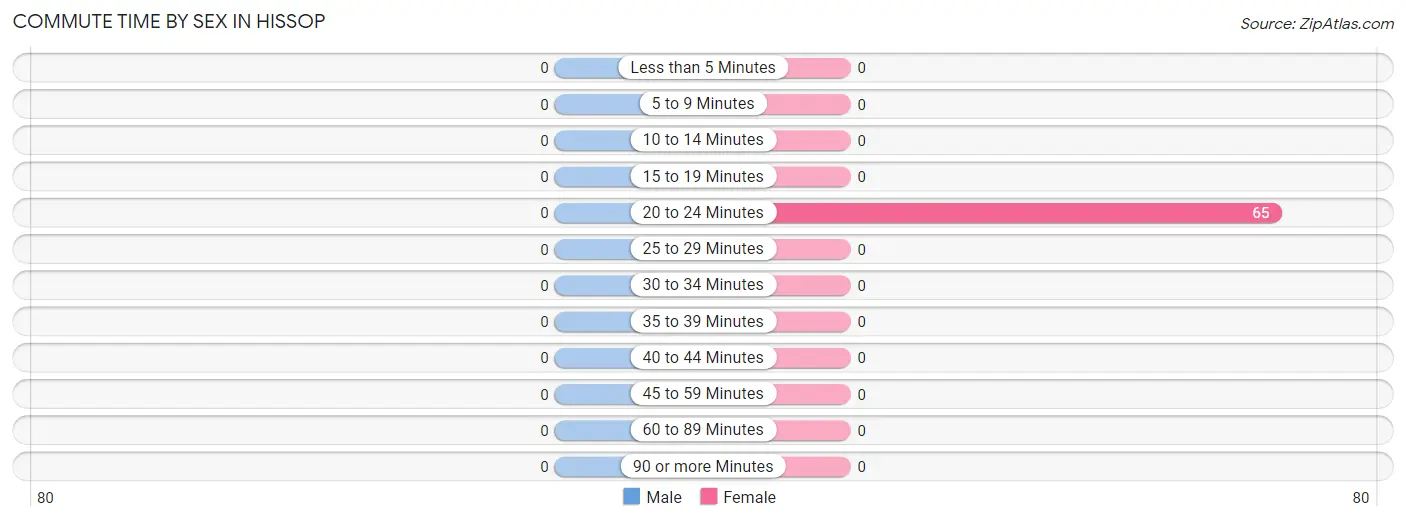
Commute Time by Sex in Hissop
Commute Time
Male
Female
Less than 5 Minutes
0 (0.0%)
0 (0.0%)
5 to 9 Minutes
0 (0.0%)
0 (0.0%)
10 to 14 Minutes
0 (0.0%)
0 (0.0%)
15 to 19 Minutes
0 (0.0%)
0 (0.0%)
20 to 24 Minutes
0 (0.0%)
65 (100.0%)
25 to 29 Minutes
0 (0.0%)
0 (0.0%)
30 to 34 Minutes
0 (0.0%)
0 (0.0%)
35 to 39 Minutes
0 (0.0%)
0 (0.0%)
40 to 44 Minutes
0 (0.0%)
0 (0.0%)
45 to 59 Minutes
0 (0.0%)
0 (0.0%)
60 to 89 Minutes
0 (0.0%)
0 (0.0%)
90 or more Minutes
0 (0.0%)
0 (0.0%)
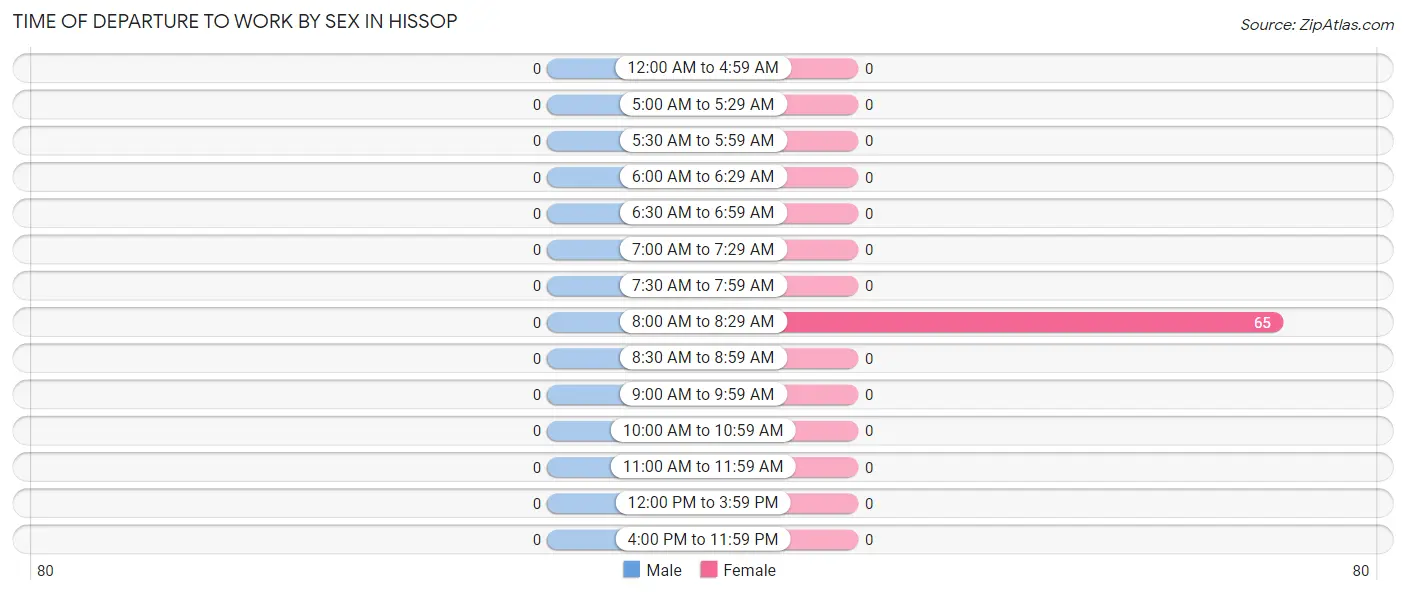
Time of Departure to Work by Sex in Hissop
Time of Departure
Male
Female
12:00 AM to 4:59 AM
0 (0.0%)
0 (0.0%)
5:00 AM to 5:29 AM
0 (0.0%)
0 (0.0%)
5:30 AM to 5:59 AM
0 (0.0%)
0 (0.0%)
6:00 AM to 6:29 AM
0 (0.0%)
0 (0.0%)
6:30 AM to 6:59 AM
0 (0.0%)
0 (0.0%)
7:00 AM to 7:29 AM
0 (0.0%)
0 (0.0%)
7:30 AM to 7:59 AM
0 (0.0%)
0 (0.0%)
8:00 AM to 8:29 AM
0 (0.0%)
65 (100.0%)
8:30 AM to 8:59 AM
0 (0.0%)
0 (0.0%)
9:00 AM to 9:59 AM
0 (0.0%)
0 (0.0%)
10:00 AM to 10:59 AM
0 (0.0%)
0 (0.0%)
11:00 AM to 11:59 AM
0 (0.0%)
0 (0.0%)
12:00 PM to 3:59 PM
0 (0.0%)
0 (0.0%)
4:00 PM to 11:59 PM
0 (0.0%)
0 (0.0%)
Total
0 (0.0%)
65 (100.0%)
Housing Occupancy in Hissop
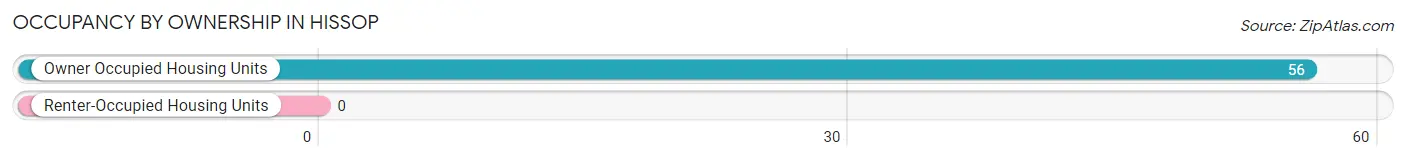
Occupancy by Ownership in Hissop
Of the total 56 dwellings in Hissop, owner-occupied units account for 56 (100.0%), while renter-occupied units make up 0 (0.0%).
Occupancy
# Housing Units
% Housing Units
Owner Occupied Housing Units
56
100.0%
Renter-Occupied Housing Units
0
0.0%
Total Occupied Housing Units
56
100.0%
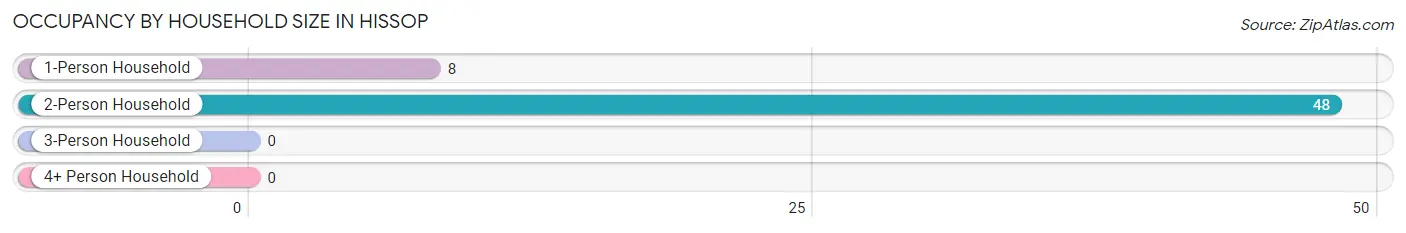
Occupancy by Household Size in Hissop
Household Size
# Housing Units
% Housing Units
1-Person Household
8
14.3%
2-Person Household
48
85.7%
3-Person Household
0
0.0%
4+ Person Household
0
0.0%
Total Housing Units
56
100.0%
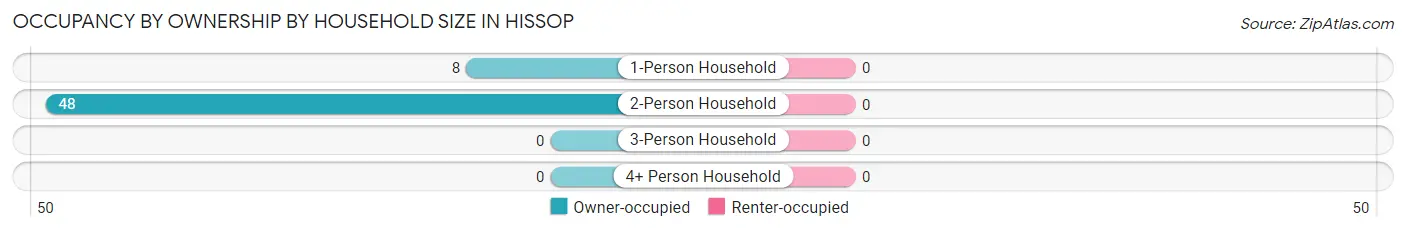
Occupancy by Ownership by Household Size in Hissop
Household Size
Owner-occupied
Renter-occupied
1-Person Household
8 (100.0%)
0 (0.0%)
2-Person Household
48 (100.0%)
0 (0.0%)
3-Person Household
0 (0.0%)
0 (0.0%)
4+ Person Household
0 (0.0%)
0 (0.0%)
Total Housing Units
56 (100.0%)
0 (0.0%)
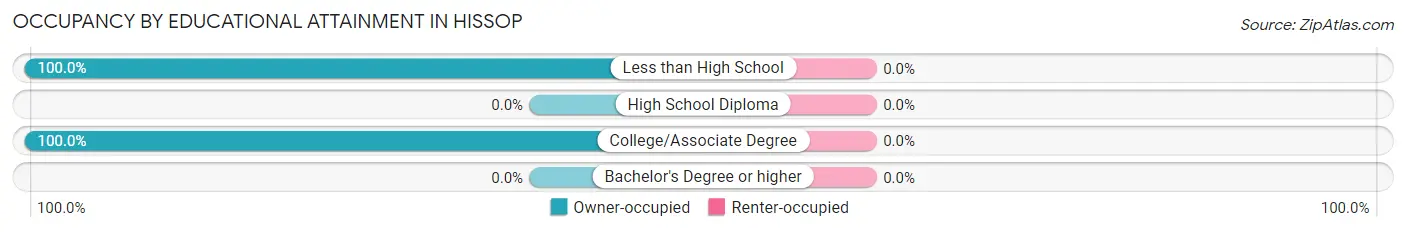
Occupancy by Educational Attainment in Hissop
Household Size
Owner-occupied
Renter-occupied
Less than High School
8 (100.0%)
0 (0.0%)
High School Diploma
0 (0.0%)
0 (0.0%)
College/Associate Degree
48 (100.0%)
0 (0.0%)
Bachelor's Degree or higher
0 (0.0%)
0 (0.0%)
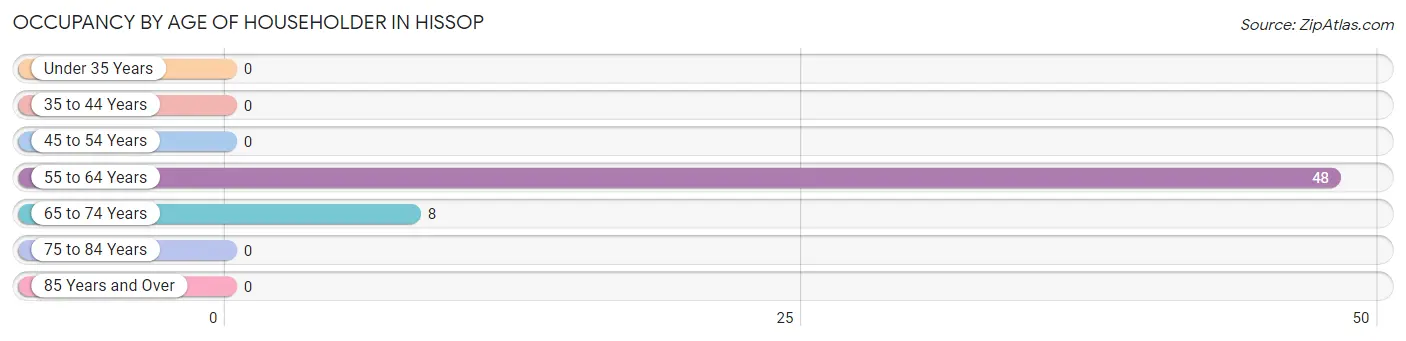
Occupancy by Age of Householder in Hissop
Age Bracket
# Households
% Households
Under 35 Years
0
0.0%
35 to 44 Years
0
0.0%
45 to 54 Years
0
0.0%
55 to 64 Years
48
85.7%
65 to 74 Years
8
14.3%
75 to 84 Years
0
0.0%
85 Years and Over
0
0.0%
Total
56
100.0%
Housing Finances in Hissop
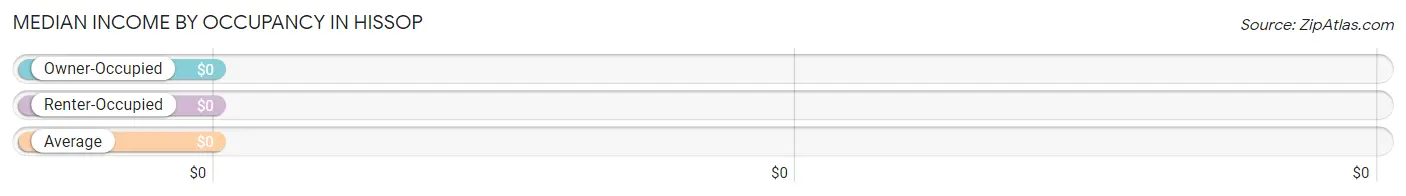
Median Income by Occupancy in Hissop
Occupancy Type
# Households
Median Income
Owner-Occupied
56 (100.0%)
$0
Renter-Occupied
0 (0.0%)
$0
Average
56 (100.0%)
$0
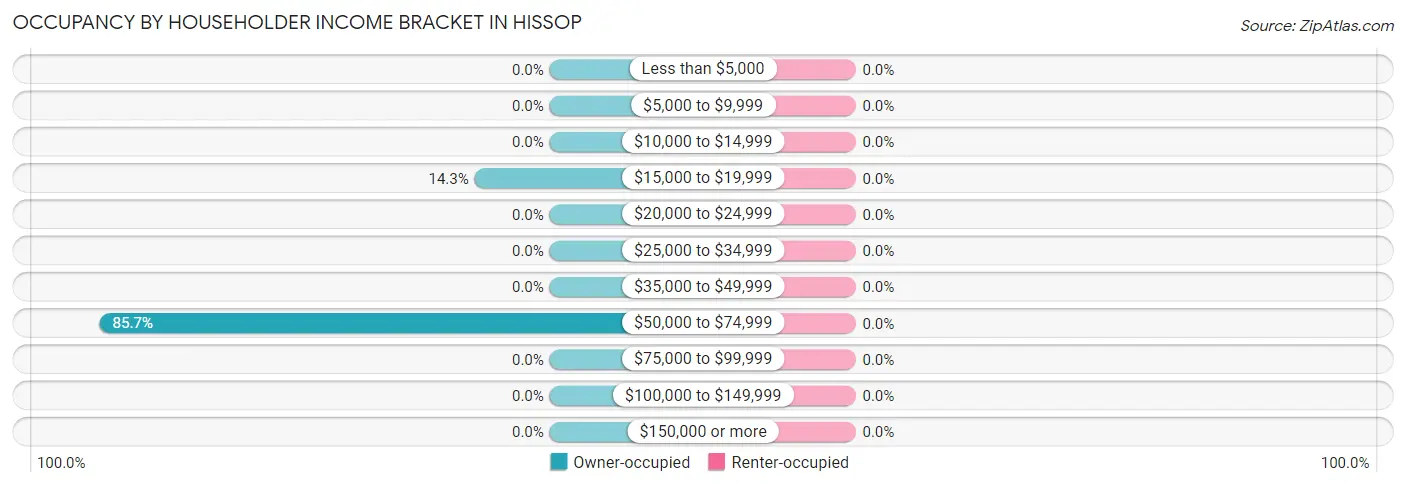
Occupancy by Householder Income Bracket in Hissop
Income Bracket
Owner-occupied
Renter-occupied
Less than $5,000
0 (0.0%)
0 (0.0%)
$5,000 to $9,999
0 (0.0%)
0 (0.0%)
$10,000 to $14,999
0 (0.0%)
0 (0.0%)
$15,000 to $19,999
8 (14.3%)
0 (0.0%)
$20,000 to $24,999
0 (0.0%)
0 (0.0%)
$25,000 to $34,999
0 (0.0%)
0 (0.0%)
$35,000 to $49,999
0 (0.0%)
0 (0.0%)
$50,000 to $74,999
48 (85.7%)
0 (0.0%)
$75,000 to $99,999
0 (0.0%)
0 (0.0%)
$100,000 to $149,999
0 (0.0%)
0 (0.0%)
$150,000 or more
0 (0.0%)
0 (0.0%)
Total
56 (100.0%)
0 (0.0%)
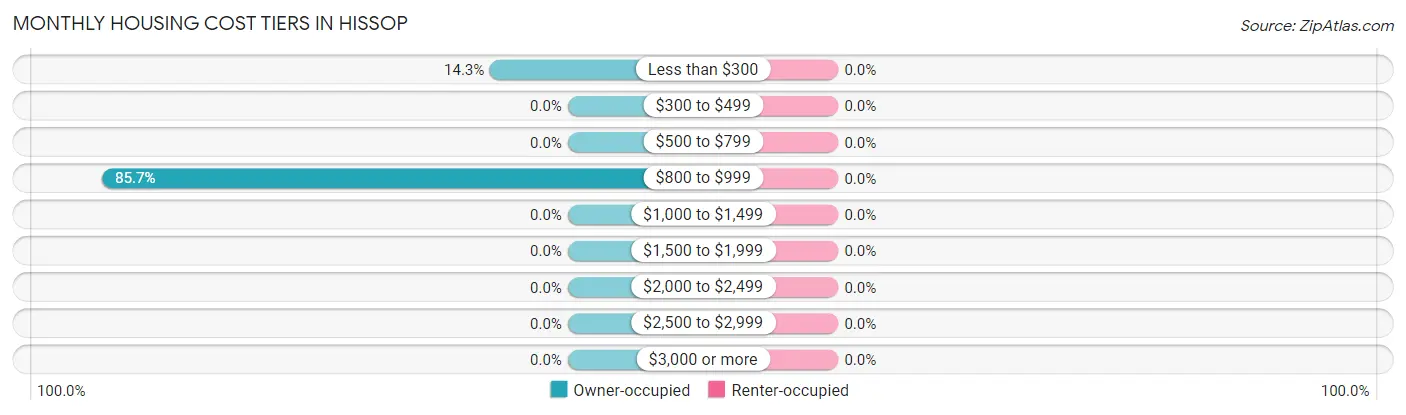
Monthly Housing Cost Tiers in Hissop
Monthly Cost
Owner-occupied
Renter-occupied
Less than $300
8 (14.3%)
0 (0.0%)
$300 to $499
0 (0.0%)
0 (0.0%)
$500 to $799
0 (0.0%)
0 (0.0%)
$800 to $999
48 (85.7%)
0 (0.0%)
$1,000 to $1,499
0 (0.0%)
0 (0.0%)
$1,500 to $1,999
0 (0.0%)
0 (0.0%)
$2,000 to $2,499
0 (0.0%)
0 (0.0%)
$2,500 to $2,999
0 (0.0%)
0 (0.0%)
$3,000 or more
0 (0.0%)
0 (0.0%)
Total
56 (100.0%)
0 (0.0%)
Physical Housing Characteristics in Hissop
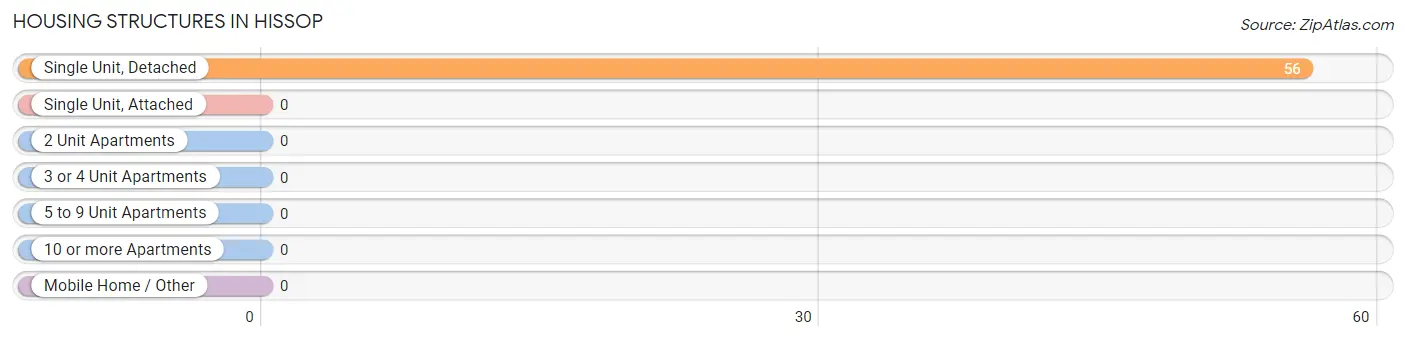
Housing Structures in Hissop
Structure Type
# Housing Units
% Housing Units
Single Unit, Detached
56
100.0%
Single Unit, Attached
0
0.0%
2 Unit Apartments
0
0.0%
3 or 4 Unit Apartments
0
0.0%
5 to 9 Unit Apartments
0
0.0%
10 or more Apartments
0
0.0%
Mobile Home / Other
0
0.0%
Total
56
100.0%
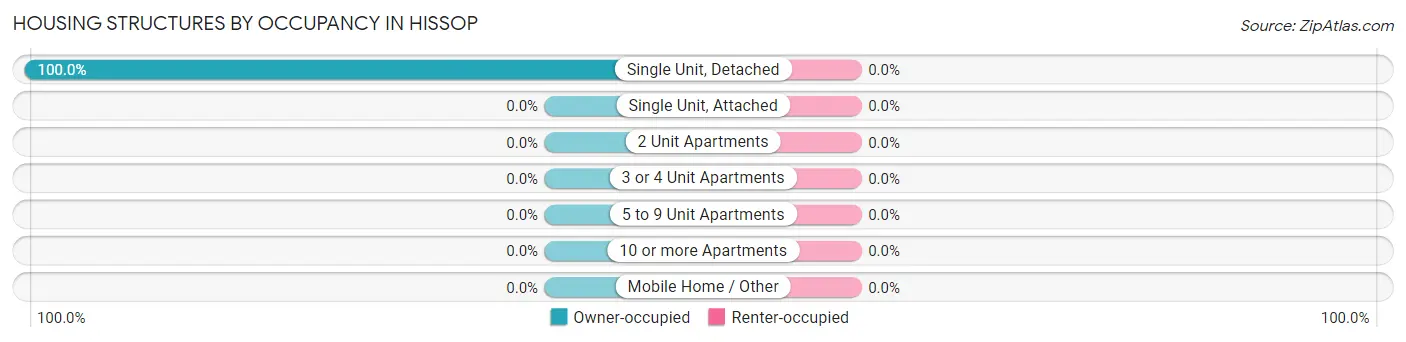
Housing Structures by Occupancy in Hissop
Structure Type
Owner-occupied
Renter-occupied
Single Unit, Detached
56 (100.0%)
0 (0.0%)
Single Unit, Attached
0 (0.0%)
0 (0.0%)
2 Unit Apartments
0 (0.0%)
0 (0.0%)
3 or 4 Unit Apartments
0 (0.0%)
0 (0.0%)
5 to 9 Unit Apartments
0 (0.0%)
0 (0.0%)
10 or more Apartments
0 (0.0%)
0 (0.0%)
Mobile Home / Other
0 (0.0%)
0 (0.0%)
Total
56 (100.0%)
0 (0.0%)
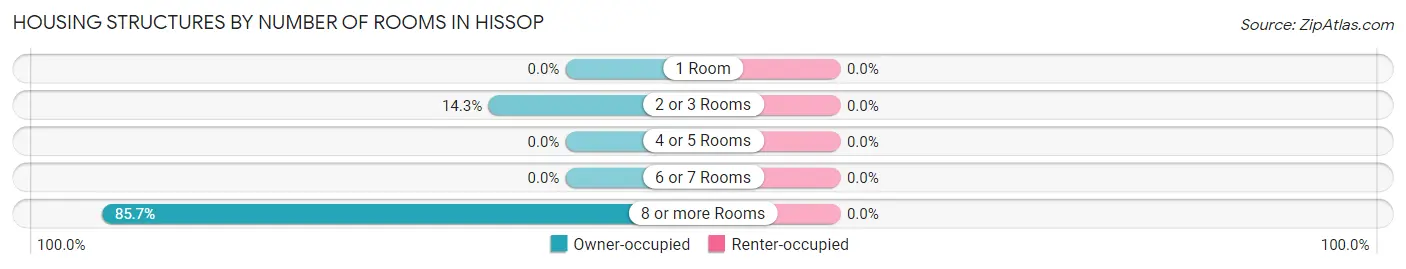
Housing Structures by Number of Rooms in Hissop
Number of Rooms
Owner-occupied
Renter-occupied
1 Room
0 (0.0%)
0 (0.0%)
2 or 3 Rooms
8 (14.3%)
0 (0.0%)
4 or 5 Rooms
0 (0.0%)
0 (0.0%)
6 or 7 Rooms
0 (0.0%)
0 (0.0%)
8 or more Rooms
48 (85.7%)
0 (0.0%)
Total
56 (100.0%)
0 (0.0%)
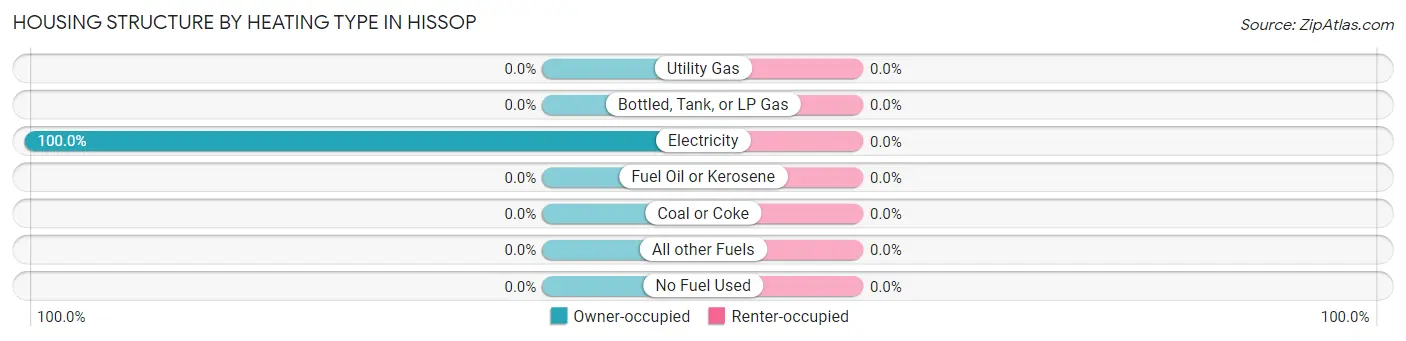
Housing Structure by Heating Type in Hissop
Heating Type
Owner-occupied
Renter-occupied
Utility Gas
0 (0.0%)
0 (0.0%)
Bottled, Tank, or LP Gas
0 (0.0%)
0 (0.0%)
Electricity
56 (100.0%)
0 (0.0%)
Fuel Oil or Kerosene
0 (0.0%)
0 (0.0%)
Coal or Coke
0 (0.0%)
0 (0.0%)
All other Fuels
0 (0.0%)
0 (0.0%)
No Fuel Used
0 (0.0%)
0 (0.0%)
Total
56 (100.0%)
0 (0.0%)
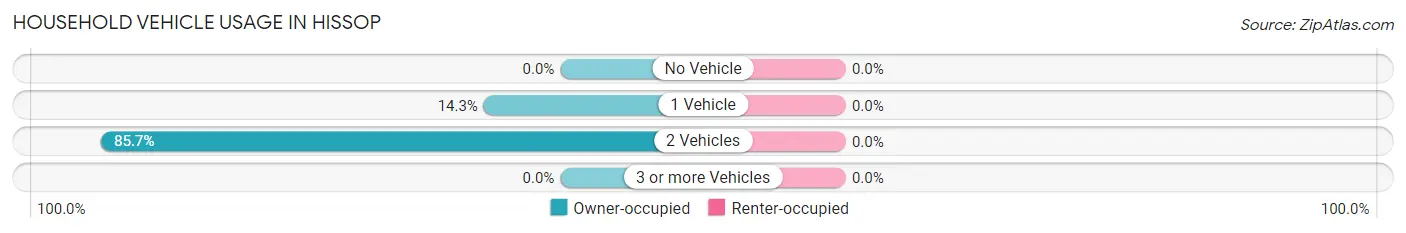
Household Vehicle Usage in Hissop
Vehicles per Household
Owner-occupied
Renter-occupied
No Vehicle
0 (0.0%)
0 (0.0%)
1 Vehicle
8 (14.3%)
0 (0.0%)
2 Vehicles
48 (85.7%)
0 (0.0%)
3 or more Vehicles
0 (0.0%)
0 (0.0%)
Total
56 (100.0%)
0 (0.0%)
Real Estate & Mortgages in Hissop
Real Estate and Mortgage Overview in Hissop
Characteristic
Without Mortgage
With Mortgage
Housing Units
8
48
Median Property Value
-
-
Median Household Income
-
-
Monthly Housing Costs
-
-
Real Estate Taxes
-
-
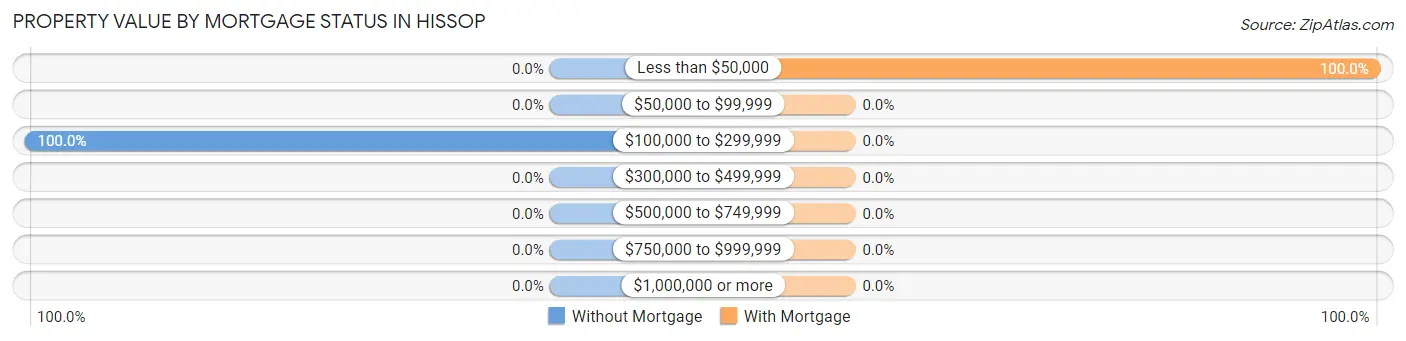
Property Value by Mortgage Status in Hissop
Property Value
Without Mortgage
With Mortgage
Less than $50,000
0 (0.0%)
48 (100.0%)
$50,000 to $99,999
0 (0.0%)
0 (0.0%)
$100,000 to $299,999
8 (100.0%)
0 (0.0%)
$300,000 to $499,999
0 (0.0%)
0 (0.0%)
$500,000 to $749,999
0 (0.0%)
0 (0.0%)
$750,000 to $999,999
0 (0.0%)
0 (0.0%)
$1,000,000 or more
0 (0.0%)
0 (0.0%)
Total
8 (100.0%)
48 (100.0%)
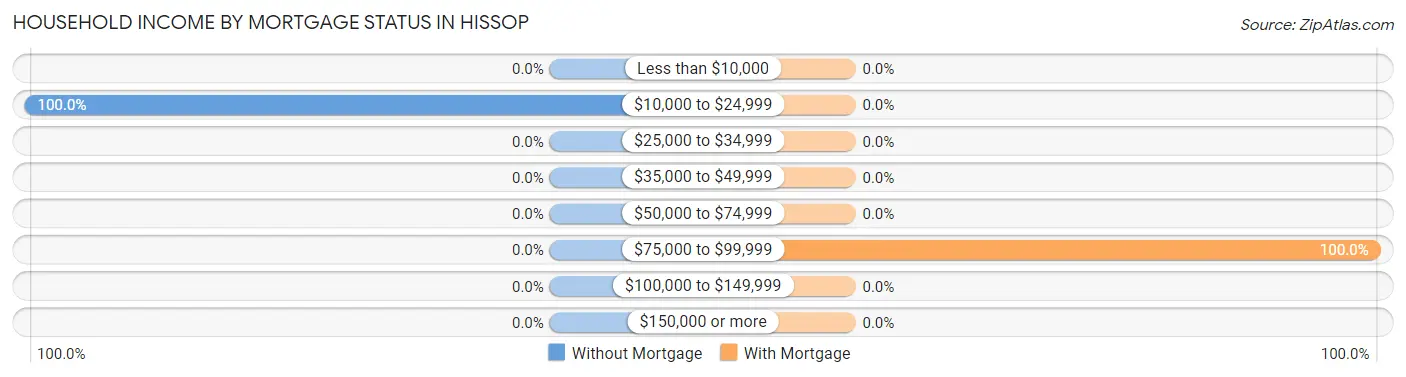
Household Income by Mortgage Status in Hissop
Household Income
Without Mortgage
With Mortgage
Less than $10,000
0 (0.0%)
0 (0.0%)
$10,000 to $24,999
8 (100.0%)
0 (0.0%)
$25,000 to $34,999
0 (0.0%)
0 (0.0%)
$35,000 to $49,999
0 (0.0%)
0 (0.0%)
$50,000 to $74,999
0 (0.0%)
0 (0.0%)
$75,000 to $99,999
0 (0.0%)
48 (100.0%)
$100,000 to $149,999
0 (0.0%)
0 (0.0%)
$150,000 or more
0 (0.0%)
0 (0.0%)
Total
8 (100.0%)
48 (100.0%)
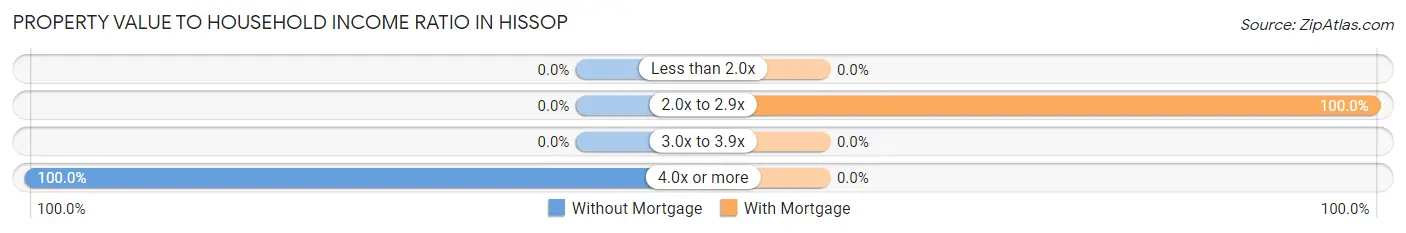
Property Value to Household Income Ratio in Hissop
Value-to-Income Ratio
Without Mortgage
With Mortgage
Less than 2.0x
0 (0.0%)
0 (0.0%)
2.0x to 2.9x
0 (0.0%)
48 (100.0%)
3.0x to 3.9x
0 (0.0%)
0 (0.0%)
4.0x or more
8 (100.0%)
0 (0.0%)
Total
8 (100.0%)
48 (100.0%)
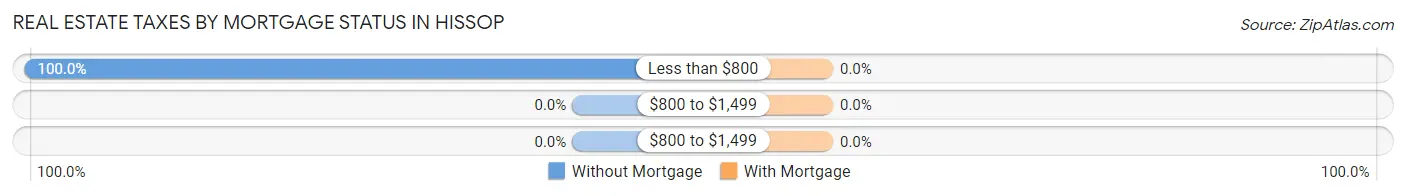
Real Estate Taxes by Mortgage Status in Hissop
Property Taxes
Without Mortgage
With Mortgage
Less than $800
8 (100.0%)
0 (0.0%)
$800 to $1,499
0 (0.0%)
0 (0.0%)
$800 to $1,499
0 (0.0%)
0 (0.0%)
Total
8 (100.0%)
48 (100.0%)
Health & Disability in Hissop
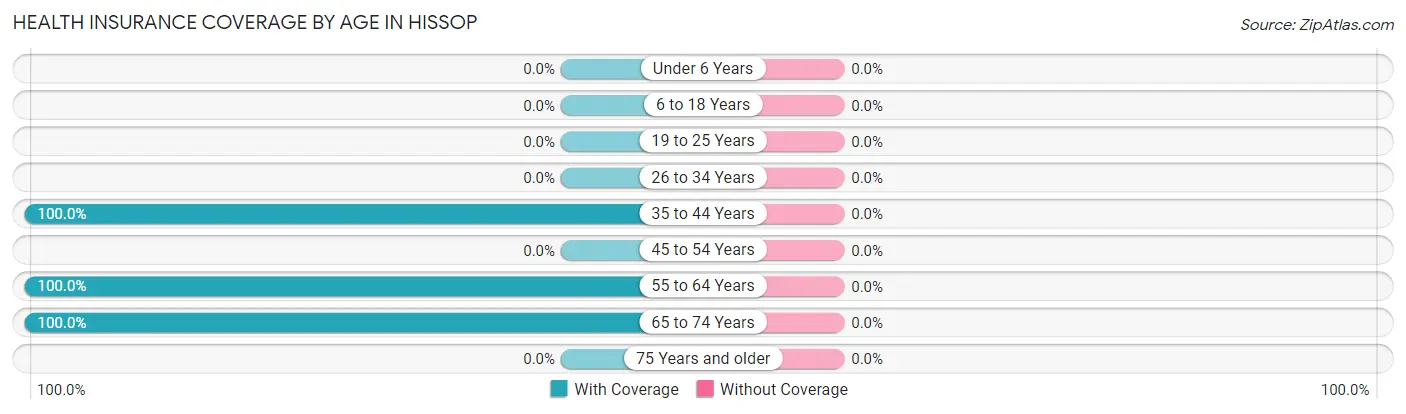
Health Insurance Coverage by Age in Hissop
Age Bracket
With Coverage
Without Coverage
Under 6 Years
0 (0.0%)
0 (0.0%)
6 to 18 Years
0 (0.0%)
0 (0.0%)
19 to 25 Years
0 (0.0%)
0 (0.0%)
26 to 34 Years
0 (0.0%)
0 (0.0%)
35 to 44 Years
65 (100.0%)
0 (0.0%)
45 to 54 Years
0 (0.0%)
0 (0.0%)
55 to 64 Years
48 (100.0%)
0 (0.0%)
65 to 74 Years
8 (100.0%)
0 (0.0%)
75 Years and older
0 (0.0%)
0 (0.0%)
Total
121 (100.0%)
0 (0.0%)
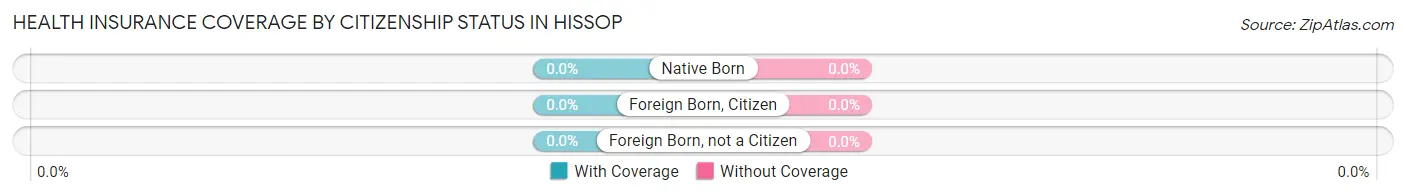
Health Insurance Coverage by Citizenship Status in Hissop
Citizenship Status
With Coverage
Without Coverage
Native Born
0 (0.0%)
0 (0.0%)
Foreign Born, Citizen
0 (0.0%)
0 (0.0%)
Foreign Born, not a Citizen
0 (0.0%)
0 (0.0%)
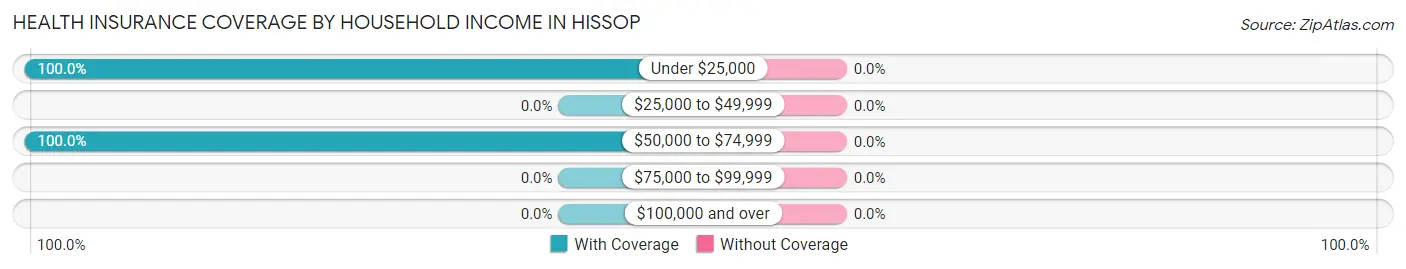
Health Insurance Coverage by Household Income in Hissop
Household Income
With Coverage
Without Coverage
Under $25,000
8 (100.0%)
0 (0.0%)
$25,000 to $49,999
0 (0.0%)
0 (0.0%)
$50,000 to $74,999
113 (100.0%)
0 (0.0%)
$75,000 to $99,999
0 (0.0%)
0 (0.0%)
$100,000 and over
0 (0.0%)
0 (0.0%)
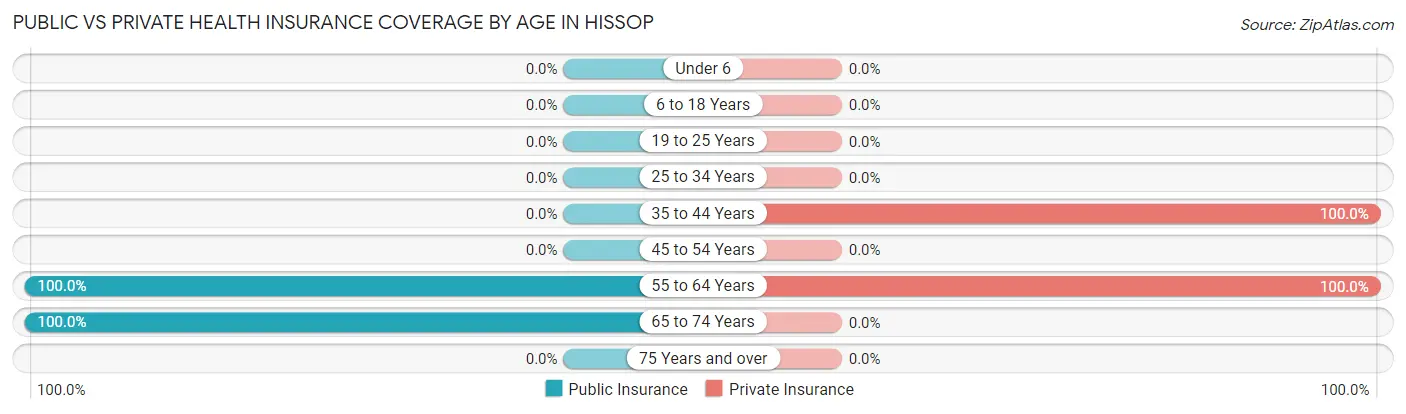
Public vs Private Health Insurance Coverage by Age in Hissop
Age Bracket
Public Insurance
Private Insurance
Under 6
0 (0.0%)
0 (0.0%)
6 to 18 Years
0 (0.0%)
0 (0.0%)
19 to 25 Years
0 (0.0%)
0 (0.0%)
25 to 34 Years
0 (0.0%)
0 (0.0%)
35 to 44 Years
0 (0.0%)
65 (100.0%)
45 to 54 Years
0 (0.0%)
0 (0.0%)
55 to 64 Years
48 (100.0%)
48 (100.0%)
65 to 74 Years
8 (100.0%)
0 (0.0%)
75 Years and over
0 (0.0%)
0 (0.0%)
Total
56 (46.3%)
113 (93.4%)
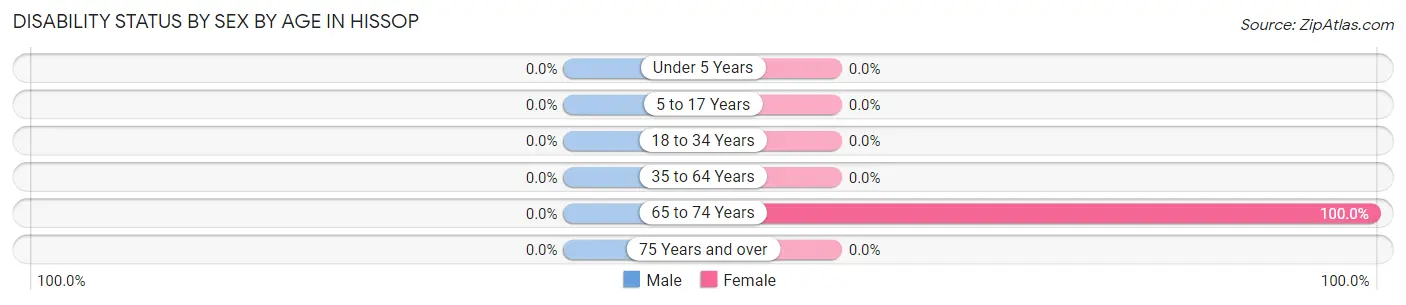
Disability Status by Sex by Age in Hissop
Age Bracket
Male
Female
Under 5 Years
0 (0.0%)
0 (0.0%)
5 to 17 Years
0 (0.0%)
0 (0.0%)
18 to 34 Years
0 (0.0%)
0 (0.0%)
35 to 64 Years
0 (0.0%)
0 (0.0%)
65 to 74 Years
0 (0.0%)
8 (100.0%)
75 Years and over
0 (0.0%)
0 (0.0%)
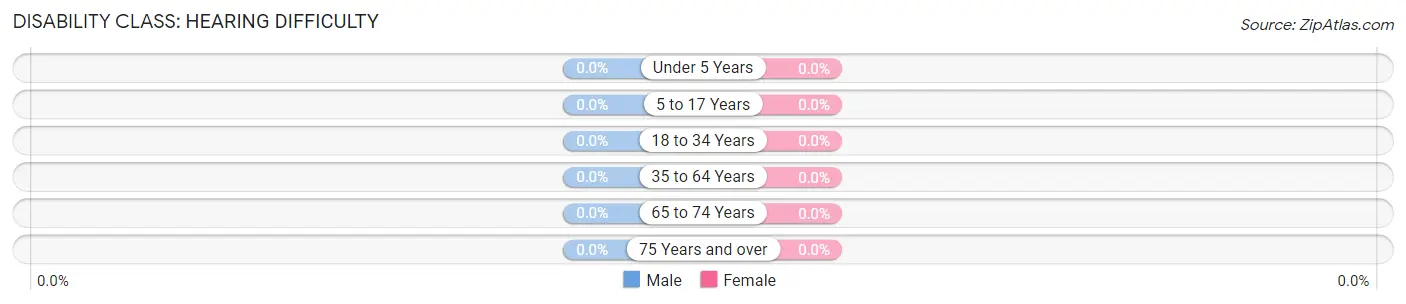
Disability Class by Sex by Age in Hissop
Disability Class: Hearing Difficulty
Age Bracket
Male
Female
Under 5 Years
0 (0.0%)
0 (0.0%)
5 to 17 Years
0 (0.0%)
0 (0.0%)
18 to 34 Years
0 (0.0%)
0 (0.0%)
35 to 64 Years
0 (0.0%)
0 (0.0%)
65 to 74 Years
0 (0.0%)
0 (0.0%)
75 Years and over
0 (0.0%)
0 (0.0%)
Disability Class: Vision Difficulty
Age Bracket
Male
Female
Under 5 Years
0 (0.0%)
0 (0.0%)
5 to 17 Years
0 (0.0%)
0 (0.0%)
18 to 34 Years
0 (0.0%)
0 (0.0%)
35 to 64 Years
0 (0.0%)
0 (0.0%)
65 to 74 Years
0 (0.0%)
0 (0.0%)
75 Years and over
0 (0.0%)
0 (0.0%)
Disability Class: Cognitive Difficulty
Age Bracket
Male
Female
5 to 17 Years
0 (0.0%)
0 (0.0%)
18 to 34 Years
0 (0.0%)
0 (0.0%)
35 to 64 Years
0 (0.0%)
0 (0.0%)
65 to 74 Years
0 (0.0%)
0 (0.0%)
75 Years and over
0 (0.0%)
0 (0.0%)
Disability Class: Ambulatory Difficulty
Age Bracket
Male
Female
5 to 17 Years
0 (0.0%)
0 (0.0%)
18 to 34 Years
0 (0.0%)
0 (0.0%)
35 to 64 Years
0 (0.0%)
0 (0.0%)
65 to 74 Years
0 (0.0%)
8 (100.0%)
75 Years and over
0 (0.0%)
0 (0.0%)
Disability Class: Self-Care Difficulty
Age Bracket
Male
Female
5 to 17 Years
0 (0.0%)
0 (0.0%)
18 to 34 Years
0 (0.0%)
0 (0.0%)
35 to 64 Years
0 (0.0%)
0 (0.0%)
65 to 74 Years
0 (0.0%)
0 (0.0%)
75 Years and over
0 (0.0%)
0 (0.0%)
Technology Access in Hissop
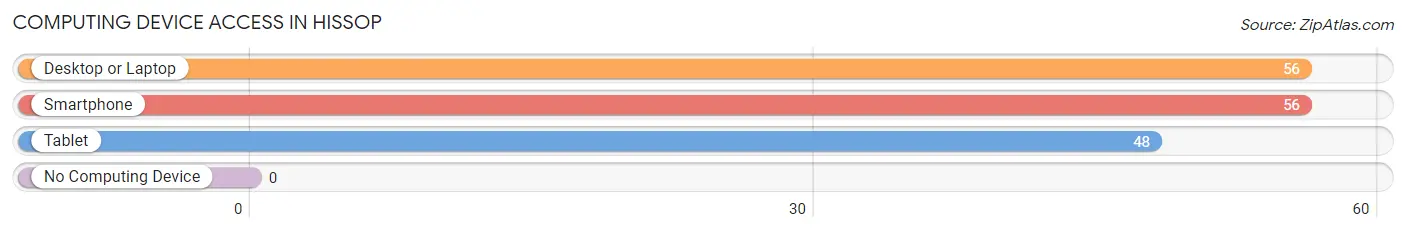
Computing Device Access in Hissop
Device Type
# Households
% Households
Desktop or Laptop
56
100.0%
Smartphone
56
100.0%
Tablet
48
85.7%
No Computing Device
0
0.0%
Total
56
100.0%
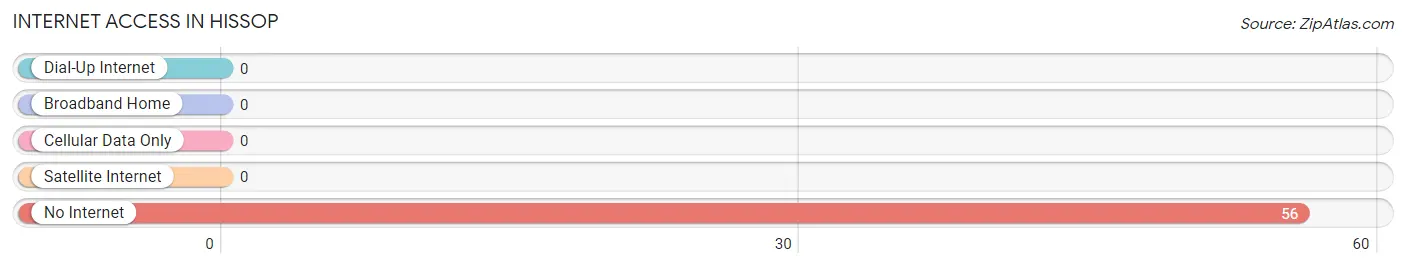
Internet Access in Hissop
Internet Type
# Households
% Households
Dial-Up Internet
0
0.0%
Broadband Home
0
0.0%
Cellular Data Only
0
0.0%
Satellite Internet
0
0.0%
No Internet
56
100.0%
Total
56
100.0%
Hissop Summary
Hissop is a small town located in the state of Alabama, in the United States. It is situated in the northwest corner of the state, near the border with Mississippi. The town has a population of approximately 1,000 people, and is part of the larger Mobile metropolitan area.
Geography
Hissop is located in the northwest corner of Alabama, near the border with Mississippi. The town is situated in the Mobile-Tensaw Delta, a large wetland area that is home to a variety of wildlife. The town is located on the banks of the Tombigbee River, which flows through the area. The town is surrounded by forests and wetlands, and is home to a variety of wildlife, including deer, wild turkeys, and bald eagles.
The climate in Hissop is humid subtropical, with hot, humid summers and mild winters. The average annual temperature is around 70 degrees Fahrenheit, with temperatures reaching as high as 95 degrees in the summer months. The average annual precipitation is around 50 inches, with most of the rain falling in the spring and summer months.
Economy
The economy of Hissop is largely based on agriculture and forestry. The town is home to several farms, which produce a variety of crops, including corn, soybeans, cotton, and peanuts. The town is also home to several timber companies, which harvest timber from the surrounding forests.
In addition to agriculture and forestry, Hissop is home to several small businesses, including restaurants, convenience stores, and gas stations. The town is also home to a few manufacturing companies, which produce a variety of products, including furniture, clothing, and electronics.
Demographics
As of the 2010 census, the population of Hissop was 1,000 people. The racial makeup of the town was 97.2% White, 0.7% African American, 0.3% Native American, 0.2% Asian, and 1.6% from other races. The median household income was $37,500, and the median family income was $45,000.
The town is home to a variety of religious denominations, including Baptist, Methodist, and Catholic. The town is also home to a variety of cultural and recreational activities, including festivals, fairs, and sporting events.
Conclusion
Hissop is a small town located in the northwest corner of Alabama, near the border with Mississippi. The town has a population of approximately 1,000 people, and is part of the larger Mobile metropolitan area. The economy of Hissop is largely based on agriculture and forestry, and the town is home to a variety of small businesses. The racial makeup of the town is 97.2% White, 0.7% African American, 0.3% Native American, 0.2% Asian, and 1.6% from other races. The town is home to a variety of religious denominations, and is also home to a variety of cultural and recreational activities.
Common Questions
What is Per Capita Income in Hissop?
Per Capita income in Hissop is $30,014.
What is Inequality or Gini Index in Hissop?
Inequality or Gini Index in Hissop is 0.10.
What is the Total Population of Hissop?
Total Population of Hissop is 121.
What is the Total Female Population of Hissop?
Total Female Population of Hissop is 121.
What is the Median Population Age in Hissop?
Median Population Age in Hissop is 37.9 Years.
What is the Average Family Size in Hissop
Average Family Size in Hissop is 2.4 People.
What is the Average Household Size in Hissop
Average Household Size in Hissop is 2.2 People.
How Large is the Labor Force in Hissop?
There are 65 People in the Labor Forcein in Hissop.
What is the Percentage of People in the Labor Force in Hissop?
53.7% of People are in the Labor Force in Hissop.
Report Title
Report Link
HTML Copy & Paste Link
Social Media
Copy and paste the folowing code into any webpage where you would like this interactive chart to display