Zip Codes with the Highest Percentage of Population Employed in Arts, Media & Entertainment in Hawaii
RELATED REPORTS & OPTIONS
Arts, Media & Entertainment
Hawaii
Compare Zip Codes
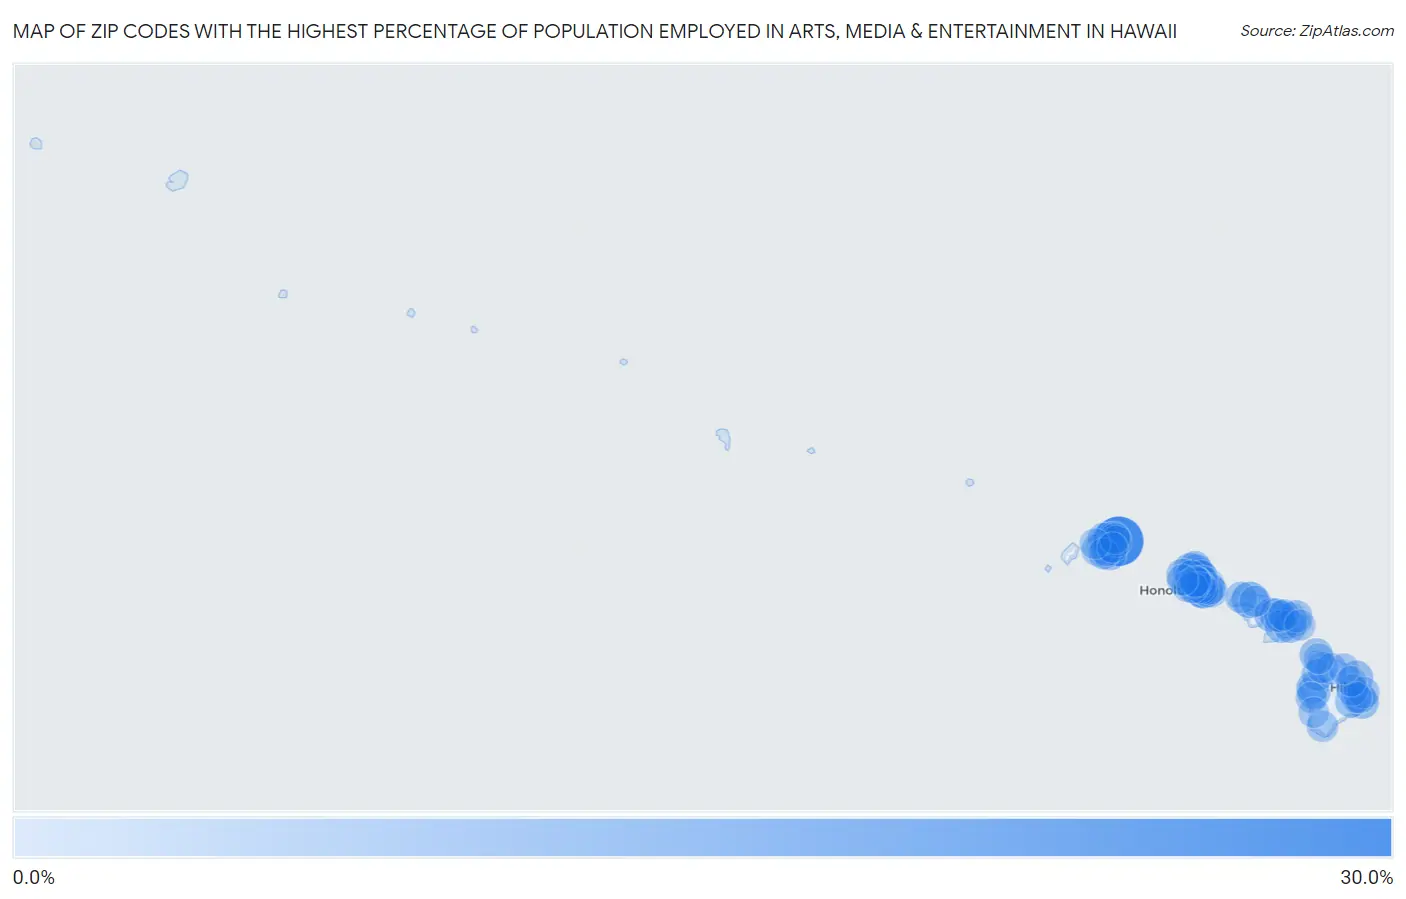
Map of Zip Codes with the Highest Percentage of Population Employed in Arts, Media & Entertainment in Hawaii
0.0%
30.0%
Zip Codes with the Highest Percentage of Population Employed in Arts, Media & Entertainment in Hawaii
| Zip Code | % Employed | vs State | vs National | |
| 1. | 96751 | 26.9% | 2.3%(+24.6)#1 | 2.1%(+24.8)#51 |
| 2. | 96757 | 8.5% | 2.3%(+6.22)#2 | 2.1%(+6.47)#486 |
| 3. | 96813 | 5.3% | 2.3%(+2.98)#3 | 2.1%(+3.24)#1,352 |
| 4. | 96712 | 4.9% | 2.3%(+2.61)#4 | 2.1%(+2.86)#1,551 |
| 5. | 96761 | 4.9% | 2.3%(+2.55)#5 | 2.1%(+2.81)#1,573 |
| 6. | 96717 | 4.8% | 2.3%(+2.48)#6 | 2.1%(+2.73)#1,622 |
| 7. | 96728 | 4.8% | 2.3%(+2.47)#7 | 2.1%(+2.72)#1,633 |
| 8. | 96762 | 4.7% | 2.3%(+2.35)#8 | 2.1%(+2.60)#1,723 |
| 9. | 96816 | 4.2% | 2.3%(+1.91)#9 | 2.1%(+2.16)#2,127 |
| 10. | 96719 | 4.2% | 2.3%(+1.90)#10 | 2.1%(+2.15)#2,142 |
| 11. | 96768 | 4.1% | 2.3%(+1.81)#11 | 2.1%(+2.07)#2,217 |
| 12. | 96793 | 4.0% | 2.3%(+1.65)#12 | 2.1%(+1.90)#2,422 |
| 13. | 96753 | 3.8% | 2.3%(+1.53)#13 | 2.1%(+1.78)#2,570 |
| 14. | 96725 | 3.8% | 2.3%(+1.46)#14 | 2.1%(+1.71)#2,663 |
| 15. | 96756 | 3.8% | 2.3%(+1.45)#15 | 2.1%(+1.70)#2,676 |
| 16. | 96790 | 3.8% | 2.3%(+1.44)#16 | 2.1%(+1.69)#2,689 |
| 17. | 96731 | 3.4% | 2.3%(+1.13)#17 | 2.1%(+1.38)#3,143 |
| 18. | 96822 | 3.3% | 2.3%(+1.03)#18 | 2.1%(+1.28)#3,350 |
| 19. | 96814 | 3.3% | 2.3%(+0.999)#19 | 2.1%(+1.25)#3,401 |
| 20. | 96722 | 3.3% | 2.3%(+0.958)#20 | 2.1%(+1.21)#3,477 |
| 21. | 96778 | 3.3% | 2.3%(+0.941)#21 | 2.1%(+1.19)#3,501 |
| 22. | 96740 | 3.0% | 2.3%(+0.660)#22 | 2.1%(+0.913)#4,151 |
| 23. | 96785 | 2.9% | 2.3%(+0.573)#23 | 2.1%(+0.826)#4,385 |
| 24. | 96791 | 2.9% | 2.3%(+0.542)#24 | 2.1%(+0.795)#4,460 |
| 25. | 96734 | 2.8% | 2.3%(+0.514)#25 | 2.1%(+0.767)#4,539 |
| 26. | 96825 | 2.8% | 2.3%(+0.476)#26 | 2.1%(+0.729)#4,651 |
| 27. | 96730 | 2.7% | 2.3%(+0.361)#27 | 2.1%(+0.614)#4,983 |
| 28. | 96708 | 2.6% | 2.3%(+0.299)#28 | 2.1%(+0.552)#5,185 |
| 29. | 96818 | 2.5% | 2.3%(+0.236)#29 | 2.1%(+0.489)#5,403 |
| 30. | 96826 | 2.5% | 2.3%(+0.223)#30 | 2.1%(+0.476)#5,431 |
| 31. | 96738 | 2.5% | 2.3%(+0.211)#31 | 2.1%(+0.464)#5,469 |
| 32. | 96815 | 2.5% | 2.3%(+0.161)#32 | 2.1%(+0.414)#5,633 |
| 33. | 96796 | 2.4% | 2.3%(+0.130)#33 | 2.1%(+0.383)#5,770 |
| 34. | 96741 | 2.4% | 2.3%(+0.081)#34 | 2.1%(+0.334)#5,959 |
| 35. | 96714 | 2.4% | 2.3%(+0.058)#35 | 2.1%(+0.311)#6,043 |
| 36. | 96786 | 2.3% | 2.3%(-0.031)#36 | 2.1%(+0.222)#6,452 |
| 37. | 96760 | 2.1% | 2.3%(-0.237)#37 | 2.1%(+0.016)#7,398 |
| 38. | 96732 | 2.1% | 2.3%(-0.239)#38 | 2.1%(+0.014)#7,408 |
| 39. | 96821 | 2.0% | 2.3%(-0.267)#39 | 2.1%(-0.015)#7,561 |
| 40. | 96848 | 2.0% | 2.3%(-0.338)#40 | 2.1%(-0.085)#7,939 |
| 41. | 96754 | 1.9% | 2.3%(-0.369)#41 | 2.1%(-0.116)#8,109 |
| 42. | 96797 | 1.8% | 2.3%(-0.544)#42 | 2.1%(-0.291)#9,161 |
| 43. | 96707 | 1.7% | 2.3%(-0.579)#43 | 2.1%(-0.326)#9,371 |
| 44. | 96727 | 1.7% | 2.3%(-0.594)#44 | 2.1%(-0.342)#9,473 |
| 45. | 96701 | 1.7% | 2.3%(-0.624)#45 | 2.1%(-0.371)#9,706 |
| 46. | 96749 | 1.7% | 2.3%(-0.632)#46 | 2.1%(-0.379)#9,765 |
| 47. | 96743 | 1.7% | 2.3%(-0.663)#47 | 2.1%(-0.410)#9,993 |
| 48. | 96795 | 1.6% | 2.3%(-0.687)#48 | 2.1%(-0.434)#10,150 |
| 49. | 96729 | 1.6% | 2.3%(-0.704)#49 | 2.1%(-0.451)#10,271 |
| 50. | 96744 | 1.6% | 2.3%(-0.704)#50 | 2.1%(-0.451)#10,272 |
| 51. | 96779 | 1.5% | 2.3%(-0.769)#51 | 2.1%(-0.516)#10,691 |
| 52. | 96817 | 1.5% | 2.3%(-0.809)#52 | 2.1%(-0.556)#10,952 |
| 53. | 96819 | 1.5% | 2.3%(-0.813)#53 | 2.1%(-0.560)#10,977 |
| 54. | 96772 | 1.5% | 2.3%(-0.813)#54 | 2.1%(-0.560)#10,985 |
| 55. | 96746 | 1.5% | 2.3%(-0.854)#55 | 2.1%(-0.602)#11,278 |
| 56. | 96720 | 1.5% | 2.3%(-0.859)#56 | 2.1%(-0.606)#11,319 |
| 57. | 96705 | 1.4% | 2.3%(-0.902)#57 | 2.1%(-0.649)#11,627 |
| 58. | 96748 | 1.4% | 2.3%(-0.954)#58 | 2.1%(-0.702)#12,005 |
| 59. | 96782 | 1.3% | 2.3%(-0.972)#59 | 2.1%(-0.719)#12,148 |
| 60. | 96706 | 1.3% | 2.3%(-0.977)#60 | 2.1%(-0.724)#12,178 |
| 61. | 96789 | 1.3% | 2.3%(-1.05)#61 | 2.1%(-0.799)#12,747 |
| 62. | 96750 | 1.2% | 2.3%(-1.11)#62 | 2.1%(-0.853)#13,160 |
| 63. | 96771 | 1.2% | 2.3%(-1.16)#63 | 2.1%(-0.905)#13,537 |
| 64. | 96792 | 1.1% | 2.3%(-1.19)#64 | 2.1%(-0.942)#13,839 |
| 65. | 96713 | 0.98% | 2.3%(-1.34)#65 | 2.1%(-1.08)#14,998 |
| 66. | 96703 | 0.97% | 2.3%(-1.34)#66 | 2.1%(-1.09)#15,060 |
| 67. | 96776 | 0.89% | 2.3%(-1.43)#67 | 2.1%(-1.17)#15,739 |
| 68. | 96755 | 0.63% | 2.3%(-1.69)#68 | 2.1%(-1.43)#17,832 |
| 69. | 96752 | 0.48% | 2.3%(-1.83)#69 | 2.1%(-1.58)#18,990 |
| 70. | 96781 | 0.46% | 2.3%(-1.86)#70 | 2.1%(-1.61)#19,259 |
| 71. | 96704 | 0.41% | 2.3%(-1.90)#71 | 2.1%(-1.65)#19,549 |
| 72. | 96766 | 0.24% | 2.3%(-2.08)#72 | 2.1%(-1.82)#20,740 |
1
Common Questions
What are the Top 10 Zip Codes with the Highest Percentage of Population Employed in Arts, Media & Entertainment in Hawaii?
Top 10 Zip Codes with the Highest Percentage of Population Employed in Arts, Media & Entertainment in Hawaii are:
What zip code has the Highest Percentage of Population Employed in Arts, Media & Entertainment in Hawaii?
96751 has the Highest Percentage of Population Employed in Arts, Media & Entertainment in Hawaii with 26.9%.
What is the Percentage of Population Employed in Arts, Media & Entertainment in the State of Hawaii?
Percentage of Population Employed in Arts, Media & Entertainment in Hawaii is 2.3%.
What is the Percentage of Population Employed in Arts, Media & Entertainment in the United States?
Percentage of Population Employed in Arts, Media & Entertainment in the United States is 2.1%.