Zip Codes with the Highest Percentage of Population Employed in Arts, Media & Entertainment in Maryland
RELATED REPORTS & OPTIONS
Arts, Media & Entertainment
Maryland
Compare Zip Codes
Map of Zip Codes with the Highest Percentage of Population Employed in Arts, Media & Entertainment in Maryland
0.0%
15.0%
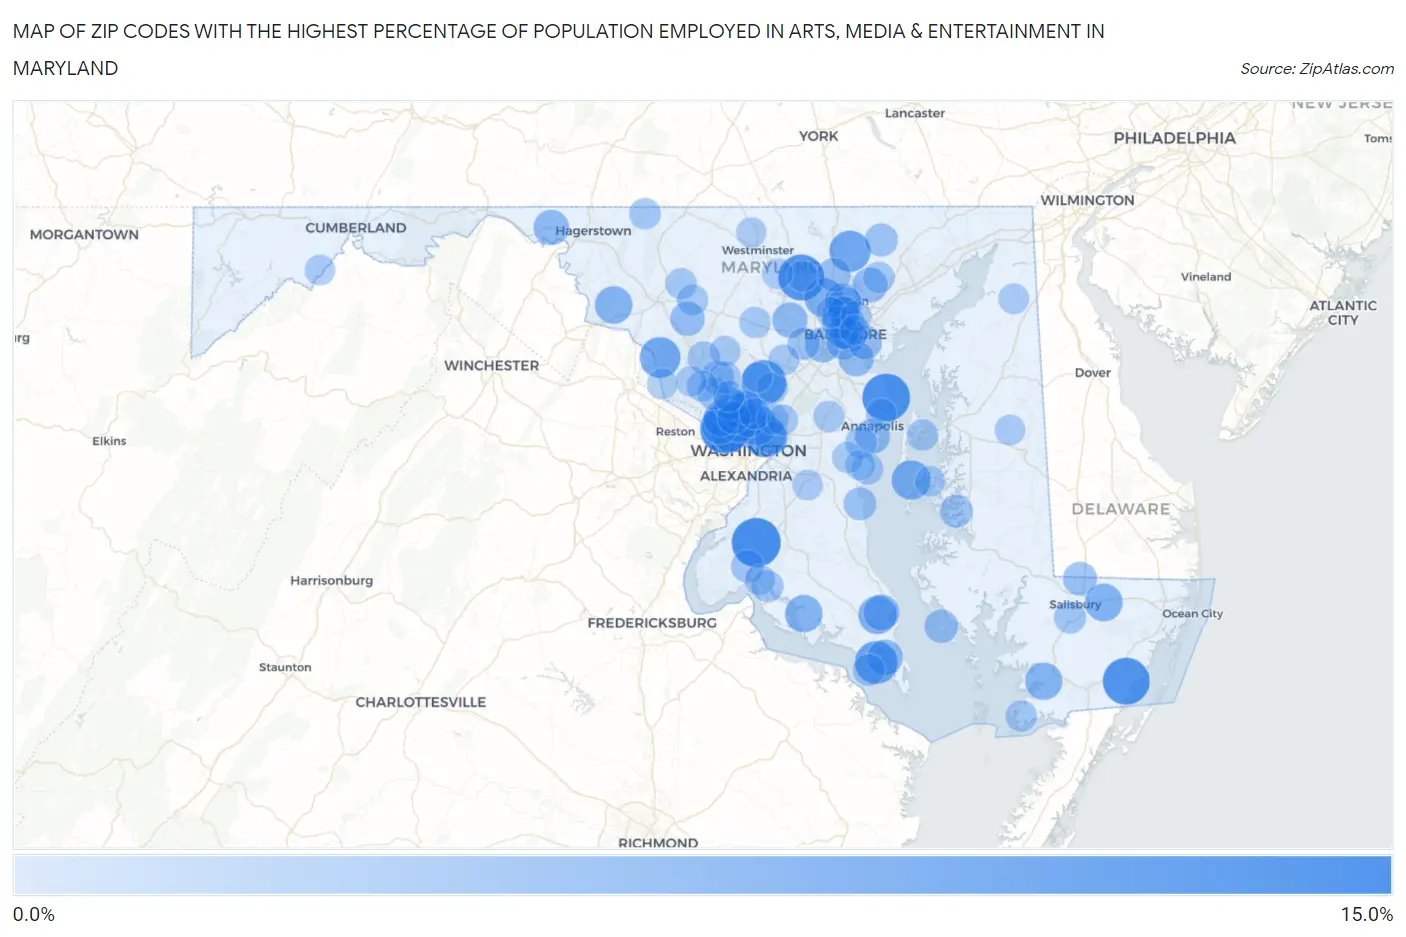
Zip Codes with the Highest Percentage of Population Employed in Arts, Media & Entertainment in Maryland
| Zip Code | % Employed | vs State | vs National | |
| 1. | 20812 | 10.2% | 2.2%(+8.00)#1 | 2.1%(+8.16)#361 |
| 2. | 20675 | 10.0% | 2.2%(+7.78)#2 | 2.1%(+7.94)#375 |
| 3. | 21056 | 9.5% | 2.2%(+7.28)#3 | 2.1%(+7.44)#414 |
| 4. | 21829 | 9.2% | 2.2%(+6.98)#4 | 2.1%(+7.13)#436 |
| 5. | 21071 | 8.8% | 2.2%(+6.63)#5 | 2.1%(+6.79)#463 |
| 6. | 20868 | 8.5% | 2.2%(+6.25)#6 | 2.1%(+6.41)#493 |
| 7. | 20630 | 7.6% | 2.2%(+5.40)#7 | 2.1%(+5.55)#621 |
| 8. | 20712 | 7.4% | 2.2%(+5.17)#8 | 2.1%(+5.33)#673 |
| 9. | 21111 | 7.1% | 2.2%(+4.83)#9 | 2.1%(+4.99)#749 |
| 10. | 20912 | 6.9% | 2.2%(+4.72)#10 | 2.1%(+4.87)#772 |
| 11. | 20842 | 6.9% | 2.2%(+4.67)#11 | 2.1%(+4.82)#787 |
| 12. | 21665 | 6.3% | 2.2%(+4.11)#12 | 2.1%(+4.27)#921 |
| 13. | 21153 | 6.2% | 2.2%(+3.99)#13 | 2.1%(+4.15)#965 |
| 14. | 20816 | 6.0% | 2.2%(+3.75)#14 | 2.1%(+3.90)#1,046 |
| 15. | 20688 | 5.9% | 2.2%(+3.69)#15 | 2.1%(+3.85)#1,075 |
| 16. | 21849 | 5.7% | 2.2%(+3.51)#16 | 2.1%(+3.66)#1,148 |
| 17. | 21718 | 5.6% | 2.2%(+3.42)#17 | 2.1%(+3.57)#1,183 |
| 18. | 20621 | 5.6% | 2.2%(+3.40)#18 | 2.1%(+3.55)#1,189 |
| 19. | 20815 | 5.6% | 2.2%(+3.37)#19 | 2.1%(+3.53)#1,200 |
| 20. | 21871 | 5.5% | 2.2%(+3.33)#20 | 2.1%(+3.48)#1,225 |
| 21. | 20910 | 5.4% | 2.2%(+3.21)#21 | 2.1%(+3.37)#1,294 |
| 22. | 20896 | 5.4% | 2.2%(+3.15)#22 | 2.1%(+3.30)#1,320 |
| 23. | 21210 | 5.2% | 2.2%(+3.00)#23 | 2.1%(+3.16)#1,391 |
| 24. | 20818 | 5.2% | 2.2%(+2.96)#24 | 2.1%(+3.11)#1,412 |
| 25. | 20629 | 5.0% | 2.2%(+2.82)#25 | 2.1%(+2.98)#1,480 |
| 26. | 21204 | 5.0% | 2.2%(+2.77)#26 | 2.1%(+2.93)#1,509 |
| 27. | 20895 | 5.0% | 2.2%(+2.77)#27 | 2.1%(+2.93)#1,510 |
| 28. | 20686 | 5.0% | 2.2%(+2.74)#28 | 2.1%(+2.90)#1,526 |
| 29. | 20817 | 4.9% | 2.2%(+2.72)#29 | 2.1%(+2.88)#1,538 |
| 30. | 21722 | 4.8% | 2.2%(+2.63)#30 | 2.1%(+2.78)#1,587 |
| 31. | 21163 | 4.8% | 2.2%(+2.59)#31 | 2.1%(+2.75)#1,609 |
| 32. | 21226 | 4.7% | 2.2%(+2.53)#32 | 2.1%(+2.68)#1,664 |
| 33. | 21403 | 4.7% | 2.2%(+2.49)#33 | 2.1%(+2.64)#1,692 |
| 34. | 21250 | 4.7% | 2.2%(+2.48)#34 | 2.1%(+2.63)#1,695 |
| 35. | 21057 | 4.7% | 2.2%(+2.44)#35 | 2.1%(+2.59)#1,728 |
| 36. | 21754 | 4.5% | 2.2%(+2.29)#36 | 2.1%(+2.44)#1,851 |
| 37. | 21252 | 4.5% | 2.2%(+2.25)#37 | 2.1%(+2.41)#1,880 |
| 38. | 21230 | 4.5% | 2.2%(+2.24)#38 | 2.1%(+2.39)#1,896 |
| 39. | 21218 | 4.3% | 2.2%(+2.11)#39 | 2.1%(+2.26)#2,013 |
| 40. | 21231 | 4.3% | 2.2%(+2.07)#40 | 2.1%(+2.23)#2,054 |
| 41. | 21202 | 4.3% | 2.2%(+2.07)#41 | 2.1%(+2.22)#2,061 |
| 42. | 21224 | 4.3% | 2.2%(+2.06)#42 | 2.1%(+2.21)#2,068 |
| 43. | 21875 | 4.3% | 2.2%(+2.04)#43 | 2.1%(+2.19)#2,087 |
| 44. | 21030 | 4.2% | 2.2%(+2.03)#44 | 2.1%(+2.18)#2,094 |
| 45. | 20902 | 4.2% | 2.2%(+2.03)#45 | 2.1%(+2.18)#2,095 |
| 46. | 21211 | 4.2% | 2.2%(+2.01)#46 | 2.1%(+2.16)#2,129 |
| 47. | 21634 | 4.1% | 2.2%(+1.92)#47 | 2.1%(+2.08)#2,206 |
| 48. | 20852 | 4.1% | 2.2%(+1.89)#48 | 2.1%(+2.04)#2,251 |
| 49. | 20781 | 4.1% | 2.2%(+1.84)#49 | 2.1%(+1.99)#2,306 |
| 50. | 21201 | 4.0% | 2.2%(+1.78)#50 | 2.1%(+1.94)#2,367 |
| 51. | 20814 | 4.0% | 2.2%(+1.78)#51 | 2.1%(+1.93)#2,371 |
| 52. | 21084 | 4.0% | 2.2%(+1.77)#52 | 2.1%(+1.93)#2,377 |
| 53. | 20880 | 4.0% | 2.2%(+1.75)#53 | 2.1%(+1.91)#2,409 |
| 54. | 20714 | 3.9% | 2.2%(+1.72)#54 | 2.1%(+1.88)#2,447 |
| 55. | 21654 | 3.9% | 2.2%(+1.67)#55 | 2.1%(+1.83)#2,509 |
| 56. | 20677 | 3.9% | 2.2%(+1.67)#56 | 2.1%(+1.82)#2,513 |
| 57. | 20850 | 3.8% | 2.2%(+1.59)#57 | 2.1%(+1.74)#2,622 |
| 58. | 21043 | 3.8% | 2.2%(+1.54)#58 | 2.1%(+1.69)#2,681 |
| 59. | 20876 | 3.7% | 2.2%(+1.49)#59 | 2.1%(+1.64)#2,763 |
| 60. | 21212 | 3.6% | 2.2%(+1.41)#60 | 2.1%(+1.56)#2,873 |
| 61. | 20632 | 3.6% | 2.2%(+1.40)#61 | 2.1%(+1.56)#2,883 |
| 62. | 21826 | 3.6% | 2.2%(+1.40)#62 | 2.1%(+1.55)#2,891 |
| 63. | 20674 | 3.6% | 2.2%(+1.37)#63 | 2.1%(+1.52)#2,936 |
| 64. | 20855 | 3.6% | 2.2%(+1.34)#64 | 2.1%(+1.49)#2,984 |
| 65. | 21037 | 3.5% | 2.2%(+1.27)#65 | 2.1%(+1.43)#3,088 |
| 66. | 21719 | 3.4% | 2.2%(+1.21)#66 | 2.1%(+1.36)#3,191 |
| 67. | 20740 | 3.4% | 2.2%(+1.19)#67 | 2.1%(+1.35)#3,228 |
| 68. | 20764 | 3.4% | 2.2%(+1.19)#68 | 2.1%(+1.35)#3,235 |
| 69. | 21817 | 3.4% | 2.2%(+1.16)#69 | 2.1%(+1.31)#3,292 |
| 70. | 20851 | 3.4% | 2.2%(+1.16)#70 | 2.1%(+1.31)#3,300 |
| 71. | 21619 | 3.4% | 2.2%(+1.15)#71 | 2.1%(+1.31)#3,309 |
| 72. | 20901 | 3.4% | 2.2%(+1.15)#72 | 2.1%(+1.30)#3,318 |
| 73. | 21082 | 3.4% | 2.2%(+1.15)#73 | 2.1%(+1.30)#3,323 |
| 74. | 20878 | 3.4% | 2.2%(+1.14)#74 | 2.1%(+1.29)#3,338 |
| 75. | 21701 | 3.3% | 2.2%(+1.11)#75 | 2.1%(+1.26)#3,390 |
| 76. | 21723 | 3.3% | 2.2%(+1.10)#76 | 2.1%(+1.26)#3,394 |
| 77. | 21774 | 3.3% | 2.2%(+1.09)#77 | 2.1%(+1.24)#3,420 |
| 78. | 20770 | 3.3% | 2.2%(+1.09)#78 | 2.1%(+1.24)#3,423 |
| 79. | 20866 | 3.3% | 2.2%(+1.08)#79 | 2.1%(+1.23)#3,434 |
| 80. | 21136 | 3.3% | 2.2%(+1.04)#80 | 2.1%(+1.19)#3,506 |
| 81. | 21114 | 3.2% | 2.2%(+1.02)#81 | 2.1%(+1.18)#3,535 |
| 82. | 20776 | 3.2% | 2.2%(+0.996)#82 | 2.1%(+1.15)#3,591 |
| 83. | 21044 | 3.2% | 2.2%(+0.946)#83 | 2.1%(+1.10)#3,710 |
| 84. | 20874 | 3.2% | 2.2%(+0.941)#84 | 2.1%(+1.10)#3,720 |
| 85. | 21048 | 3.1% | 2.2%(+0.928)#85 | 2.1%(+1.08)#3,751 |
| 86. | 20882 | 3.1% | 2.2%(+0.925)#86 | 2.1%(+1.08)#3,756 |
| 87. | 21913 | 3.1% | 2.2%(+0.902)#87 | 2.1%(+1.06)#3,802 |
| 88. | 21209 | 3.1% | 2.2%(+0.896)#88 | 2.1%(+1.05)#3,822 |
| 89. | 21214 | 3.1% | 2.2%(+0.894)#89 | 2.1%(+1.05)#3,828 |
| 90. | 20611 | 3.1% | 2.2%(+0.890)#90 | 2.1%(+1.04)#3,842 |
| 91. | 21409 | 3.1% | 2.2%(+0.855)#91 | 2.1%(+1.01)#3,920 |
| 92. | 20772 | 3.1% | 2.2%(+0.837)#92 | 2.1%(+0.992)#3,965 |
| 93. | 21557 | 3.0% | 2.2%(+0.831)#93 | 2.1%(+0.985)#3,982 |
| 94. | 20837 | 3.0% | 2.2%(+0.822)#94 | 2.1%(+0.977)#3,998 |
| 95. | 21660 | 3.0% | 2.2%(+0.810)#95 | 2.1%(+0.965)#4,024 |
| 96. | 21158 | 3.0% | 2.2%(+0.763)#96 | 2.1%(+0.918)#4,137 |
| 97. | 21663 | 3.0% | 2.2%(+0.760)#97 | 2.1%(+0.915)#4,145 |
| 98. | 20765 | 3.0% | 2.2%(+0.747)#98 | 2.1%(+0.902)#4,174 |
| 99. | 21205 | 3.0% | 2.2%(+0.738)#99 | 2.1%(+0.893)#4,200 |
| 100. | 20861 | 2.9% | 2.2%(+0.728)#100 | 2.1%(+0.882)#4,220 |
Common Questions
What are the Top 10 Zip Codes with the Highest Percentage of Population Employed in Arts, Media & Entertainment in Maryland?
Top 10 Zip Codes with the Highest Percentage of Population Employed in Arts, Media & Entertainment in Maryland are:
What zip code has the Highest Percentage of Population Employed in Arts, Media & Entertainment in Maryland?
20812 has the Highest Percentage of Population Employed in Arts, Media & Entertainment in Maryland with 10.2%.
What is the Percentage of Population Employed in Arts, Media & Entertainment in the State of Maryland?
Percentage of Population Employed in Arts, Media & Entertainment in Maryland is 2.2%.
What is the Percentage of Population Employed in Arts, Media & Entertainment in the United States?
Percentage of Population Employed in Arts, Media & Entertainment in the United States is 2.1%.