Zip Codes with the Highest Percentage of Population Employed in Arts, Media & Entertainment in Idaho
RELATED REPORTS & OPTIONS
Arts, Media & Entertainment
Idaho
Compare Zip Codes
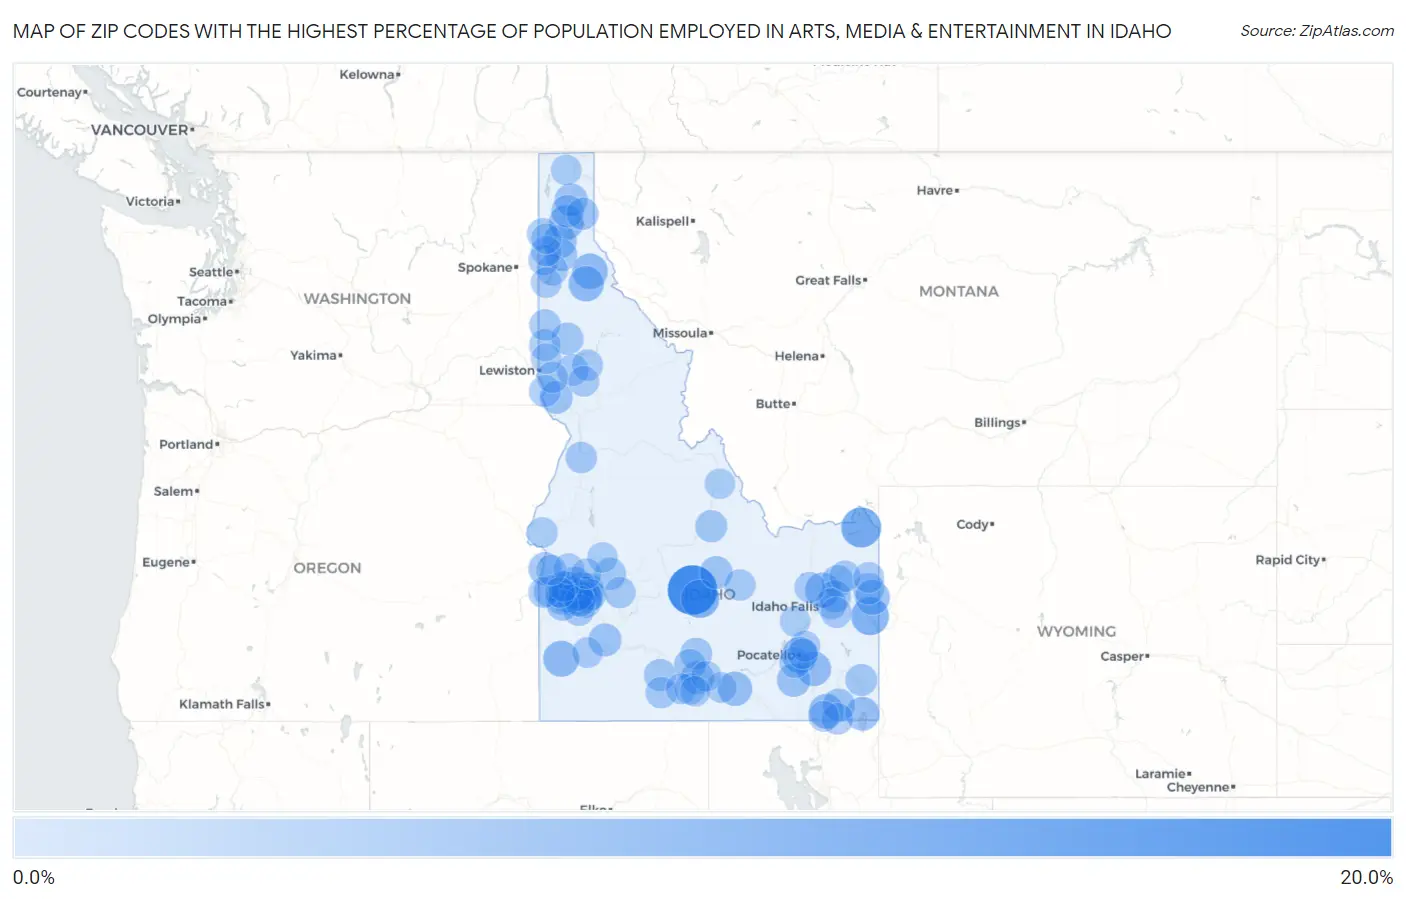
Map of Zip Codes with the Highest Percentage of Population Employed in Arts, Media & Entertainment in Idaho
0.0%
20.0%
Zip Codes with the Highest Percentage of Population Employed in Arts, Media & Entertainment in Idaho
| Zip Code | % Employed | vs State | vs National | |
| 1. | 83353 | 17.5% | 1.8%(+15.7)#1 | 2.1%(+15.4)#125 |
| 2. | 83429 | 9.2% | 1.8%(+7.39)#2 | 2.1%(+7.12)#438 |
| 3. | 83333 | 7.6% | 1.8%(+5.83)#3 | 2.1%(+5.56)#619 |
| 4. | 83428 | 7.4% | 1.8%(+5.56)#4 | 2.1%(+5.29)#678 |
| 5. | 83209 | 5.7% | 1.8%(+3.93)#5 | 2.1%(+3.66)#1,150 |
| 6. | 83650 | 5.7% | 1.8%(+3.88)#6 | 2.1%(+3.62)#1,166 |
| 7. | 83839 | 5.3% | 1.8%(+3.46)#7 | 2.1%(+3.19)#1,375 |
| 8. | 83850 | 5.2% | 1.8%(+3.36)#8 | 2.1%(+3.09)#1,420 |
| 9. | 83860 | 4.7% | 1.8%(+2.88)#9 | 2.1%(+2.61)#1,711 |
| 10. | 83455 | 4.7% | 1.8%(+2.88)#10 | 2.1%(+2.61)#1,716 |
| 11. | 83431 | 4.6% | 1.8%(+2.83)#11 | 2.1%(+2.56)#1,762 |
| 12. | 83250 | 4.6% | 1.8%(+2.78)#12 | 2.1%(+2.51)#1,802 |
| 13. | 83232 | 4.6% | 1.8%(+2.77)#13 | 2.1%(+2.50)#1,808 |
| 14. | 83311 | 4.3% | 1.8%(+2.54)#14 | 2.1%(+2.27)#2,001 |
| 15. | 83616 | 3.9% | 1.8%(+2.13)#15 | 2.1%(+1.86)#2,475 |
| 16. | 83272 | 3.8% | 1.8%(+2.02)#16 | 2.1%(+1.76)#2,605 |
| 17. | 83212 | 3.6% | 1.8%(+1.82)#17 | 2.1%(+1.55)#2,895 |
| 18. | 83801 | 3.6% | 1.8%(+1.81)#18 | 2.1%(+1.55)#2,900 |
| 19. | 83702 | 3.5% | 1.8%(+1.71)#19 | 2.1%(+1.45)#3,061 |
| 20. | 83714 | 3.5% | 1.8%(+1.68)#20 | 2.1%(+1.41)#3,108 |
| 21. | 83705 | 3.3% | 1.8%(+1.53)#21 | 2.1%(+1.27)#3,385 |
| 22. | 83619 | 3.3% | 1.8%(+1.49)#22 | 2.1%(+1.22)#3,453 |
| 23. | 83864 | 3.2% | 1.8%(+1.40)#23 | 2.1%(+1.13)#3,636 |
| 24. | 83703 | 3.2% | 1.8%(+1.38)#24 | 2.1%(+1.11)#3,676 |
| 25. | 83648 | 3.1% | 1.8%(+1.32)#25 | 2.1%(+1.06)#3,803 |
| 26. | 83325 | 3.1% | 1.8%(+1.30)#26 | 2.1%(+1.04)#3,860 |
| 27. | 83251 | 3.0% | 1.8%(+1.21)#27 | 2.1%(+0.939)#4,074 |
| 28. | 83263 | 3.0% | 1.8%(+1.19)#28 | 2.1%(+0.920)#4,134 |
| 29. | 83555 | 2.9% | 1.8%(+1.13)#29 | 2.1%(+0.859)#4,289 |
| 30. | 83646 | 2.8% | 1.8%(+0.995)#30 | 2.1%(+0.726)#4,654 |
| 31. | 83840 | 2.7% | 1.8%(+0.947)#31 | 2.1%(+0.679)#4,791 |
| 32. | 83626 | 2.6% | 1.8%(+0.843)#32 | 2.1%(+0.575)#5,112 |
| 33. | 83836 | 2.5% | 1.8%(+0.691)#33 | 2.1%(+0.422)#5,611 |
| 34. | 83316 | 2.4% | 1.8%(+0.629)#34 | 2.1%(+0.361)#5,856 |
| 35. | 83631 | 2.4% | 1.8%(+0.628)#35 | 2.1%(+0.360)#5,859 |
| 36. | 83823 | 2.4% | 1.8%(+0.624)#36 | 2.1%(+0.356)#5,877 |
| 37. | 83440 | 2.4% | 1.8%(+0.615)#37 | 2.1%(+0.346)#5,913 |
| 38. | 83642 | 2.4% | 1.8%(+0.603)#38 | 2.1%(+0.334)#5,955 |
| 39. | 83226 | 2.3% | 1.8%(+0.548)#39 | 2.1%(+0.280)#6,184 |
| 40. | 83704 | 2.3% | 1.8%(+0.545)#40 | 2.1%(+0.277)#6,195 |
| 41. | 83835 | 2.3% | 1.8%(+0.516)#41 | 2.1%(+0.248)#6,345 |
| 42. | 83324 | 2.3% | 1.8%(+0.488)#42 | 2.1%(+0.219)#6,460 |
| 43. | 83706 | 2.3% | 1.8%(+0.459)#43 | 2.1%(+0.190)#6,599 |
| 44. | 83338 | 2.2% | 1.8%(+0.440)#44 | 2.1%(+0.172)#6,679 |
| 45. | 83442 | 2.2% | 1.8%(+0.428)#45 | 2.1%(+0.159)#6,734 |
| 46. | 83712 | 2.2% | 1.8%(+0.418)#46 | 2.1%(+0.150)#6,778 |
| 47. | 83239 | 2.2% | 1.8%(+0.376)#47 | 2.1%(+0.107)#6,967 |
| 48. | 83687 | 2.2% | 1.8%(+0.358)#48 | 2.1%(+0.089)#7,052 |
| 49. | 83651 | 2.1% | 1.8%(+0.310)#49 | 2.1%(+0.041)#7,272 |
| 50. | 83669 | 2.1% | 1.8%(+0.287)#50 | 2.1%(+0.019)#7,386 |
| 51. | 83501 | 2.1% | 1.8%(+0.286)#51 | 2.1%(+0.018)#7,390 |
| 52. | 83237 | 2.0% | 1.8%(+0.245)#52 | 2.1%(-0.023)#7,615 |
| 53. | 83843 | 2.0% | 1.8%(+0.218)#53 | 2.1%(-0.050)#7,758 |
| 54. | 83545 | 2.0% | 1.8%(+0.168)#54 | 2.1%(-0.100)#8,024 |
| 55. | 83321 | 2.0% | 1.8%(+0.159)#55 | 2.1%(-0.110)#8,083 |
| 56. | 83422 | 1.9% | 1.8%(+0.118)#56 | 2.1%(-0.151)#8,310 |
| 57. | 83634 | 1.9% | 1.8%(+0.115)#57 | 2.1%(-0.154)#8,322 |
| 58. | 83713 | 1.9% | 1.8%(+0.082)#58 | 2.1%(-0.187)#8,531 |
| 59. | 83855 | 1.9% | 1.8%(+0.076)#59 | 2.1%(-0.193)#8,565 |
| 60. | 83549 | 1.8% | 1.8%(+0.026)#60 | 2.1%(-0.243)#8,876 |
| 61. | 83686 | 1.8% | 1.8%(+0.008)#61 | 2.1%(-0.260)#8,974 |
| 62. | 83716 | 1.8% | 1.8%(-0.035)#62 | 2.1%(-0.304)#9,229 |
| 63. | 83341 | 1.7% | 1.8%(-0.057)#63 | 2.1%(-0.326)#9,370 |
| 64. | 83451 | 1.7% | 1.8%(-0.106)#64 | 2.1%(-0.374)#9,727 |
| 65. | 83255 | 1.7% | 1.8%(-0.118)#65 | 2.1%(-0.386)#9,822 |
| 66. | 83540 | 1.7% | 1.8%(-0.132)#66 | 2.1%(-0.400)#9,918 |
| 67. | 83401 | 1.6% | 1.8%(-0.196)#67 | 2.1%(-0.464)#10,359 |
| 68. | 83544 | 1.5% | 1.8%(-0.252)#68 | 2.1%(-0.521)#10,717 |
| 69. | 83804 | 1.5% | 1.8%(-0.273)#69 | 2.1%(-0.541)#10,853 |
| 70. | 83204 | 1.5% | 1.8%(-0.279)#70 | 2.1%(-0.547)#10,893 |
| 71. | 83709 | 1.5% | 1.8%(-0.322)#71 | 2.1%(-0.590)#11,186 |
| 72. | 83676 | 1.5% | 1.8%(-0.342)#72 | 2.1%(-0.611)#11,350 |
| 73. | 83814 | 1.4% | 1.8%(-0.348)#73 | 2.1%(-0.616)#11,384 |
| 74. | 83452 | 1.4% | 1.8%(-0.362)#74 | 2.1%(-0.630)#11,486 |
| 75. | 83854 | 1.4% | 1.8%(-0.370)#75 | 2.1%(-0.638)#11,548 |
| 76. | 83427 | 1.4% | 1.8%(-0.384)#76 | 2.1%(-0.652)#11,655 |
| 77. | 83301 | 1.4% | 1.8%(-0.416)#77 | 2.1%(-0.684)#11,872 |
| 78. | 83286 | 1.4% | 1.8%(-0.423)#78 | 2.1%(-0.691)#11,916 |
| 79. | 83444 | 1.4% | 1.8%(-0.423)#79 | 2.1%(-0.691)#11,917 |
| 80. | 83543 | 1.3% | 1.8%(-0.521)#80 | 2.1%(-0.790)#12,664 |
| 81. | 83876 | 1.3% | 1.8%(-0.539)#81 | 2.1%(-0.807)#12,819 |
| 82. | 83644 | 1.3% | 1.8%(-0.541)#82 | 2.1%(-0.810)#12,845 |
| 83. | 83624 | 1.2% | 1.8%(-0.608)#83 | 2.1%(-0.876)#13,334 |
| 84. | 83617 | 1.2% | 1.8%(-0.620)#84 | 2.1%(-0.888)#13,417 |
| 85. | 83858 | 1.2% | 1.8%(-0.625)#85 | 2.1%(-0.893)#13,456 |
| 86. | 83318 | 1.2% | 1.8%(-0.627)#86 | 2.1%(-0.896)#13,467 |
| 87. | 83202 | 1.2% | 1.8%(-0.630)#87 | 2.1%(-0.898)#13,491 |
| 88. | 83605 | 1.1% | 1.8%(-0.666)#88 | 2.1%(-0.934)#13,777 |
| 89. | 83805 | 1.1% | 1.8%(-0.678)#89 | 2.1%(-0.947)#13,876 |
| 90. | 83629 | 1.1% | 1.8%(-0.719)#90 | 2.1%(-0.987)#14,209 |
| 91. | 83832 | 1.1% | 1.8%(-0.720)#91 | 2.1%(-0.988)#14,219 |
| 92. | 83869 | 1.1% | 1.8%(-0.722)#92 | 2.1%(-0.991)#14,236 |
| 93. | 83335 | 1.1% | 1.8%(-0.728)#93 | 2.1%(-0.996)#14,273 |
| 94. | 83672 | 1.1% | 1.8%(-0.728)#94 | 2.1%(-0.996)#14,275 |
| 95. | 83655 | 1.1% | 1.8%(-0.730)#95 | 2.1%(-0.998)#14,292 |
| 96. | 83201 | 1.1% | 1.8%(-0.732)#96 | 2.1%(-1.00)#14,311 |
| 97. | 83221 | 1.0% | 1.8%(-0.755)#97 | 2.1%(-1.02)#14,516 |
| 98. | 83622 | 1.00% | 1.8%(-0.796)#98 | 2.1%(-1.06)#14,831 |
| 99. | 83467 | 0.97% | 1.8%(-0.827)#99 | 2.1%(-1.10)#15,100 |
| 100. | 83334 | 0.95% | 1.8%(-0.846)#100 | 2.1%(-1.11)#15,254 |
Common Questions
What are the Top 10 Zip Codes with the Highest Percentage of Population Employed in Arts, Media & Entertainment in Idaho?
Top 10 Zip Codes with the Highest Percentage of Population Employed in Arts, Media & Entertainment in Idaho are:
What zip code has the Highest Percentage of Population Employed in Arts, Media & Entertainment in Idaho?
83353 has the Highest Percentage of Population Employed in Arts, Media & Entertainment in Idaho with 17.5%.
What is the Percentage of Population Employed in Arts, Media & Entertainment in the State of Idaho?
Percentage of Population Employed in Arts, Media & Entertainment in Idaho is 1.8%.
What is the Percentage of Population Employed in Arts, Media & Entertainment in the United States?
Percentage of Population Employed in Arts, Media & Entertainment in the United States is 2.1%.