Zip Codes with the Highest Percentage of Population Employed in Arts, Media & Entertainment in Arkansas
RELATED REPORTS & OPTIONS
Arts, Media & Entertainment
Arkansas
Compare Zip Codes
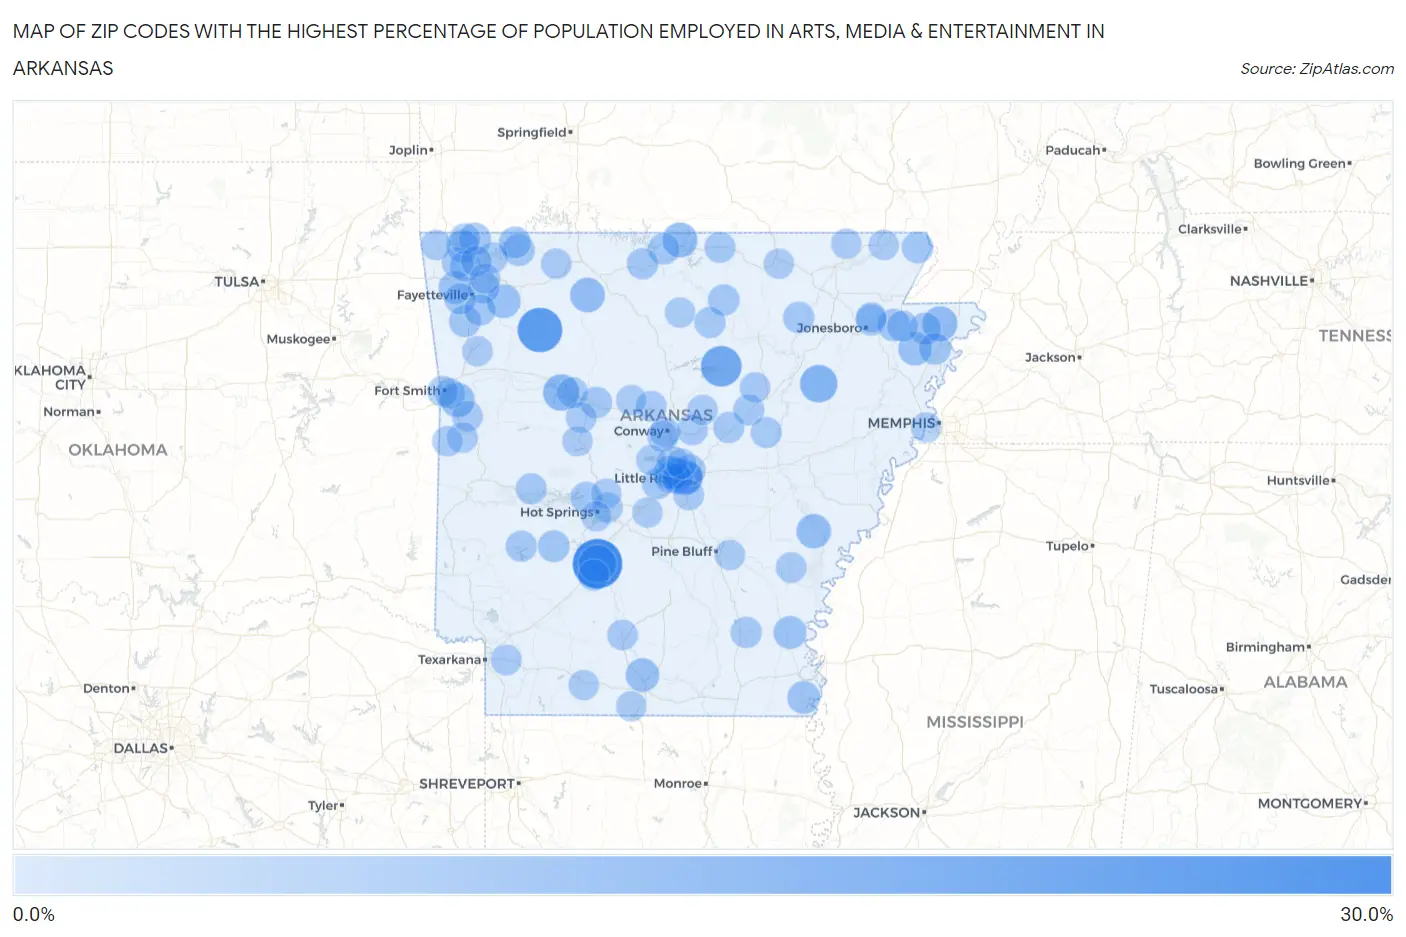
Map of Zip Codes with the Highest Percentage of Population Employed in Arts, Media & Entertainment in Arkansas
0.0%
30.0%
Zip Codes with the Highest Percentage of Population Employed in Arts, Media & Entertainment in Arkansas
| Zip Code | % Employed | vs State | vs National | |
| 1. | 71999 | 25.9% | 1.3%(+24.6)#1 | 2.1%(+23.9)#55 |
| 2. | 72752 | 19.4% | 1.3%(+18.1)#2 | 2.1%(+17.4)#101 |
| 3. | 72581 | 14.4% | 1.3%(+13.1)#3 | 2.1%(+12.3)#180 |
| 4. | 71998 | 10.6% | 1.3%(+9.26)#4 | 2.1%(+8.52)#332 |
| 5. | 72014 | 10.3% | 1.3%(+8.93)#5 | 2.1%(+8.20)#357 |
| 6. | 72845 | 8.9% | 1.3%(+7.60)#6 | 2.1%(+6.87)#456 |
| 7. | 72201 | 7.5% | 1.3%(+6.21)#7 | 2.1%(+5.48)#639 |
| 8. | 72426 | 7.1% | 1.3%(+5.73)#8 | 2.1%(+5.00)#747 |
| 9. | 72623 | 7.0% | 1.3%(+5.72)#9 | 2.1%(+4.98)#755 |
| 10. | 72648 | 6.7% | 1.3%(+5.37)#10 | 2.1%(+4.64)#834 |
| 11. | 72140 | 6.5% | 1.3%(+5.13)#11 | 2.1%(+4.39)#886 |
| 12. | 72923 | 6.3% | 1.3%(+5.02)#12 | 2.1%(+4.29)#916 |
| 13. | 72773 | 5.5% | 1.3%(+4.19)#13 | 2.1%(+3.46)#1,237 |
| 14. | 71759 | 5.3% | 1.3%(+3.96)#14 | 2.1%(+3.23)#1,354 |
| 15. | 72391 | 5.3% | 1.3%(+3.94)#15 | 2.1%(+3.20)#1,369 |
| 16. | 71654 | 4.7% | 1.3%(+3.38)#16 | 2.1%(+2.64)#1,691 |
| 17. | 72212 | 4.6% | 1.3%(+3.27)#17 | 2.1%(+2.54)#1,781 |
| 18. | 71640 | 4.5% | 1.3%(+3.13)#18 | 2.1%(+2.40)#1,892 |
| 19. | 72704 | 4.2% | 1.3%(+2.91)#19 | 2.1%(+2.18)#2,103 |
| 20. | 72202 | 4.2% | 1.3%(+2.90)#20 | 2.1%(+2.17)#2,118 |
| 21. | 72437 | 3.9% | 1.3%(+2.60)#21 | 2.1%(+1.87)#2,457 |
| 22. | 72712 | 3.7% | 1.3%(+2.41)#22 | 2.1%(+1.67)#2,720 |
| 23. | 72442 | 3.6% | 1.3%(+2.28)#23 | 2.1%(+1.54)#2,903 |
| 24. | 72632 | 3.4% | 1.3%(+2.10)#24 | 2.1%(+1.37)#3,179 |
| 25. | 72751 | 3.4% | 1.3%(+2.09)#25 | 2.1%(+1.35)#3,215 |
| 26. | 72351 | 3.3% | 1.3%(+2.02)#26 | 2.1%(+1.28)#3,348 |
| 27. | 72631 | 3.3% | 1.3%(+1.96)#27 | 2.1%(+1.22)#3,454 |
| 28. | 72703 | 3.2% | 1.3%(+1.84)#28 | 2.1%(+1.10)#3,703 |
| 29. | 72774 | 3.1% | 1.3%(+1.81)#29 | 2.1%(+1.08)#3,762 |
| 30. | 71921 | 3.1% | 1.3%(+1.79)#30 | 2.1%(+1.06)#3,797 |
| 31. | 72454 | 3.0% | 1.3%(+1.66)#31 | 2.1%(+0.928)#4,116 |
| 32. | 72802 | 3.0% | 1.3%(+1.65)#32 | 2.1%(+0.910)#4,155 |
| 33. | 72651 | 2.9% | 1.3%(+1.61)#33 | 2.1%(+0.871)#4,257 |
| 34. | 72556 | 2.9% | 1.3%(+1.57)#34 | 2.1%(+0.840)#4,348 |
| 35. | 72207 | 2.9% | 1.3%(+1.55)#35 | 2.1%(+0.813)#4,413 |
| 36. | 71956 | 2.7% | 1.3%(+1.35)#36 | 2.1%(+0.613)#4,984 |
| 37. | 72730 | 2.6% | 1.3%(+1.32)#37 | 2.1%(+0.586)#5,072 |
| 38. | 72116 | 2.6% | 1.3%(+1.31)#38 | 2.1%(+0.577)#5,102 |
| 39. | 72227 | 2.6% | 1.3%(+1.31)#39 | 2.1%(+0.571)#5,128 |
| 40. | 72572 | 2.6% | 1.3%(+1.31)#40 | 2.1%(+0.571)#5,135 |
| 41. | 72701 | 2.6% | 1.3%(+1.29)#41 | 2.1%(+0.550)#5,193 |
| 42. | 72687 | 2.6% | 1.3%(+1.27)#42 | 2.1%(+0.535)#5,249 |
| 43. | 71923 | 2.6% | 1.3%(+1.25)#43 | 2.1%(+0.513)#5,318 |
| 44. | 72713 | 2.4% | 1.3%(+1.11)#44 | 2.1%(+0.376)#5,798 |
| 45. | 71655 | 2.4% | 1.3%(+1.10)#45 | 2.1%(+0.366)#5,832 |
| 46. | 72560 | 2.4% | 1.3%(+1.10)#46 | 2.1%(+0.362)#5,847 |
| 47. | 72012 | 2.4% | 1.3%(+1.06)#47 | 2.1%(+0.320)#6,000 |
| 48. | 72583 | 2.4% | 1.3%(+1.02)#48 | 2.1%(+0.290)#6,133 |
| 49. | 71950 | 2.3% | 1.3%(+1.02)#49 | 2.1%(+0.288)#6,145 |
| 50. | 71969 | 2.3% | 1.3%(+0.999)#50 | 2.1%(+0.265)#6,267 |
| 51. | 72143 | 2.3% | 1.3%(+0.989)#51 | 2.1%(+0.255)#6,313 |
| 52. | 72401 | 2.2% | 1.3%(+0.911)#52 | 2.1%(+0.176)#6,657 |
| 53. | 72211 | 2.1% | 1.3%(+0.799)#53 | 2.1%(+0.064)#7,146 |
| 54. | 72060 | 2.1% | 1.3%(+0.790)#54 | 2.1%(+0.055)#7,191 |
| 55. | 72210 | 2.1% | 1.3%(+0.773)#55 | 2.1%(+0.039)#7,281 |
| 56. | 72718 | 2.1% | 1.3%(+0.760)#56 | 2.1%(+0.025)#7,352 |
| 57. | 72414 | 2.1% | 1.3%(+0.757)#57 | 2.1%(+0.022)#7,370 |
| 58. | 72756 | 2.0% | 1.3%(+0.716)#58 | 2.1%(-0.019)#7,584 |
| 59. | 72714 | 2.0% | 1.3%(+0.678)#59 | 2.1%(-0.057)#7,801 |
| 60. | 72034 | 2.0% | 1.3%(+0.669)#60 | 2.1%(-0.066)#7,837 |
| 61. | 72936 | 2.0% | 1.3%(+0.630)#61 | 2.1%(-0.105)#8,048 |
| 62. | 72847 | 1.9% | 1.3%(+0.576)#62 | 2.1%(-0.159)#8,360 |
| 63. | 72035 | 1.9% | 1.3%(+0.549)#63 | 2.1%(-0.186)#8,522 |
| 64. | 72157 | 1.9% | 1.3%(+0.540)#64 | 2.1%(-0.195)#8,583 |
| 65. | 72944 | 1.9% | 1.3%(+0.531)#65 | 2.1%(-0.204)#8,633 |
| 66. | 71854 | 1.8% | 1.3%(+0.516)#66 | 2.1%(-0.219)#8,717 |
| 67. | 72205 | 1.8% | 1.3%(+0.490)#67 | 2.1%(-0.245)#8,893 |
| 68. | 72173 | 1.8% | 1.3%(+0.466)#68 | 2.1%(-0.269)#9,020 |
| 69. | 72055 | 1.8% | 1.3%(+0.453)#69 | 2.1%(-0.282)#9,099 |
| 70. | 72834 | 1.7% | 1.3%(+0.423)#70 | 2.1%(-0.312)#9,277 |
| 71. | 72638 | 1.7% | 1.3%(+0.421)#71 | 2.1%(-0.313)#9,287 |
| 72. | 72758 | 1.7% | 1.3%(+0.389)#72 | 2.1%(-0.345)#9,499 |
| 73. | 72206 | 1.7% | 1.3%(+0.385)#73 | 2.1%(-0.350)#9,538 |
| 74. | 72081 | 1.7% | 1.3%(+0.350)#74 | 2.1%(-0.385)#9,809 |
| 75. | 71701 | 1.7% | 1.3%(+0.328)#75 | 2.1%(-0.407)#9,963 |
| 76. | 71901 | 1.6% | 1.3%(+0.298)#76 | 2.1%(-0.437)#10,173 |
| 77. | 72764 | 1.6% | 1.3%(+0.298)#77 | 2.1%(-0.437)#10,174 |
| 78. | 72901 | 1.6% | 1.3%(+0.273)#78 | 2.1%(-0.462)#10,341 |
| 79. | 71909 | 1.6% | 1.3%(+0.246)#79 | 2.1%(-0.489)#10,506 |
| 80. | 72938 | 1.6% | 1.3%(+0.239)#80 | 2.1%(-0.495)#10,543 |
| 81. | 72444 | 1.5% | 1.3%(+0.178)#81 | 2.1%(-0.557)#10,962 |
| 82. | 72736 | 1.5% | 1.3%(+0.158)#82 | 2.1%(-0.577)#11,077 |
| 83. | 72903 | 1.5% | 1.3%(+0.153)#83 | 2.1%(-0.582)#11,116 |
| 84. | 72113 | 1.5% | 1.3%(+0.150)#84 | 2.1%(-0.585)#11,137 |
| 85. | 72063 | 1.5% | 1.3%(+0.148)#85 | 2.1%(-0.586)#11,154 |
| 86. | 72946 | 1.5% | 1.3%(+0.143)#86 | 2.1%(-0.591)#11,195 |
| 87. | 72301 | 1.4% | 1.3%(+0.119)#87 | 2.1%(-0.615)#11,374 |
| 88. | 71913 | 1.4% | 1.3%(+0.112)#88 | 2.1%(-0.622)#11,433 |
| 89. | 72405 | 1.4% | 1.3%(+0.112)#89 | 2.1%(-0.622)#11,434 |
| 90. | 72118 | 1.4% | 1.3%(+0.112)#90 | 2.1%(-0.623)#11,435 |
| 91. | 72015 | 1.4% | 1.3%(+0.100)#91 | 2.1%(-0.635)#11,518 |
| 92. | 72111 | 1.4% | 1.3%(+0.087)#92 | 2.1%(-0.647)#11,618 |
| 93. | 72663 | 1.4% | 1.3%(+0.069)#93 | 2.1%(-0.666)#11,751 |
| 94. | 72542 | 1.4% | 1.3%(+0.065)#94 | 2.1%(-0.670)#11,780 |
| 95. | 72853 | 1.4% | 1.3%(+0.063)#95 | 2.1%(-0.672)#11,789 |
| 96. | 72422 | 1.4% | 1.3%(+0.050)#96 | 2.1%(-0.685)#11,880 |
| 97. | 72135 | 1.4% | 1.3%(+0.045)#97 | 2.1%(-0.690)#11,909 |
| 98. | 71601 | 1.4% | 1.3%(+0.042)#98 | 2.1%(-0.693)#11,935 |
| 99. | 71749 | 1.3% | 1.3%(+0.017)#99 | 2.1%(-0.717)#12,132 |
| 100. | 71753 | 1.3% | 1.3%(+0.015)#100 | 2.1%(-0.720)#12,149 |
Common Questions
What are the Top 10 Zip Codes with the Highest Percentage of Population Employed in Arts, Media & Entertainment in Arkansas?
Top 10 Zip Codes with the Highest Percentage of Population Employed in Arts, Media & Entertainment in Arkansas are:
What zip code has the Highest Percentage of Population Employed in Arts, Media & Entertainment in Arkansas?
71999 has the Highest Percentage of Population Employed in Arts, Media & Entertainment in Arkansas with 25.9%.
What is the Percentage of Population Employed in Arts, Media & Entertainment in the State of Arkansas?
Percentage of Population Employed in Arts, Media & Entertainment in Arkansas is 1.3%.
What is the Percentage of Population Employed in Arts, Media & Entertainment in the United States?
Percentage of Population Employed in Arts, Media & Entertainment in the United States is 2.1%.