Zip Codes with the Highest Percentage of Population Employed in Arts, Media & Entertainment in Alaska
RELATED REPORTS & OPTIONS
Arts, Media & Entertainment
Alaska
Compare Zip Codes
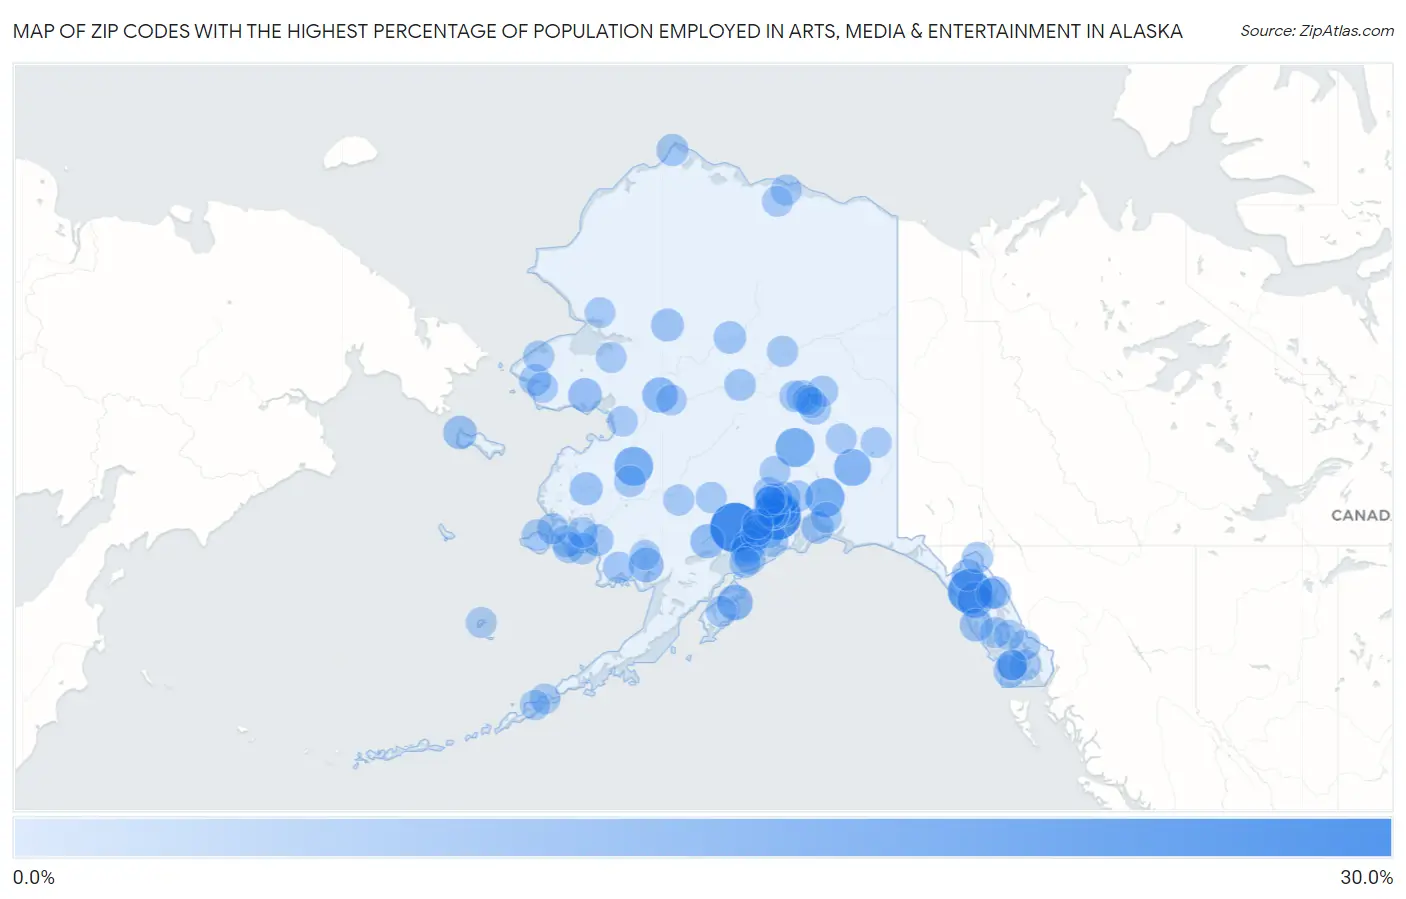
Map of Zip Codes with the Highest Percentage of Population Employed in Arts, Media & Entertainment in Alaska
0.0%
30.0%
Zip Codes with the Highest Percentage of Population Employed in Arts, Media & Entertainment in Alaska
| Zip Code | % Employed | vs State | vs National | |
| 1. | 99635 | 28.7% | 1.7%(+27.0)#1 | 2.1%(+26.6)#43 |
| 2. | 99540 | 25.0% | 1.7%(+23.3)#2 | 2.1%(+22.9)#62 |
| 3. | 99826 | 20.8% | 1.7%(+19.1)#3 | 2.1%(+18.7)#85 |
| 4. | 99573 | 12.8% | 1.7%(+11.1)#4 | 2.1%(+10.7)#222 |
| 5. | 99729 | 12.5% | 1.7%(+10.8)#5 | 2.1%(+10.4)#233 |
| 6. | 99665 | 12.5% | 1.7%(+10.8)#6 | 2.1%(+10.4)#234 |
| 7. | 99586 | 9.8% | 1.7%(+8.07)#7 | 2.1%(+7.70)#392 |
| 8. | 99644 | 7.8% | 1.7%(+6.16)#8 | 2.1%(+5.78)#572 |
| 9. | 99841 | 7.8% | 1.7%(+6.13)#9 | 2.1%(+5.75)#577 |
| 10. | 99754 | 7.3% | 1.7%(+5.63)#10 | 2.1%(+5.26)#686 |
| 11. | 99555 | 6.2% | 1.7%(+4.57)#11 | 2.1%(+4.19)#955 |
| 12. | 99653 | 5.8% | 1.7%(+4.09)#12 | 2.1%(+3.71)#1,132 |
| 13. | 99572 | 5.3% | 1.7%(+3.58)#13 | 2.1%(+3.20)#1,366 |
| 14. | 99739 | 5.0% | 1.7%(+3.32)#14 | 2.1%(+2.94)#1,501 |
| 15. | 99742 | 4.8% | 1.7%(+3.16)#15 | 2.1%(+2.78)#1,590 |
| 16. | 99639 | 4.8% | 1.7%(+3.15)#16 | 2.1%(+2.77)#1,595 |
| 17. | 99567 | 4.2% | 1.7%(+2.52)#17 | 2.1%(+2.14)#2,150 |
| 18. | 99515 | 4.1% | 1.7%(+2.43)#18 | 2.1%(+2.05)#2,239 |
| 19. | 99505 | 4.1% | 1.7%(+2.38)#19 | 2.1%(+2.01)#2,284 |
| 20. | 99835 | 3.9% | 1.7%(+2.26)#20 | 2.1%(+1.88)#2,439 |
| 21. | 99650 | 3.8% | 1.7%(+2.13)#21 | 2.1%(+1.75)#2,617 |
| 22. | 99773 | 3.8% | 1.7%(+2.11)#22 | 2.1%(+1.74)#2,627 |
| 23. | 99922 | 3.7% | 1.7%(+2.02)#23 | 2.1%(+1.64)#2,767 |
| 24. | 99720 | 3.2% | 1.7%(+1.54)#24 | 2.1%(+1.16)#3,558 |
| 25. | 99574 | 3.1% | 1.7%(+1.38)#25 | 2.1%(+1.01)#3,928 |
| 26. | 99502 | 2.9% | 1.7%(+1.24)#26 | 2.1%(+0.865)#4,274 |
| 27. | 99703 | 2.9% | 1.7%(+1.24)#27 | 2.1%(+0.859)#4,288 |
| 28. | 99578 | 2.7% | 1.7%(+1.06)#28 | 2.1%(+0.679)#4,792 |
| 29. | 99801 | 2.7% | 1.7%(+1.04)#29 | 2.1%(+0.658)#4,854 |
| 30. | 99556 | 2.6% | 1.7%(+0.953)#30 | 2.1%(+0.576)#5,111 |
| 31. | 99723 | 2.6% | 1.7%(+0.896)#31 | 2.1%(+0.519)#5,297 |
| 32. | 99577 | 2.4% | 1.7%(+0.703)#32 | 2.1%(+0.326)#5,984 |
| 33. | 99518 | 2.4% | 1.7%(+0.685)#33 | 2.1%(+0.307)#6,062 |
| 34. | 99827 | 2.2% | 1.7%(+0.477)#34 | 2.1%(+0.100)#7,000 |
| 35. | 99777 | 2.2% | 1.7%(+0.467)#35 | 2.1%(+0.090)#7,050 |
| 36. | 99714 | 2.1% | 1.7%(+0.384)#36 | 2.1%(+0.006)#7,451 |
| 37. | 99678 | 2.0% | 1.7%(+0.324)#37 | 2.1%(-0.053)#7,774 |
| 38. | 99785 | 2.0% | 1.7%(+0.303)#38 | 2.1%(-0.074)#7,880 |
| 39. | 99506 | 2.0% | 1.7%(+0.272)#39 | 2.1%(-0.105)#8,052 |
| 40. | 99664 | 1.9% | 1.7%(+0.238)#40 | 2.1%(-0.139)#8,246 |
| 41. | 99630 | 1.9% | 1.7%(+0.186)#41 | 2.1%(-0.192)#8,561 |
| 42. | 99602 | 1.9% | 1.7%(+0.168)#42 | 2.1%(-0.209)#8,663 |
| 43. | 99508 | 1.8% | 1.7%(+0.142)#43 | 2.1%(-0.236)#8,823 |
| 44. | 99674 | 1.8% | 1.7%(+0.138)#44 | 2.1%(-0.239)#8,849 |
| 45. | 99501 | 1.8% | 1.7%(+0.110)#45 | 2.1%(-0.267)#9,011 |
| 46. | 99507 | 1.8% | 1.7%(+0.067)#46 | 2.1%(-0.311)#9,267 |
| 47. | 99623 | 1.7% | 1.7%(+0.047)#47 | 2.1%(-0.330)#9,405 |
| 48. | 99561 | 1.7% | 1.7%(+0.026)#48 | 2.1%(-0.352)#9,553 |
| 49. | 99669 | 1.7% | 1.7%(+0.010)#49 | 2.1%(-0.368)#9,678 |
| 50. | 99504 | 1.7% | 1.7%(-0.002)#50 | 2.1%(-0.379)#9,761 |
| 51. | 99603 | 1.7% | 1.7%(-0.004)#51 | 2.1%(-0.381)#9,775 |
| 52. | 99622 | 1.6% | 1.7%(-0.044)#52 | 2.1%(-0.422)#10,073 |
| 53. | 99645 | 1.6% | 1.7%(-0.111)#53 | 2.1%(-0.488)#10,502 |
| 54. | 99614 | 1.5% | 1.7%(-0.224)#54 | 2.1%(-0.601)#11,268 |
| 55. | 99681 | 1.5% | 1.7%(-0.224)#55 | 2.1%(-0.601)#11,270 |
| 56. | 99709 | 1.4% | 1.7%(-0.234)#56 | 2.1%(-0.611)#11,354 |
| 57. | 99772 | 1.4% | 1.7%(-0.245)#57 | 2.1%(-0.622)#11,425 |
| 58. | 99712 | 1.4% | 1.7%(-0.304)#58 | 2.1%(-0.681)#11,847 |
| 59. | 99557 | 1.4% | 1.7%(-0.310)#59 | 2.1%(-0.687)#11,893 |
| 60. | 99503 | 1.3% | 1.7%(-0.401)#60 | 2.1%(-0.779)#12,582 |
| 61. | 99516 | 1.3% | 1.7%(-0.423)#61 | 2.1%(-0.800)#12,763 |
| 62. | 99517 | 1.2% | 1.7%(-0.475)#62 | 2.1%(-0.852)#13,156 |
| 63. | 99688 | 1.2% | 1.7%(-0.487)#63 | 2.1%(-0.865)#13,258 |
| 64. | 99663 | 1.2% | 1.7%(-0.527)#64 | 2.1%(-0.905)#13,540 |
| 65. | 99901 | 1.1% | 1.7%(-0.536)#65 | 2.1%(-0.913)#13,606 |
| 66. | 99559 | 1.1% | 1.7%(-0.568)#66 | 2.1%(-0.945)#13,868 |
| 67. | 99830 | 1.1% | 1.7%(-0.597)#67 | 2.1%(-0.974)#14,107 |
| 68. | 99702 | 1.1% | 1.7%(-0.612)#68 | 2.1%(-0.989)#14,229 |
| 69. | 99672 | 1.1% | 1.7%(-0.617)#69 | 2.1%(-0.994)#14,264 |
| 70. | 99654 | 1.1% | 1.7%(-0.630)#70 | 2.1%(-1.01)#14,376 |
| 71. | 99686 | 1.0% | 1.7%(-0.636)#71 | 2.1%(-1.01)#14,431 |
| 72. | 99840 | 1.0% | 1.7%(-0.654)#72 | 2.1%(-1.03)#14,586 |
| 73. | 99701 | 1.0% | 1.7%(-0.678)#73 | 2.1%(-1.06)#14,758 |
| 74. | 99615 | 0.94% | 1.7%(-0.739)#74 | 2.1%(-1.12)#15,277 |
| 75. | 99734 | 0.92% | 1.7%(-0.760)#75 | 2.1%(-1.14)#15,437 |
| 76. | 99824 | 0.92% | 1.7%(-0.761)#76 | 2.1%(-1.14)#15,446 |
| 77. | 99519 | 0.90% | 1.7%(-0.785)#77 | 2.1%(-1.16)#15,645 |
| 78. | 99741 | 0.89% | 1.7%(-0.791)#78 | 2.1%(-1.17)#15,689 |
| 79. | 99925 | 0.89% | 1.7%(-0.797)#79 | 2.1%(-1.17)#15,747 |
| 80. | 99694 | 0.85% | 1.7%(-0.835)#80 | 2.1%(-1.21)#16,049 |
| 81. | 99780 | 0.79% | 1.7%(-0.894)#81 | 2.1%(-1.27)#16,510 |
| 82. | 99660 | 0.75% | 1.7%(-0.932)#82 | 2.1%(-1.31)#16,821 |
| 83. | 99762 | 0.74% | 1.7%(-0.948)#83 | 2.1%(-1.33)#16,941 |
| 84. | 99727 | 0.68% | 1.7%(-1.01)#84 | 2.1%(-1.39)#17,456 |
| 85. | 99676 | 0.65% | 1.7%(-1.03)#85 | 2.1%(-1.41)#17,654 |
| 86. | 99737 | 0.59% | 1.7%(-1.09)#86 | 2.1%(-1.47)#18,140 |
| 87. | 99684 | 0.50% | 1.7%(-1.18)#87 | 2.1%(-1.56)#18,821 |
| 88. | 99752 | 0.50% | 1.7%(-1.18)#88 | 2.1%(-1.56)#18,853 |
| 89. | 99611 | 0.47% | 1.7%(-1.21)#89 | 2.1%(-1.59)#19,106 |
| 90. | 99652 | 0.38% | 1.7%(-1.30)#90 | 2.1%(-1.68)#19,748 |
| 91. | 99705 | 0.27% | 1.7%(-1.42)#91 | 2.1%(-1.80)#20,579 |
| 92. | 99553 | 0.26% | 1.7%(-1.43)#92 | 2.1%(-1.81)#20,641 |
| 93. | 99929 | 0.25% | 1.7%(-1.44)#93 | 2.1%(-1.82)#20,696 |
| 94. | 99833 | 0.24% | 1.7%(-1.44)#94 | 2.1%(-1.82)#20,731 |
| 95. | 99921 | 0.21% | 1.7%(-1.48)#95 | 2.1%(-1.86)#20,934 |
| 96. | 99685 | 0.12% | 1.7%(-1.56)#96 | 2.1%(-1.94)#21,328 |
| 97. | 99576 | 0.083% | 1.7%(-1.60)#97 | 2.1%(-1.98)#21,451 |
Common Questions
What are the Top 10 Zip Codes with the Highest Percentage of Population Employed in Arts, Media & Entertainment in Alaska?
Top 10 Zip Codes with the Highest Percentage of Population Employed in Arts, Media & Entertainment in Alaska are:
What zip code has the Highest Percentage of Population Employed in Arts, Media & Entertainment in Alaska?
99635 has the Highest Percentage of Population Employed in Arts, Media & Entertainment in Alaska with 28.7%.
What is the Percentage of Population Employed in Arts, Media & Entertainment in the State of Alaska?
Percentage of Population Employed in Arts, Media & Entertainment in Alaska is 1.7%.
What is the Percentage of Population Employed in Arts, Media & Entertainment in the United States?
Percentage of Population Employed in Arts, Media & Entertainment in the United States is 2.1%.