Zip Codes with the Highest Percentage of Population Employed in Arts, Media & Entertainment in Ohio
RELATED REPORTS & OPTIONS
Arts, Media & Entertainment
Ohio
Compare Zip Codes
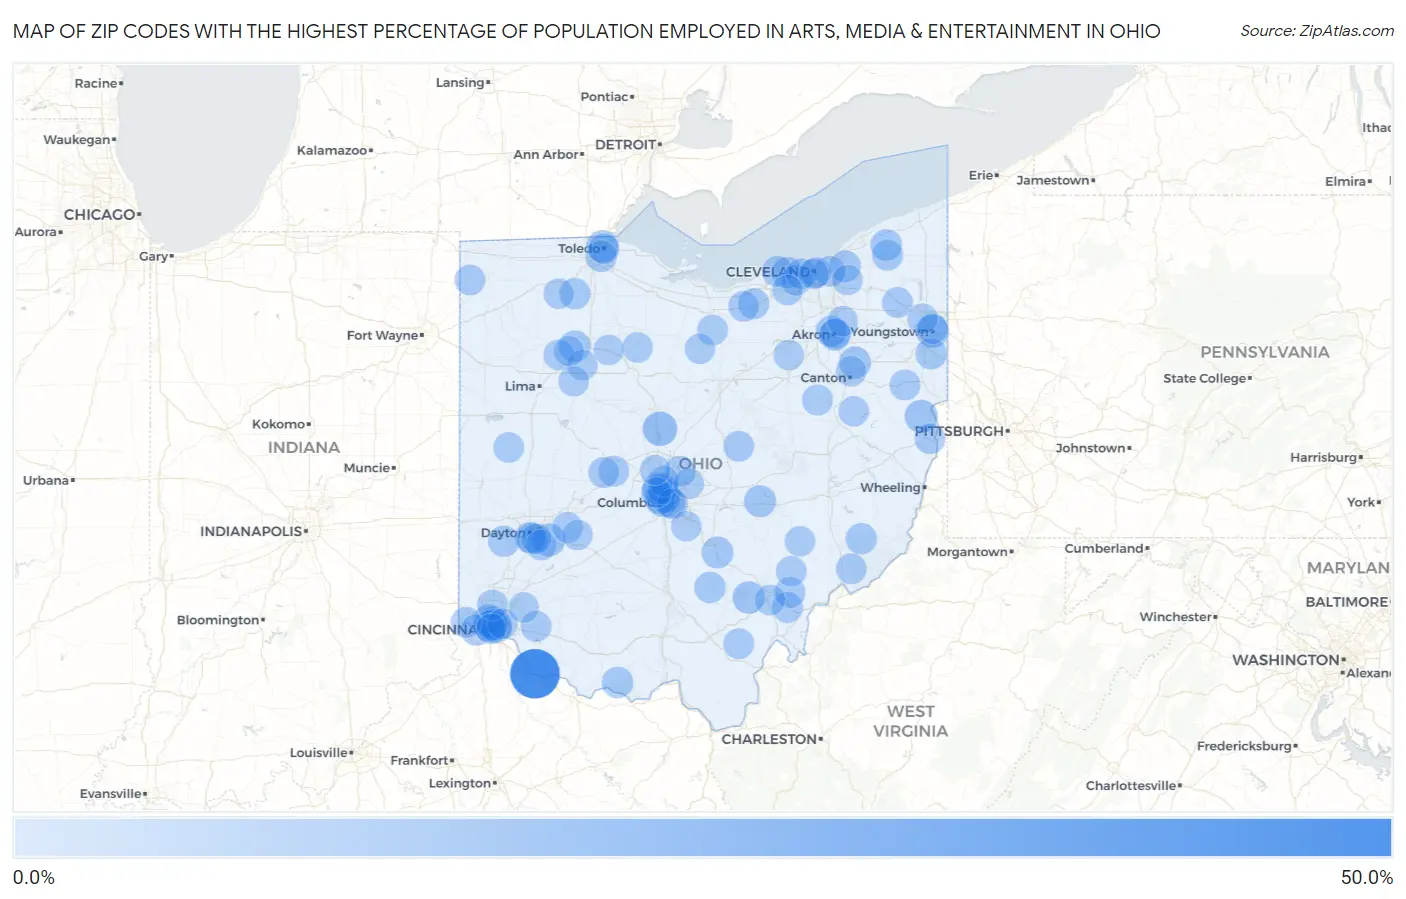
Map of Zip Codes with the Highest Percentage of Population Employed in Arts, Media & Entertainment in Ohio
0.0%
50.0%
Zip Codes with the Highest Percentage of Population Employed in Arts, Media & Entertainment in Ohio
| Zip Code | % Employed | vs State | vs National | |
| 1. | 45112 | 50.0% | 1.6%(+48.4)#1 | 2.1%(+47.9)#14 |
| 2. | 43356 | 12.4% | 1.6%(+10.9)#2 | 2.1%(+10.4)#236 |
| 3. | 45301 | 9.2% | 1.6%(+7.67)#3 | 2.1%(+7.16)#435 |
| 4. | 43932 | 8.9% | 1.6%(+7.34)#4 | 2.1%(+6.83)#459 |
| 5. | 44555 | 8.2% | 1.6%(+6.70)#5 | 2.1%(+6.19)#526 |
| 6. | 45766 | 7.3% | 1.6%(+5.76)#6 | 2.1%(+5.25)#687 |
| 7. | 43620 | 6.8% | 1.6%(+5.23)#7 | 2.1%(+4.72)#811 |
| 8. | 43746 | 6.7% | 1.6%(+5.18)#8 | 2.1%(+4.67)#824 |
| 9. | 44652 | 6.5% | 1.6%(+4.90)#9 | 2.1%(+4.39)#885 |
| 10. | 43155 | 6.1% | 1.6%(+4.55)#10 | 2.1%(+4.04)#1,000 |
| 11. | 44040 | 6.0% | 1.6%(+4.45)#11 | 2.1%(+3.94)#1,032 |
| 12. | 45816 | 5.8% | 1.6%(+4.26)#12 | 2.1%(+3.75)#1,109 |
| 13. | 45206 | 5.4% | 1.6%(+3.88)#13 | 2.1%(+3.37)#1,293 |
| 14. | 45220 | 5.4% | 1.6%(+3.81)#14 | 2.1%(+3.30)#1,318 |
| 15. | 44086 | 5.3% | 1.6%(+3.80)#15 | 2.1%(+3.29)#1,327 |
| 16. | 44325 | 5.3% | 1.6%(+3.78)#16 | 2.1%(+3.27)#1,332 |
| 17. | 43460 | 5.1% | 1.6%(+3.56)#17 | 2.1%(+3.05)#1,439 |
| 18. | 45650 | 5.1% | 1.6%(+3.55)#18 | 2.1%(+3.04)#1,447 |
| 19. | 43215 | 5.0% | 1.6%(+3.47)#19 | 2.1%(+2.96)#1,493 |
| 20. | 43152 | 5.0% | 1.6%(+3.45)#20 | 2.1%(+2.94)#1,500 |
| 21. | 44452 | 5.0% | 1.6%(+3.41)#21 | 2.1%(+2.90)#1,519 |
| 22. | 45325 | 5.0% | 1.6%(+3.41)#22 | 2.1%(+2.90)#1,525 |
| 23. | 45223 | 4.9% | 1.6%(+3.39)#23 | 2.1%(+2.88)#1,535 |
| 24. | 44140 | 4.9% | 1.6%(+3.37)#24 | 2.1%(+2.86)#1,549 |
| 25. | 43786 | 4.8% | 1.6%(+3.21)#25 | 2.1%(+2.70)#1,651 |
| 26. | 45051 | 4.7% | 1.6%(+3.14)#26 | 2.1%(+2.63)#1,699 |
| 27. | 44303 | 4.7% | 1.6%(+3.13)#27 | 2.1%(+2.62)#1,705 |
| 28. | 45214 | 4.6% | 1.6%(+3.10)#28 | 2.1%(+2.59)#1,736 |
| 29. | 43569 | 4.6% | 1.6%(+3.03)#29 | 2.1%(+2.52)#1,790 |
| 30. | 45419 | 4.4% | 1.6%(+2.90)#30 | 2.1%(+2.39)#1,897 |
| 31. | 44064 | 4.4% | 1.6%(+2.87)#31 | 2.1%(+2.37)#1,921 |
| 32. | 44074 | 4.3% | 1.6%(+2.78)#32 | 2.1%(+2.27)#2,007 |
| 33. | 45202 | 4.3% | 1.6%(+2.74)#33 | 2.1%(+2.23)#2,045 |
| 34. | 45219 | 4.2% | 1.6%(+2.67)#34 | 2.1%(+2.16)#2,134 |
| 35. | 45409 | 4.2% | 1.6%(+2.63)#35 | 2.1%(+2.13)#2,156 |
| 36. | 43202 | 4.2% | 1.6%(+2.62)#36 | 2.1%(+2.11)#2,162 |
| 37. | 43045 | 4.1% | 1.6%(+2.56)#37 | 2.1%(+2.05)#2,244 |
| 38. | 43201 | 4.1% | 1.6%(+2.55)#38 | 2.1%(+2.04)#2,249 |
| 39. | 44423 | 4.1% | 1.6%(+2.51)#39 | 2.1%(+2.00)#2,288 |
| 40. | 44689 | 4.1% | 1.6%(+2.50)#40 | 2.1%(+1.99)#2,302 |
| 41. | 43212 | 4.0% | 1.6%(+2.48)#41 | 2.1%(+1.97)#2,330 |
| 42. | 43084 | 4.0% | 1.6%(+2.43)#42 | 2.1%(+1.92)#2,385 |
| 43. | 45735 | 4.0% | 1.6%(+2.43)#43 | 2.1%(+1.92)#2,387 |
| 44. | 45778 | 4.0% | 1.6%(+2.43)#44 | 2.1%(+1.92)#2,391 |
| 45. | 43205 | 3.9% | 1.6%(+2.33)#45 | 2.1%(+1.82)#2,517 |
| 46. | 45052 | 3.9% | 1.6%(+2.33)#46 | 2.1%(+1.82)#2,523 |
| 47. | 43220 | 3.8% | 1.6%(+2.27)#47 | 2.1%(+1.76)#2,595 |
| 48. | 44118 | 3.8% | 1.6%(+2.23)#48 | 2.1%(+1.72)#2,654 |
| 49. | 44012 | 3.8% | 1.6%(+2.20)#49 | 2.1%(+1.69)#2,690 |
| 50. | 43022 | 3.7% | 1.6%(+2.17)#50 | 2.1%(+1.66)#2,734 |
| 51. | 44126 | 3.7% | 1.6%(+2.17)#51 | 2.1%(+1.66)#2,740 |
| 52. | 43214 | 3.7% | 1.6%(+2.16)#52 | 2.1%(+1.65)#2,757 |
| 53. | 45218 | 3.7% | 1.6%(+2.14)#53 | 2.1%(+1.63)#2,780 |
| 54. | 44855 | 3.7% | 1.6%(+2.10)#54 | 2.1%(+1.59)#2,832 |
| 55. | 44504 | 3.6% | 1.6%(+2.08)#55 | 2.1%(+1.57)#2,867 |
| 56. | 45387 | 3.6% | 1.6%(+2.07)#56 | 2.1%(+1.56)#2,872 |
| 57. | 45686 | 3.6% | 1.6%(+2.07)#57 | 2.1%(+1.56)#2,877 |
| 58. | 44107 | 3.6% | 1.6%(+2.01)#58 | 2.1%(+1.50)#2,969 |
| 59. | 43082 | 3.6% | 1.6%(+2.01)#59 | 2.1%(+1.50)#2,974 |
| 60. | 43517 | 3.5% | 1.6%(+1.97)#60 | 2.1%(+1.46)#3,038 |
| 61. | 45788 | 3.5% | 1.6%(+1.95)#61 | 2.1%(+1.44)#3,073 |
| 62. | 45160 | 3.5% | 1.6%(+1.94)#62 | 2.1%(+1.43)#3,086 |
| 63. | 44049 | 3.5% | 1.6%(+1.94)#63 | 2.1%(+1.43)#3,087 |
| 64. | 44115 | 3.5% | 1.6%(+1.92)#64 | 2.1%(+1.41)#3,112 |
| 65. | 43952 | 3.4% | 1.6%(+1.88)#65 | 2.1%(+1.37)#3,172 |
| 66. | 44470 | 3.4% | 1.6%(+1.86)#66 | 2.1%(+1.35)#3,212 |
| 67. | 44304 | 3.4% | 1.6%(+1.86)#67 | 2.1%(+1.35)#3,233 |
| 68. | 43085 | 3.4% | 1.6%(+1.84)#68 | 2.1%(+1.33)#3,263 |
| 69. | 44113 | 3.4% | 1.6%(+1.82)#69 | 2.1%(+1.31)#3,294 |
| 70. | 43604 | 3.4% | 1.6%(+1.81)#70 | 2.1%(+1.30)#3,324 |
| 71. | 44138 | 3.3% | 1.6%(+1.76)#71 | 2.1%(+1.25)#3,405 |
| 72. | 44217 | 3.3% | 1.6%(+1.70)#72 | 2.1%(+1.20)#3,499 |
| 73. | 45877 | 3.2% | 1.6%(+1.70)#73 | 2.1%(+1.19)#3,515 |
| 74. | 45701 | 3.2% | 1.6%(+1.69)#74 | 2.1%(+1.18)#3,532 |
| 75. | 44446 | 3.2% | 1.6%(+1.67)#75 | 2.1%(+1.17)#3,552 |
| 76. | 43209 | 3.2% | 1.6%(+1.67)#76 | 2.1%(+1.16)#3,560 |
| 77. | 45845 | 3.2% | 1.6%(+1.63)#77 | 2.1%(+1.13)#3,646 |
| 78. | 44224 | 3.2% | 1.6%(+1.63)#78 | 2.1%(+1.12)#3,662 |
| 79. | 45440 | 3.2% | 1.6%(+1.60)#79 | 2.1%(+1.09)#3,729 |
| 80. | 45420 | 3.1% | 1.6%(+1.60)#80 | 2.1%(+1.09)#3,739 |
| 81. | 44714 | 3.1% | 1.6%(+1.59)#81 | 2.1%(+1.08)#3,758 |
| 82. | 43728 | 3.1% | 1.6%(+1.56)#82 | 2.1%(+1.05)#3,823 |
| 83. | 45208 | 3.1% | 1.6%(+1.54)#83 | 2.1%(+1.03)#3,880 |
| 84. | 45314 | 3.1% | 1.6%(+1.53)#84 | 2.1%(+1.02)#3,885 |
| 85. | 44844 | 3.1% | 1.6%(+1.53)#85 | 2.1%(+1.02)#3,900 |
| 86. | 43054 | 3.0% | 1.6%(+1.48)#86 | 2.1%(+0.970)#4,009 |
| 87. | 44022 | 3.0% | 1.6%(+1.45)#87 | 2.1%(+0.944)#4,062 |
| 88. | 44865 | 3.0% | 1.6%(+1.45)#88 | 2.1%(+0.942)#4,071 |
| 89. | 44656 | 3.0% | 1.6%(+1.44)#89 | 2.1%(+0.928)#4,113 |
| 90. | 43534 | 3.0% | 1.6%(+1.42)#90 | 2.1%(+0.907)#4,163 |
| 91. | 43221 | 3.0% | 1.6%(+1.41)#91 | 2.1%(+0.904)#4,169 |
| 92. | 45841 | 2.9% | 1.6%(+1.37)#92 | 2.1%(+0.863)#4,275 |
| 93. | 45868 | 2.9% | 1.6%(+1.37)#93 | 2.1%(+0.860)#4,282 |
| 94. | 45810 | 2.9% | 1.6%(+1.37)#94 | 2.1%(+0.857)#4,295 |
| 95. | 45203 | 2.9% | 1.6%(+1.36)#95 | 2.1%(+0.853)#4,310 |
| 96. | 43756 | 2.9% | 1.6%(+1.36)#96 | 2.1%(+0.852)#4,312 |
| 97. | 45140 | 2.8% | 1.6%(+1.29)#97 | 2.1%(+0.776)#4,514 |
| 98. | 45890 | 2.8% | 1.6%(+1.28)#98 | 2.1%(+0.771)#4,525 |
| 99. | 43136 | 2.8% | 1.6%(+1.28)#99 | 2.1%(+0.766)#4,541 |
| 100. | 43065 | 2.8% | 1.6%(+1.27)#100 | 2.1%(+0.757)#4,567 |
Common Questions
What are the Top 10 Zip Codes with the Highest Percentage of Population Employed in Arts, Media & Entertainment in Ohio?
Top 10 Zip Codes with the Highest Percentage of Population Employed in Arts, Media & Entertainment in Ohio are:
What zip code has the Highest Percentage of Population Employed in Arts, Media & Entertainment in Ohio?
45112 has the Highest Percentage of Population Employed in Arts, Media & Entertainment in Ohio with 50.0%.
What is the Percentage of Population Employed in Arts, Media & Entertainment in the State of Ohio?
Percentage of Population Employed in Arts, Media & Entertainment in Ohio is 1.6%.
What is the Percentage of Population Employed in Arts, Media & Entertainment in the United States?
Percentage of Population Employed in Arts, Media & Entertainment in the United States is 2.1%.