Zip Codes with the Highest Percentage of Population Employed in Arts, Media & Entertainment in New Hampshire
RELATED REPORTS & OPTIONS
Arts, Media & Entertainment
New Hampshire
Compare Zip Codes
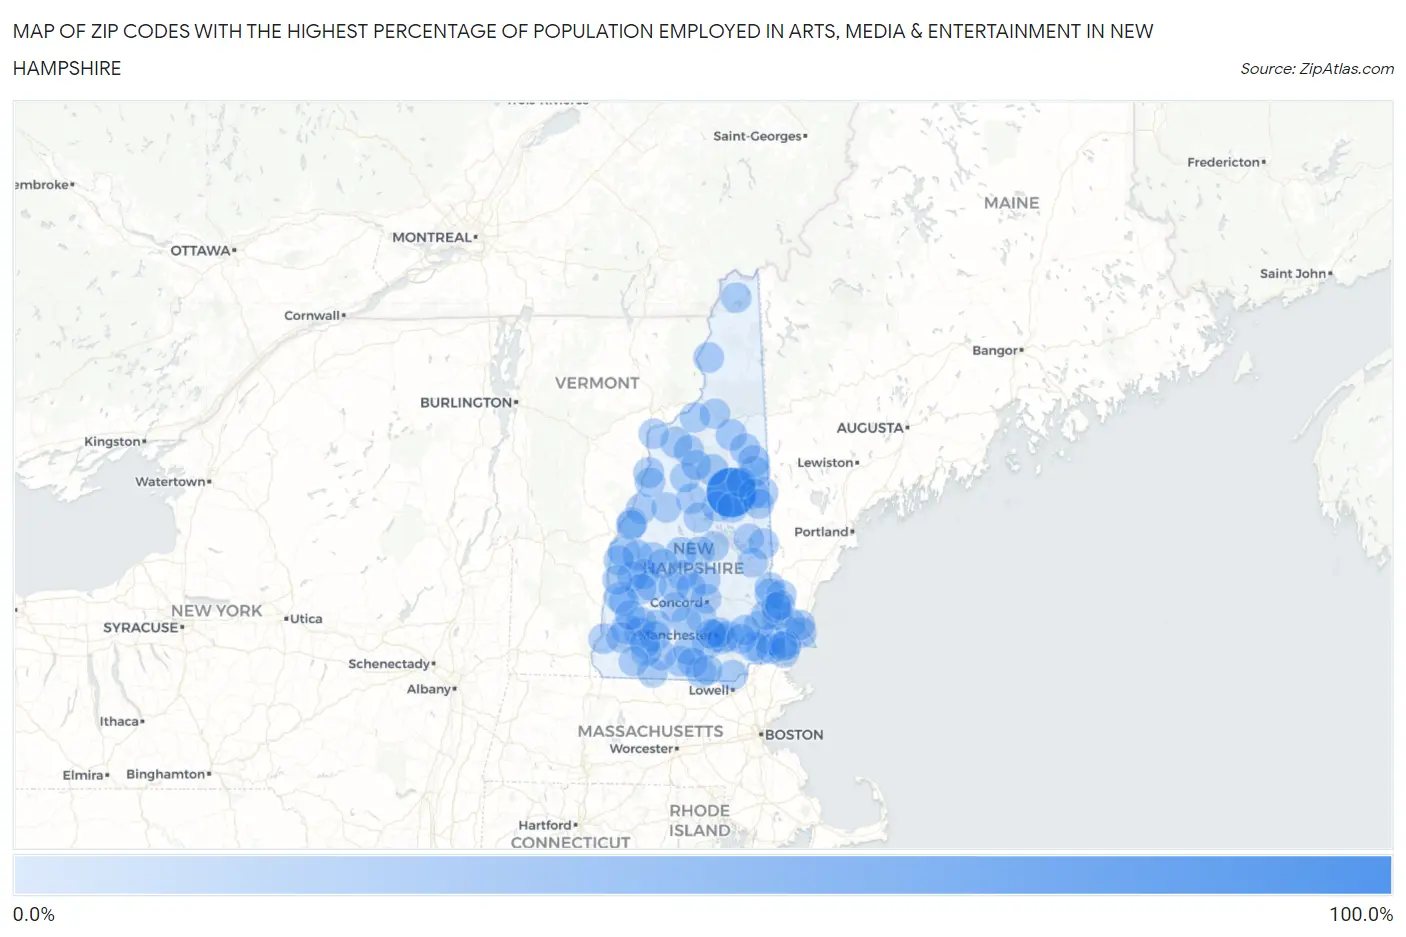
Map of Zip Codes with the Highest Percentage of Population Employed in Arts, Media & Entertainment in New Hampshire
0.0%
100.0%
Zip Codes with the Highest Percentage of Population Employed in Arts, Media & Entertainment in New Hampshire
| Zip Code | % Employed | vs State | vs National | |
| 1. | 03897 | 100.0% | 1.8%(+98.2)#1 | 2.1%(+97.9)#2 |
| 2. | 03845 | 10.0% | 1.8%(+8.22)#2 | 2.1%(+7.92)#379 |
| 3. | 03215 | 9.1% | 1.8%(+7.32)#3 | 2.1%(+7.03)#445 |
| 4. | 03586 | 8.4% | 1.8%(+6.59)#4 | 2.1%(+6.30)#506 |
| 5. | 03770 | 8.3% | 1.8%(+6.51)#5 | 2.1%(+6.22)#522 |
| 6. | 03832 | 7.9% | 1.8%(+6.18)#6 | 2.1%(+5.89)#560 |
| 7. | 03243 | 7.1% | 1.8%(+5.28)#7 | 2.1%(+4.99)#750 |
| 8. | 03593 | 7.0% | 1.8%(+5.19)#8 | 2.1%(+4.90)#771 |
| 9. | 03860 | 5.5% | 1.8%(+3.77)#9 | 2.1%(+3.48)#1,229 |
| 10. | 03101 | 4.6% | 1.8%(+2.83)#10 | 2.1%(+2.54)#1,780 |
| 11. | 03284 | 4.5% | 1.8%(+2.74)#11 | 2.1%(+2.44)#1,850 |
| 12. | 03224 | 4.4% | 1.8%(+2.61)#12 | 2.1%(+2.32)#1,957 |
| 13. | 03801 | 4.4% | 1.8%(+2.60)#13 | 2.1%(+2.30)#1,970 |
| 14. | 03765 | 4.1% | 1.8%(+2.38)#14 | 2.1%(+2.09)#2,188 |
| 15. | 03457 | 4.1% | 1.8%(+2.35)#15 | 2.1%(+2.05)#2,243 |
| 16. | 03255 | 4.1% | 1.8%(+2.29)#16 | 2.1%(+2.00)#2,293 |
| 17. | 03848 | 4.1% | 1.8%(+2.29)#17 | 2.1%(+2.00)#2,296 |
| 18. | 03846 | 4.0% | 1.8%(+2.22)#18 | 2.1%(+1.92)#2,379 |
| 19. | 03227 | 3.9% | 1.8%(+2.17)#19 | 2.1%(+1.88)#2,443 |
| 20. | 03833 | 3.9% | 1.8%(+2.14)#20 | 2.1%(+1.84)#2,493 |
| 21. | 03870 | 3.9% | 1.8%(+2.14)#21 | 2.1%(+1.84)#2,494 |
| 22. | 03753 | 3.7% | 1.8%(+1.92)#22 | 2.1%(+1.63)#2,783 |
| 23. | 03874 | 3.7% | 1.8%(+1.89)#23 | 2.1%(+1.60)#2,822 |
| 24. | 03467 | 3.6% | 1.8%(+1.85)#24 | 2.1%(+1.56)#2,885 |
| 25. | 03448 | 3.6% | 1.8%(+1.84)#25 | 2.1%(+1.55)#2,898 |
| 26. | 03601 | 3.6% | 1.8%(+1.83)#26 | 2.1%(+1.53)#2,919 |
| 27. | 03464 | 3.6% | 1.8%(+1.78)#27 | 2.1%(+1.49)#2,991 |
| 28. | 03223 | 3.5% | 1.8%(+1.76)#28 | 2.1%(+1.46)#3,035 |
| 29. | 03049 | 3.5% | 1.8%(+1.72)#29 | 2.1%(+1.43)#3,090 |
| 30. | 03086 | 3.5% | 1.8%(+1.68)#30 | 2.1%(+1.39)#3,127 |
| 31. | 03268 | 3.3% | 1.8%(+1.55)#31 | 2.1%(+1.26)#3,393 |
| 32. | 03782 | 3.3% | 1.8%(+1.54)#32 | 2.1%(+1.25)#3,403 |
| 33. | 03449 | 3.3% | 1.8%(+1.54)#33 | 2.1%(+1.24)#3,415 |
| 34. | 03431 | 3.3% | 1.8%(+1.49)#34 | 2.1%(+1.19)#3,504 |
| 35. | 03773 | 3.2% | 1.8%(+1.47)#35 | 2.1%(+1.17)#3,542 |
| 36. | 03590 | 3.2% | 1.8%(+1.42)#36 | 2.1%(+1.13)#3,630 |
| 37. | 03883 | 3.2% | 1.8%(+1.41)#37 | 2.1%(+1.11)#3,680 |
| 38. | 03458 | 3.1% | 1.8%(+1.38)#38 | 2.1%(+1.09)#3,735 |
| 39. | 03839 | 3.1% | 1.8%(+1.37)#39 | 2.1%(+1.08)#3,757 |
| 40. | 03110 | 3.1% | 1.8%(+1.32)#40 | 2.1%(+1.03)#3,873 |
| 41. | 03849 | 3.0% | 1.8%(+1.27)#41 | 2.1%(+0.978)#3,995 |
| 42. | 03032 | 3.0% | 1.8%(+1.25)#42 | 2.1%(+0.961)#4,028 |
| 43. | 03752 | 3.0% | 1.8%(+1.23)#43 | 2.1%(+0.941)#4,072 |
| 44. | 03872 | 3.0% | 1.8%(+1.23)#44 | 2.1%(+0.933)#4,098 |
| 45. | 03057 | 3.0% | 1.8%(+1.22)#45 | 2.1%(+0.923)#4,130 |
| 46. | 03824 | 3.0% | 1.8%(+1.21)#46 | 2.1%(+0.919)#4,136 |
| 47. | 03836 | 2.9% | 1.8%(+1.13)#47 | 2.1%(+0.832)#4,366 |
| 48. | 03042 | 2.8% | 1.8%(+1.04)#48 | 2.1%(+0.746)#4,601 |
| 49. | 03592 | 2.8% | 1.8%(+1.02)#49 | 2.1%(+0.729)#4,650 |
| 50. | 03046 | 2.7% | 1.8%(+0.955)#50 | 2.1%(+0.661)#4,848 |
| 51. | 03768 | 2.7% | 1.8%(+0.939)#51 | 2.1%(+0.645)#4,884 |
| 52. | 03771 | 2.7% | 1.8%(+0.928)#52 | 2.1%(+0.635)#4,929 |
| 53. | 03827 | 2.7% | 1.8%(+0.920)#53 | 2.1%(+0.627)#4,950 |
| 54. | 03281 | 2.7% | 1.8%(+0.903)#54 | 2.1%(+0.609)#4,997 |
| 55. | 03894 | 2.6% | 1.8%(+0.876)#55 | 2.1%(+0.583)#5,085 |
| 56. | 03242 | 2.6% | 1.8%(+0.846)#56 | 2.1%(+0.552)#5,183 |
| 57. | 03278 | 2.6% | 1.8%(+0.820)#57 | 2.1%(+0.526)#5,273 |
| 58. | 03246 | 2.6% | 1.8%(+0.817)#58 | 2.1%(+0.524)#5,281 |
| 59. | 03583 | 2.6% | 1.8%(+0.786)#59 | 2.1%(+0.492)#5,388 |
| 60. | 03842 | 2.5% | 1.8%(+0.724)#60 | 2.1%(+0.430)#5,577 |
| 61. | 03109 | 2.5% | 1.8%(+0.707)#61 | 2.1%(+0.414)#5,635 |
| 62. | 03245 | 2.5% | 1.8%(+0.699)#62 | 2.1%(+0.406)#5,665 |
| 63. | 03779 | 2.5% | 1.8%(+0.693)#63 | 2.1%(+0.400)#5,680 |
| 64. | 03104 | 2.5% | 1.8%(+0.689)#64 | 2.1%(+0.396)#5,701 |
| 65. | 03755 | 2.4% | 1.8%(+0.671)#65 | 2.1%(+0.377)#5,795 |
| 66. | 03854 | 2.4% | 1.8%(+0.639)#66 | 2.1%(+0.346)#5,920 |
| 67. | 03266 | 2.4% | 1.8%(+0.632)#67 | 2.1%(+0.338)#5,941 |
| 68. | 03861 | 2.4% | 1.8%(+0.587)#68 | 2.1%(+0.294)#6,112 |
| 69. | 03867 | 2.3% | 1.8%(+0.578)#69 | 2.1%(+0.285)#6,160 |
| 70. | 03580 | 2.3% | 1.8%(+0.562)#70 | 2.1%(+0.269)#6,248 |
| 71. | 03878 | 2.3% | 1.8%(+0.560)#71 | 2.1%(+0.267)#6,257 |
| 72. | 03598 | 2.3% | 1.8%(+0.554)#72 | 2.1%(+0.261)#6,288 |
| 73. | 03287 | 2.3% | 1.8%(+0.525)#73 | 2.1%(+0.232)#6,404 |
| 74. | 03301 | 2.3% | 1.8%(+0.509)#74 | 2.1%(+0.215)#6,474 |
| 75. | 03607 | 2.3% | 1.8%(+0.505)#75 | 2.1%(+0.212)#6,497 |
| 76. | 03461 | 2.3% | 1.8%(+0.493)#76 | 2.1%(+0.200)#6,547 |
| 77. | 03444 | 2.3% | 1.8%(+0.492)#77 | 2.1%(+0.198)#6,554 |
| 78. | 03819 | 2.2% | 1.8%(+0.406)#78 | 2.1%(+0.113)#6,940 |
| 79. | 03450 | 2.2% | 1.8%(+0.406)#79 | 2.1%(+0.113)#6,942 |
| 80. | 03076 | 2.1% | 1.8%(+0.368)#80 | 2.1%(+0.075)#7,102 |
| 81. | 03102 | 2.1% | 1.8%(+0.330)#81 | 2.1%(+0.036)#7,292 |
| 82. | 03262 | 2.1% | 1.8%(+0.299)#82 | 2.1%(+0.006)#7,455 |
| 83. | 03745 | 2.0% | 1.8%(+0.281)#83 | 2.1%(-0.012)#7,551 |
| 84. | 03440 | 2.0% | 1.8%(+0.278)#84 | 2.1%(-0.016)#7,571 |
| 85. | 03844 | 2.0% | 1.8%(+0.277)#85 | 2.1%(-0.017)#7,576 |
| 86. | 03055 | 2.0% | 1.8%(+0.220)#86 | 2.1%(-0.073)#7,872 |
| 87. | 03269 | 1.9% | 1.8%(+0.172)#87 | 2.1%(-0.122)#8,140 |
| 88. | 03063 | 1.9% | 1.8%(+0.170)#88 | 2.1%(-0.123)#8,145 |
| 89. | 03818 | 1.9% | 1.8%(+0.163)#89 | 2.1%(-0.131)#8,196 |
| 90. | 03456 | 1.9% | 1.8%(+0.150)#90 | 2.1%(-0.143)#8,272 |
| 91. | 03855 | 1.9% | 1.8%(+0.140)#91 | 2.1%(-0.153)#8,317 |
| 92. | 03251 | 1.9% | 1.8%(+0.132)#92 | 2.1%(-0.161)#8,379 |
| 93. | 03750 | 1.9% | 1.8%(+0.131)#93 | 2.1%(-0.162)#8,387 |
| 94. | 03077 | 1.9% | 1.8%(+0.087)#94 | 2.1%(-0.207)#8,650 |
| 95. | 03465 | 1.8% | 1.8%(+0.073)#95 | 2.1%(-0.220)#8,725 |
| 96. | 03743 | 1.8% | 1.8%(+0.065)#96 | 2.1%(-0.228)#8,780 |
| 97. | 03823 | 1.8% | 1.8%(+0.059)#97 | 2.1%(-0.234)#8,814 |
| 98. | 03820 | 1.8% | 1.8%(+0.051)#98 | 2.1%(-0.242)#8,868 |
| 99. | 03036 | 1.8% | 1.8%(+0.049)#99 | 2.1%(-0.244)#8,890 |
| 100. | 03303 | 1.8% | 1.8%(+0.033)#100 | 2.1%(-0.260)#8,976 |
Common Questions
What are the Top 10 Zip Codes with the Highest Percentage of Population Employed in Arts, Media & Entertainment in New Hampshire?
Top 10 Zip Codes with the Highest Percentage of Population Employed in Arts, Media & Entertainment in New Hampshire are:
What zip code has the Highest Percentage of Population Employed in Arts, Media & Entertainment in New Hampshire?
03897 has the Highest Percentage of Population Employed in Arts, Media & Entertainment in New Hampshire with 100.0%.
What is the Percentage of Population Employed in Arts, Media & Entertainment in the State of New Hampshire?
Percentage of Population Employed in Arts, Media & Entertainment in New Hampshire is 1.8%.
What is the Percentage of Population Employed in Arts, Media & Entertainment in the United States?
Percentage of Population Employed in Arts, Media & Entertainment in the United States is 2.1%.