Zip Codes with the Highest Percentage of Population Employed in Arts, Media & Entertainment in Oregon
RELATED REPORTS & OPTIONS
Arts, Media & Entertainment
Oregon
Compare Zip Codes
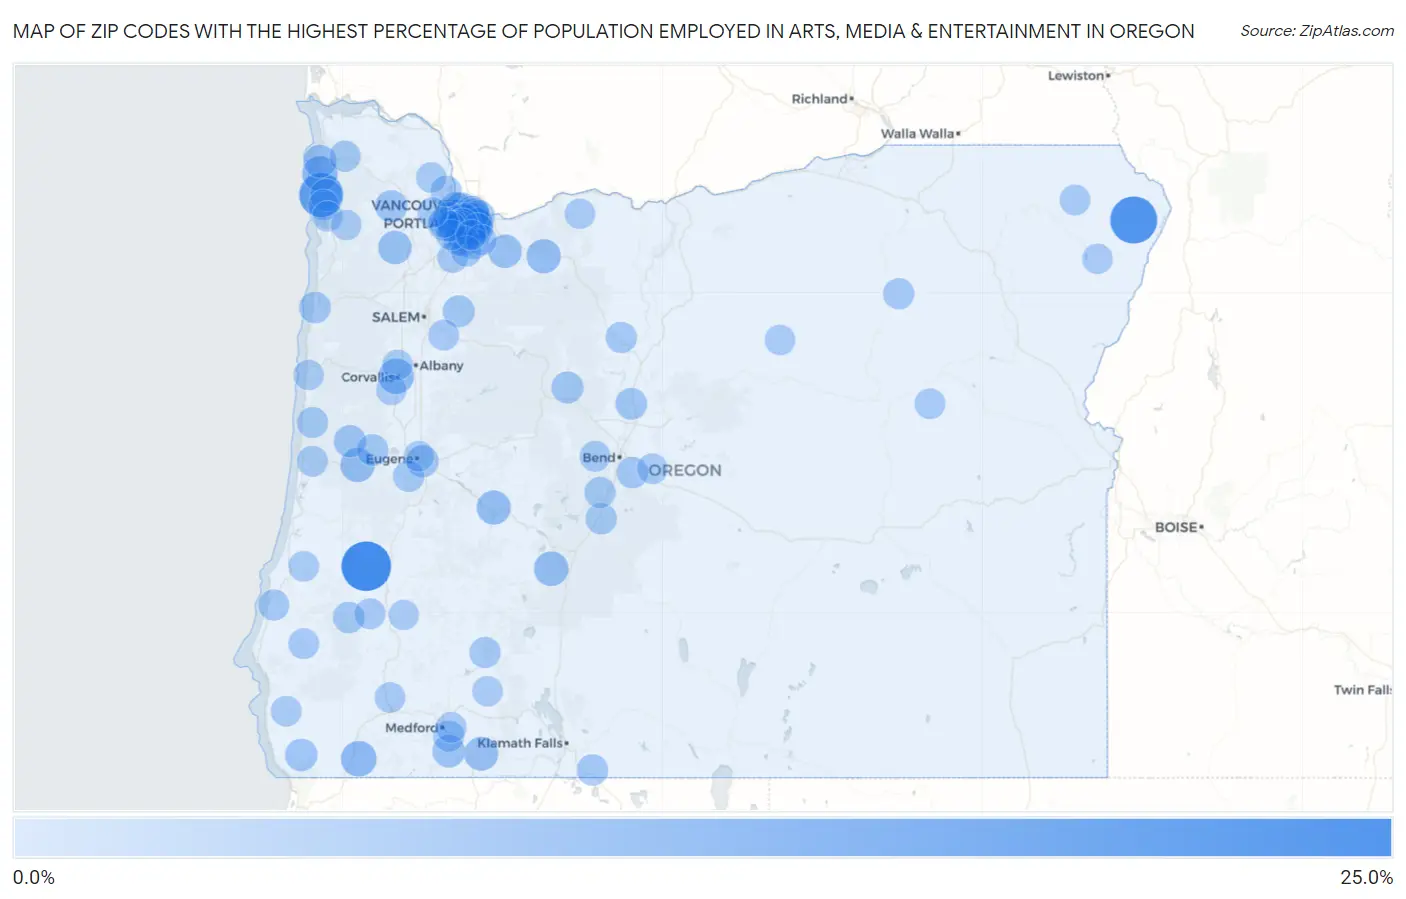
Map of Zip Codes with the Highest Percentage of Population Employed in Arts, Media & Entertainment in Oregon
0.0%
25.0%
Zip Codes with the Highest Percentage of Population Employed in Arts, Media & Entertainment in Oregon
| Zip Code | % Employed | vs State | vs National | |
| 1. | 97486 | 24.4% | 2.5%(+21.9)#1 | 2.1%(+22.3)#64 |
| 2. | 97842 | 21.4% | 2.5%(+18.9)#2 | 2.1%(+19.4)#79 |
| 3. | 97130 | 17.9% | 2.5%(+15.4)#3 | 2.1%(+15.8)#119 |
| 4. | 97215 | 8.7% | 2.5%(+6.21)#4 | 2.1%(+6.66)#472 |
| 5. | 97523 | 8.3% | 2.5%(+5.78)#5 | 2.1%(+6.23)#518 |
| 6. | 97210 | 8.3% | 2.5%(+5.78)#6 | 2.1%(+6.23)#519 |
| 7. | 97331 | 8.1% | 2.5%(+5.60)#7 | 2.1%(+6.05)#536 |
| 8. | 97102 | 8.1% | 2.5%(+5.58)#8 | 2.1%(+6.03)#540 |
| 9. | 97214 | 8.0% | 2.5%(+5.54)#9 | 2.1%(+5.99)#546 |
| 10. | 97217 | 7.5% | 2.5%(+4.96)#10 | 2.1%(+5.41)#650 |
| 11. | 97213 | 7.2% | 2.5%(+4.68)#11 | 2.1%(+5.13)#712 |
| 12. | 97733 | 7.0% | 2.5%(+4.53)#12 | 2.1%(+4.98)#757 |
| 13. | 97490 | 6.8% | 2.5%(+4.33)#13 | 2.1%(+4.78)#796 |
| 14. | 97067 | 6.7% | 2.5%(+4.21)#14 | 2.1%(+4.66)#827 |
| 15. | 97463 | 6.7% | 2.5%(+4.21)#15 | 2.1%(+4.66)#828 |
| 16. | 97232 | 6.5% | 2.5%(+3.98)#16 | 2.1%(+4.43)#879 |
| 17. | 97520 | 6.4% | 2.5%(+3.90)#17 | 2.1%(+4.35)#896 |
| 18. | 97202 | 6.1% | 2.5%(+3.59)#18 | 2.1%(+4.04)#1,003 |
| 19. | 97148 | 6.0% | 2.5%(+3.45)#19 | 2.1%(+3.90)#1,051 |
| 20. | 97211 | 5.9% | 2.5%(+3.37)#20 | 2.1%(+3.82)#1,088 |
| 21. | 97022 | 5.9% | 2.5%(+3.34)#21 | 2.1%(+3.79)#1,094 |
| 22. | 97219 | 5.7% | 2.5%(+3.15)#22 | 2.1%(+3.60)#1,173 |
| 23. | 97203 | 5.5% | 2.5%(+3.01)#23 | 2.1%(+3.46)#1,236 |
| 24. | 97110 | 5.3% | 2.5%(+2.81)#24 | 2.1%(+3.26)#1,336 |
| 25. | 97212 | 5.2% | 2.5%(+2.66)#25 | 2.1%(+3.11)#1,415 |
| 26. | 97206 | 5.1% | 2.5%(+2.55)#26 | 2.1%(+3.00)#1,469 |
| 27. | 97540 | 5.0% | 2.5%(+2.49)#27 | 2.1%(+2.94)#1,498 |
| 28. | 97415 | 4.7% | 2.5%(+2.20)#28 | 2.1%(+2.65)#1,683 |
| 29. | 97403 | 4.6% | 2.5%(+2.10)#29 | 2.1%(+2.55)#1,769 |
| 30. | 97430 | 4.6% | 2.5%(+2.06)#30 | 2.1%(+2.51)#1,796 |
| 31. | 97117 | 4.5% | 2.5%(+1.98)#31 | 2.1%(+2.43)#1,863 |
| 32. | 97147 | 4.5% | 2.5%(+1.95)#32 | 2.1%(+2.40)#1,890 |
| 33. | 97239 | 4.4% | 2.5%(+1.89)#33 | 2.1%(+2.34)#1,939 |
| 34. | 97759 | 4.3% | 2.5%(+1.81)#34 | 2.1%(+2.26)#2,012 |
| 35. | 97220 | 4.3% | 2.5%(+1.78)#35 | 2.1%(+2.23)#2,049 |
| 36. | 97227 | 4.3% | 2.5%(+1.76)#36 | 2.1%(+2.21)#2,073 |
| 37. | 97216 | 4.2% | 2.5%(+1.67)#37 | 2.1%(+2.12)#2,158 |
| 38. | 97381 | 4.2% | 2.5%(+1.65)#38 | 2.1%(+2.10)#2,180 |
| 39. | 97201 | 4.0% | 2.5%(+1.51)#39 | 2.1%(+1.96)#2,350 |
| 40. | 97760 | 4.0% | 2.5%(+1.50)#40 | 2.1%(+1.95)#2,354 |
| 41. | 97209 | 4.0% | 2.5%(+1.46)#41 | 2.1%(+1.91)#2,395 |
| 42. | 97364 | 3.9% | 2.5%(+1.44)#42 | 2.1%(+1.89)#2,437 |
| 43. | 97461 | 3.9% | 2.5%(+1.39)#43 | 2.1%(+1.84)#2,495 |
| 44. | 97702 | 3.7% | 2.5%(+1.23)#44 | 2.1%(+1.68)#2,713 |
| 45. | 97416 | 3.7% | 2.5%(+1.16)#45 | 2.1%(+1.61)#2,803 |
| 46. | 97633 | 3.6% | 2.5%(+1.06)#46 | 2.1%(+1.51)#2,955 |
| 47. | 97739 | 3.5% | 2.5%(+0.940)#47 | 2.1%(+1.39)#3,131 |
| 48. | 97003 | 3.4% | 2.5%(+0.934)#48 | 2.1%(+1.38)#3,145 |
| 49. | 97405 | 3.4% | 2.5%(+0.920)#49 | 2.1%(+1.37)#3,166 |
| 50. | 97218 | 3.4% | 2.5%(+0.912)#50 | 2.1%(+1.36)#3,186 |
| 51. | 97221 | 3.4% | 2.5%(+0.910)#51 | 2.1%(+1.36)#3,193 |
| 52. | 97229 | 3.4% | 2.5%(+0.906)#52 | 2.1%(+1.36)#3,202 |
| 53. | 97761 | 3.4% | 2.5%(+0.896)#53 | 2.1%(+1.35)#3,231 |
| 54. | 97707 | 3.4% | 2.5%(+0.877)#54 | 2.1%(+1.33)#3,260 |
| 55. | 97266 | 3.4% | 2.5%(+0.867)#55 | 2.1%(+1.32)#3,279 |
| 56. | 97225 | 3.4% | 2.5%(+0.865)#56 | 2.1%(+1.31)#3,283 |
| 57. | 97535 | 3.3% | 2.5%(+0.792)#57 | 2.1%(+1.24)#3,418 |
| 58. | 97138 | 3.3% | 2.5%(+0.777)#58 | 2.1%(+1.23)#3,444 |
| 59. | 97880 | 3.3% | 2.5%(+0.768)#59 | 2.1%(+1.22)#3,466 |
| 60. | 97027 | 3.3% | 2.5%(+0.767)#60 | 2.1%(+1.22)#3,467 |
| 61. | 97536 | 3.3% | 2.5%(+0.739)#61 | 2.1%(+1.19)#3,512 |
| 62. | 97498 | 3.2% | 2.5%(+0.706)#62 | 2.1%(+1.16)#3,576 |
| 63. | 97411 | 3.2% | 2.5%(+0.668)#63 | 2.1%(+1.12)#3,660 |
| 64. | 97231 | 3.2% | 2.5%(+0.660)#64 | 2.1%(+1.11)#3,688 |
| 65. | 97205 | 3.1% | 2.5%(+0.619)#65 | 2.1%(+1.07)#3,775 |
| 66. | 97136 | 3.1% | 2.5%(+0.578)#66 | 2.1%(+1.03)#3,876 |
| 67. | 97325 | 3.1% | 2.5%(+0.574)#67 | 2.1%(+1.02)#3,883 |
| 68. | 97496 | 3.0% | 2.5%(+0.526)#68 | 2.1%(+0.976)#4,001 |
| 69. | 97466 | 3.0% | 2.5%(+0.494)#69 | 2.1%(+0.945)#4,061 |
| 70. | 97035 | 3.0% | 2.5%(+0.485)#70 | 2.1%(+0.935)#4,087 |
| 71. | 97034 | 3.0% | 2.5%(+0.459)#71 | 2.1%(+0.909)#4,159 |
| 72. | 97439 | 3.0% | 2.5%(+0.454)#72 | 2.1%(+0.904)#4,170 |
| 73. | 97703 | 2.9% | 2.5%(+0.436)#73 | 2.1%(+0.886)#4,213 |
| 74. | 97005 | 2.9% | 2.5%(+0.361)#74 | 2.1%(+0.811)#4,422 |
| 75. | 97015 | 2.8% | 2.5%(+0.335)#75 | 2.1%(+0.785)#4,484 |
| 76. | 97828 | 2.8% | 2.5%(+0.313)#76 | 2.1%(+0.764)#4,546 |
| 77. | 97070 | 2.8% | 2.5%(+0.299)#77 | 2.1%(+0.749)#4,587 |
| 78. | 97504 | 2.8% | 2.5%(+0.259)#78 | 2.1%(+0.709)#4,700 |
| 79. | 97869 | 2.7% | 2.5%(+0.229)#79 | 2.1%(+0.679)#4,789 |
| 80. | 97701 | 2.7% | 2.5%(+0.227)#80 | 2.1%(+0.677)#4,798 |
| 81. | 97068 | 2.7% | 2.5%(+0.226)#81 | 2.1%(+0.676)#4,802 |
| 82. | 97526 | 2.7% | 2.5%(+0.226)#82 | 2.1%(+0.676)#4,805 |
| 83. | 97330 | 2.7% | 2.5%(+0.220)#83 | 2.1%(+0.671)#4,815 |
| 84. | 97444 | 2.7% | 2.5%(+0.192)#84 | 2.1%(+0.642)#4,895 |
| 85. | 97420 | 2.7% | 2.5%(+0.191)#85 | 2.1%(+0.641)#4,902 |
| 86. | 97846 | 2.6% | 2.5%(+0.107)#86 | 2.1%(+0.557)#5,173 |
| 87. | 97874 | 2.6% | 2.5%(+0.098)#87 | 2.1%(+0.548)#5,203 |
| 88. | 97401 | 2.6% | 2.5%(+0.094)#88 | 2.1%(+0.545)#5,211 |
| 89. | 97522 | 2.6% | 2.5%(+0.086)#89 | 2.1%(+0.536)#5,240 |
| 90. | 97107 | 2.6% | 2.5%(+0.055)#90 | 2.1%(+0.506)#5,349 |
| 91. | 97223 | 2.6% | 2.5%(+0.041)#91 | 2.1%(+0.491)#5,394 |
| 92. | 97366 | 2.5% | 2.5%(+0.022)#92 | 2.1%(+0.472)#5,448 |
| 93. | 97006 | 2.5% | 2.5%(+0.017)#93 | 2.1%(+0.468)#5,459 |
| 94. | 97457 | 2.5% | 2.5%(+0.006)#94 | 2.1%(+0.456)#5,496 |
| 95. | 97031 | 2.5% | 2.5%(-0.001)#95 | 2.1%(+0.449)#5,521 |
| 96. | 97141 | 2.5% | 2.5%(-0.013)#96 | 2.1%(+0.437)#5,561 |
| 97. | 97056 | 2.5% | 2.5%(-0.020)#97 | 2.1%(+0.430)#5,578 |
| 98. | 97222 | 2.5% | 2.5%(-0.029)#98 | 2.1%(+0.421)#5,615 |
| 99. | 97124 | 2.5% | 2.5%(-0.058)#99 | 2.1%(+0.392)#5,719 |
| 100. | 97333 | 2.4% | 2.5%(-0.062)#100 | 2.1%(+0.389)#5,743 |
Common Questions
What are the Top 10 Zip Codes with the Highest Percentage of Population Employed in Arts, Media & Entertainment in Oregon?
Top 10 Zip Codes with the Highest Percentage of Population Employed in Arts, Media & Entertainment in Oregon are:
What zip code has the Highest Percentage of Population Employed in Arts, Media & Entertainment in Oregon?
97486 has the Highest Percentage of Population Employed in Arts, Media & Entertainment in Oregon with 24.4%.
What is the Percentage of Population Employed in Arts, Media & Entertainment in the State of Oregon?
Percentage of Population Employed in Arts, Media & Entertainment in Oregon is 2.5%.
What is the Percentage of Population Employed in Arts, Media & Entertainment in the United States?
Percentage of Population Employed in Arts, Media & Entertainment in the United States is 2.1%.