Zip Codes with the Highest Percentage of Population Employed in Arts, Media & Entertainment in Massachusetts
RELATED REPORTS & OPTIONS
Arts, Media & Entertainment
Massachusetts
Compare Zip Codes
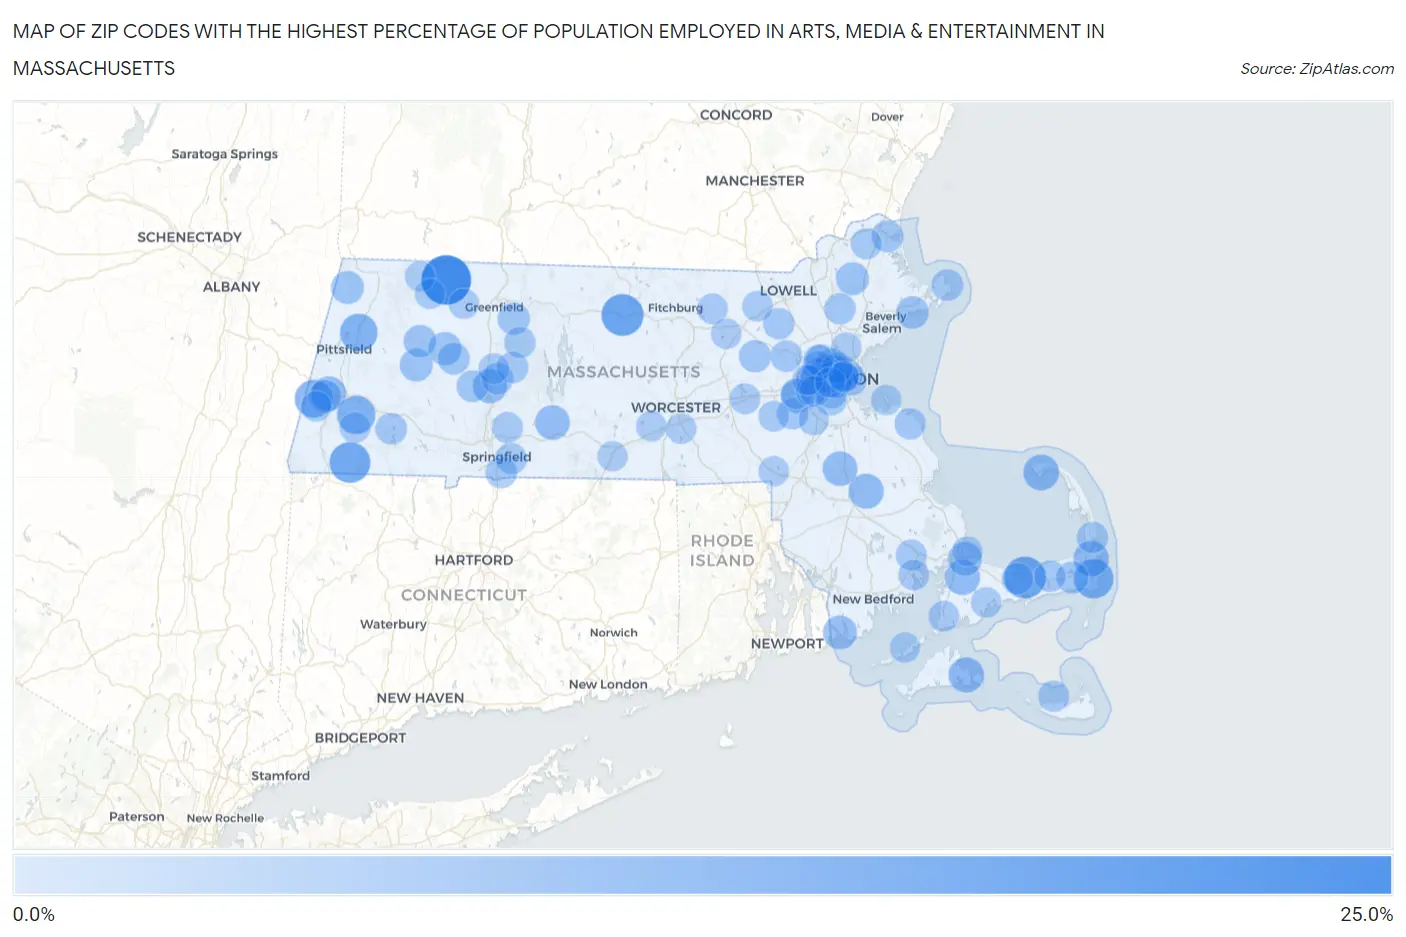
Map of Zip Codes with the Highest Percentage of Population Employed in Arts, Media & Entertainment in Massachusetts
0.0%
25.0%
Zip Codes with the Highest Percentage of Population Employed in Arts, Media & Entertainment in Massachusetts
| Zip Code | % Employed | vs State | vs National | |
| 1. | 01346 | 22.8% | 2.4%(+20.4)#1 | 2.1%(+20.7)#72 |
| 2. | 01438 | 15.1% | 2.4%(+12.7)#2 | 2.1%(+13.0)#166 |
| 3. | 02637 | 14.9% | 2.4%(+12.6)#3 | 2.1%(+12.9)#171 |
| 4. | 01259 | 14.0% | 2.4%(+11.7)#4 | 2.1%(+12.0)#190 |
| 5. | 02650 | 12.7% | 2.4%(+10.3)#5 | 2.1%(+10.6)#227 |
| 6. | 01264 | 11.4% | 2.4%(+9.04)#6 | 2.1%(+9.34)#289 |
| 7. | 01266 | 11.1% | 2.4%(+8.75)#7 | 2.1%(+9.05)#301 |
| 8. | 01224 | 10.8% | 2.4%(+8.42)#8 | 2.1%(+8.72)#321 |
| 9. | 02657 | 9.2% | 2.4%(+6.83)#9 | 2.1%(+7.13)#437 |
| 10. | 02653 | 8.8% | 2.4%(+6.42)#10 | 2.1%(+6.72)#467 |
| 11. | 02539 | 8.6% | 2.4%(+6.22)#11 | 2.1%(+6.52)#482 |
| 12. | 02542 | 8.4% | 2.4%(+6.03)#12 | 2.1%(+6.33)#503 |
| 13. | 02325 | 8.3% | 2.4%(+5.91)#13 | 2.1%(+6.21)#523 |
| 14. | 01262 | 8.0% | 2.4%(+5.68)#14 | 2.1%(+5.98)#549 |
| 15. | 01009 | 8.0% | 2.4%(+5.60)#15 | 2.1%(+5.90)#558 |
| 16. | 02357 | 7.9% | 2.4%(+5.51)#16 | 2.1%(+5.80)#569 |
| 17. | 01060 | 7.4% | 2.4%(+5.06)#17 | 2.1%(+5.36)#661 |
| 18. | 02561 | 7.3% | 2.4%(+4.92)#18 | 2.1%(+5.22)#695 |
| 19. | 02791 | 7.2% | 2.4%(+4.87)#19 | 2.1%(+5.17)#705 |
| 20. | 02138 | 7.1% | 2.4%(+4.74)#20 | 2.1%(+5.04)#732 |
| 21. | 02457 | 6.9% | 2.4%(+4.49)#21 | 2.1%(+4.79)#792 |
| 22. | 01032 | 6.5% | 2.4%(+4.17)#22 | 2.1%(+4.47)#869 |
| 23. | 01267 | 6.3% | 2.4%(+3.91)#23 | 2.1%(+4.20)#945 |
| 24. | 02113 | 6.3% | 2.4%(+3.89)#24 | 2.1%(+4.19)#948 |
| 25. | 01098 | 6.2% | 2.4%(+3.88)#25 | 2.1%(+4.18)#957 |
| 26. | 01921 | 6.2% | 2.4%(+3.88)#26 | 2.1%(+4.18)#959 |
| 27. | 01944 | 6.0% | 2.4%(+3.64)#27 | 2.1%(+3.94)#1,028 |
| 28. | 01229 | 6.0% | 2.4%(+3.64)#28 | 2.1%(+3.94)#1,031 |
| 29. | 01026 | 5.9% | 2.4%(+3.55)#29 | 2.1%(+3.84)#1,077 |
| 30. | 02215 | 5.9% | 2.4%(+3.52)#30 | 2.1%(+3.82)#1,082 |
| 31. | 02645 | 5.6% | 2.4%(+3.22)#31 | 2.1%(+3.52)#1,209 |
| 32. | 01754 | 5.6% | 2.4%(+3.21)#32 | 2.1%(+3.51)#1,212 |
| 33. | 01351 | 5.5% | 2.4%(+3.10)#33 | 2.1%(+3.40)#1,273 |
| 34. | 01096 | 5.3% | 2.4%(+2.95)#34 | 2.1%(+3.25)#1,345 |
| 35. | 01950 | 5.3% | 2.4%(+2.92)#35 | 2.1%(+3.22)#1,358 |
| 36. | 01062 | 5.1% | 2.4%(+2.78)#36 | 2.1%(+3.08)#1,429 |
| 37. | 01966 | 5.0% | 2.4%(+2.67)#37 | 2.1%(+2.97)#1,483 |
| 38. | 01773 | 5.0% | 2.4%(+2.67)#38 | 2.1%(+2.97)#1,486 |
| 39. | 01035 | 5.0% | 2.4%(+2.67)#39 | 2.1%(+2.96)#1,487 |
| 40. | 02130 | 5.0% | 2.4%(+2.64)#40 | 2.1%(+2.94)#1,506 |
| 41. | 01029 | 5.0% | 2.4%(+2.60)#41 | 2.1%(+2.90)#1,518 |
| 42. | 01106 | 4.9% | 2.4%(+2.53)#42 | 2.1%(+2.83)#1,565 |
| 43. | 01118 | 4.8% | 2.4%(+2.48)#43 | 2.1%(+2.77)#1,591 |
| 44. | 01741 | 4.8% | 2.4%(+2.47)#44 | 2.1%(+2.76)#1,598 |
| 45. | 01003 | 4.8% | 2.4%(+2.46)#45 | 2.1%(+2.76)#1,599 |
| 46. | 01864 | 4.8% | 2.4%(+2.45)#46 | 2.1%(+2.75)#1,611 |
| 47. | 02642 | 4.8% | 2.4%(+2.44)#47 | 2.1%(+2.74)#1,619 |
| 48. | 02660 | 4.8% | 2.4%(+2.43)#48 | 2.1%(+2.73)#1,624 |
| 49. | 02630 | 4.8% | 2.4%(+2.40)#49 | 2.1%(+2.70)#1,652 |
| 50. | 02066 | 4.7% | 2.4%(+2.39)#50 | 2.1%(+2.69)#1,662 |
| 51. | 02030 | 4.7% | 2.4%(+2.38)#51 | 2.1%(+2.68)#1,663 |
| 52. | 01054 | 4.7% | 2.4%(+2.31)#52 | 2.1%(+2.61)#1,714 |
| 53. | 02115 | 4.7% | 2.4%(+2.30)#53 | 2.1%(+2.59)#1,727 |
| 54. | 02474 | 4.6% | 2.4%(+2.27)#54 | 2.1%(+2.57)#1,752 |
| 55. | 02141 | 4.6% | 2.4%(+2.22)#55 | 2.1%(+2.52)#1,791 |
| 56. | 02144 | 4.6% | 2.4%(+2.22)#56 | 2.1%(+2.51)#1,795 |
| 57. | 02472 | 4.5% | 2.4%(+2.16)#57 | 2.1%(+2.46)#1,831 |
| 58. | 02210 | 4.5% | 2.4%(+2.16)#58 | 2.1%(+2.45)#1,842 |
| 59. | 01985 | 4.5% | 2.4%(+2.09)#59 | 2.1%(+2.39)#1,894 |
| 60. | 02143 | 4.4% | 2.4%(+2.05)#60 | 2.1%(+2.35)#1,932 |
| 61. | 02458 | 4.4% | 2.4%(+2.05)#61 | 2.1%(+2.35)#1,934 |
| 62. | 02576 | 4.4% | 2.4%(+2.03)#62 | 2.1%(+2.33)#1,950 |
| 63. | 02554 | 4.4% | 2.4%(+2.01)#63 | 2.1%(+2.31)#1,968 |
| 64. | 01022 | 4.4% | 2.4%(+2.00)#64 | 2.1%(+2.30)#1,975 |
| 65. | 02131 | 4.3% | 2.4%(+1.97)#65 | 2.1%(+2.26)#2,011 |
| 66. | 02108 | 4.3% | 2.4%(+1.93)#66 | 2.1%(+2.23)#2,048 |
| 67. | 02134 | 4.2% | 2.4%(+1.88)#67 | 2.1%(+2.18)#2,096 |
| 68. | 01038 | 4.2% | 2.4%(+1.86)#68 | 2.1%(+2.16)#2,132 |
| 69. | 02145 | 4.2% | 2.4%(+1.80)#69 | 2.1%(+2.10)#2,173 |
| 70. | 02481 | 4.1% | 2.4%(+1.78)#70 | 2.1%(+2.08)#2,198 |
| 71. | 02460 | 4.1% | 2.4%(+1.78)#71 | 2.1%(+2.08)#2,204 |
| 72. | 02461 | 4.1% | 2.4%(+1.77)#72 | 2.1%(+2.07)#2,216 |
| 73. | 01245 | 4.1% | 2.4%(+1.75)#73 | 2.1%(+2.05)#2,240 |
| 74. | 02540 | 4.1% | 2.4%(+1.75)#74 | 2.1%(+2.05)#2,241 |
| 75. | 01770 | 4.1% | 2.4%(+1.74)#75 | 2.1%(+2.04)#2,256 |
| 76. | 01745 | 4.1% | 2.4%(+1.72)#76 | 2.1%(+2.02)#2,274 |
| 77. | 02738 | 4.0% | 2.4%(+1.69)#77 | 2.1%(+1.98)#2,315 |
| 78. | 02478 | 4.0% | 2.4%(+1.67)#78 | 2.1%(+1.97)#2,333 |
| 79. | 02459 | 4.0% | 2.4%(+1.67)#79 | 2.1%(+1.97)#2,338 |
| 80. | 01886 | 4.0% | 2.4%(+1.66)#80 | 2.1%(+1.96)#2,349 |
| 81. | 01464 | 4.0% | 2.4%(+1.63)#81 | 2.1%(+1.93)#2,378 |
| 82. | 02476 | 4.0% | 2.4%(+1.61)#82 | 2.1%(+1.91)#2,400 |
| 83. | 01236 | 4.0% | 2.4%(+1.61)#83 | 2.1%(+1.91)#2,404 |
| 84. | 02465 | 3.9% | 2.4%(+1.58)#84 | 2.1%(+1.88)#2,446 |
| 85. | 02635 | 3.9% | 2.4%(+1.57)#85 | 2.1%(+1.86)#2,463 |
| 86. | 01451 | 3.9% | 2.4%(+1.51)#86 | 2.1%(+1.81)#2,529 |
| 87. | 01527 | 3.9% | 2.4%(+1.50)#87 | 2.1%(+1.80)#2,539 |
| 88. | 02543 | 3.9% | 2.4%(+1.50)#88 | 2.1%(+1.80)#2,548 |
| 89. | 02093 | 3.8% | 2.4%(+1.49)#89 | 2.1%(+1.78)#2,565 |
| 90. | 01566 | 3.8% | 2.4%(+1.45)#90 | 2.1%(+1.75)#2,612 |
| 91. | 02176 | 3.8% | 2.4%(+1.45)#91 | 2.1%(+1.75)#2,616 |
| 92. | 02090 | 3.8% | 2.4%(+1.42)#92 | 2.1%(+1.72)#2,651 |
| 93. | 01370 | 3.8% | 2.4%(+1.42)#93 | 2.1%(+1.72)#2,656 |
| 94. | 02045 | 3.8% | 2.4%(+1.41)#94 | 2.1%(+1.70)#2,672 |
| 95. | 02446 | 3.8% | 2.4%(+1.40)#95 | 2.1%(+1.69)#2,682 |
| 96. | 02114 | 3.8% | 2.4%(+1.39)#96 | 2.1%(+1.69)#2,683 |
| 97. | 01542 | 3.8% | 2.4%(+1.39)#97 | 2.1%(+1.69)#2,686 |
| 98. | 02562 | 3.7% | 2.4%(+1.38)#98 | 2.1%(+1.68)#2,707 |
| 99. | 01367 | 3.7% | 2.4%(+1.38)#99 | 2.1%(+1.68)#2,712 |
| 100. | 01339 | 3.7% | 2.4%(+1.37)#100 | 2.1%(+1.66)#2,726 |
Common Questions
What are the Top 10 Zip Codes with the Highest Percentage of Population Employed in Arts, Media & Entertainment in Massachusetts?
Top 10 Zip Codes with the Highest Percentage of Population Employed in Arts, Media & Entertainment in Massachusetts are:
What zip code has the Highest Percentage of Population Employed in Arts, Media & Entertainment in Massachusetts?
01346 has the Highest Percentage of Population Employed in Arts, Media & Entertainment in Massachusetts with 22.8%.
What is the Percentage of Population Employed in Arts, Media & Entertainment in the State of Massachusetts?
Percentage of Population Employed in Arts, Media & Entertainment in Massachusetts is 2.4%.
What is the Percentage of Population Employed in Arts, Media & Entertainment in the United States?
Percentage of Population Employed in Arts, Media & Entertainment in the United States is 2.1%.