Zip Codes with the Highest Percentage of Population Employed in Arts, Media & Entertainment in Montana
RELATED REPORTS & OPTIONS
Arts, Media & Entertainment
Montana
Compare Zip Codes
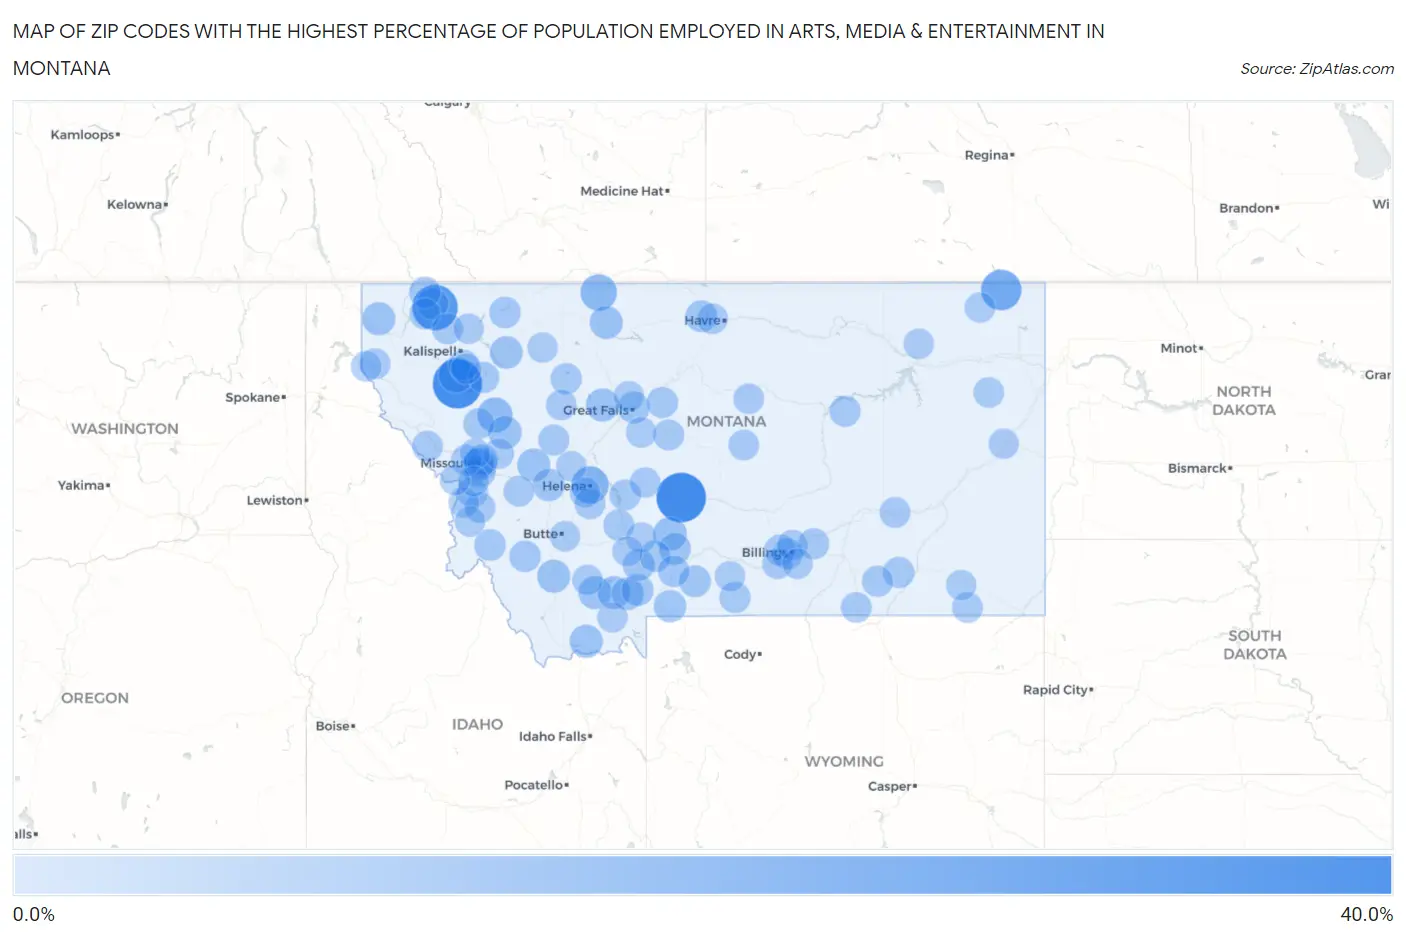
Map of Zip Codes with the Highest Percentage of Population Employed in Arts, Media & Entertainment in Montana
0.0%
40.0%
Zip Codes with the Highest Percentage of Population Employed in Arts, Media & Entertainment in Montana
| Zip Code | % Employed | vs State | vs National | |
| 1. | 59053 | 38.0% | 2.0%(+36.0)#1 | 2.1%(+35.9)#24 |
| 2. | 59915 | 37.5% | 2.0%(+35.5)#2 | 2.1%(+35.4)#25 |
| 3. | 59933 | 30.0% | 2.0%(+28.0)#3 | 2.1%(+27.9)#41 |
| 4. | 59252 | 20.6% | 2.0%(+18.6)#4 | 2.1%(+18.5)#87 |
| 5. | 59625 | 14.5% | 2.0%(+12.6)#5 | 2.1%(+12.5)#178 |
| 6. | 59482 | 12.7% | 2.0%(+10.8)#6 | 2.1%(+10.7)#225 |
| 7. | 59929 | 10.7% | 2.0%(+8.70)#7 | 2.1%(+8.61)#327 |
| 8. | 59826 | 10.4% | 2.0%(+8.43)#8 | 2.1%(+8.34)#349 |
| 9. | 59086 | 7.4% | 2.0%(+5.44)#9 | 2.1%(+5.35)#663 |
| 10. | 59812 | 7.0% | 2.0%(+5.08)#10 | 2.1%(+4.99)#752 |
| 11. | 59868 | 6.8% | 2.0%(+4.86)#11 | 2.1%(+4.76)#799 |
| 12. | 59739 | 6.8% | 2.0%(+4.83)#12 | 2.1%(+4.74)#807 |
| 13. | 59935 | 6.8% | 2.0%(+4.79)#13 | 2.1%(+4.70)#815 |
| 14. | 59443 | 6.6% | 2.0%(+4.68)#14 | 2.1%(+4.58)#842 |
| 15. | 59732 | 6.6% | 2.0%(+4.65)#15 | 2.1%(+4.56)#849 |
| 16. | 59843 | 6.6% | 2.0%(+4.61)#16 | 2.1%(+4.52)#855 |
| 17. | 59755 | 6.6% | 2.0%(+4.59)#17 | 2.1%(+4.50)#860 |
| 18. | 59474 | 6.5% | 2.0%(+4.57)#18 | 2.1%(+4.48)#866 |
| 19. | 59729 | 6.1% | 2.0%(+4.16)#19 | 2.1%(+4.07)#992 |
| 20. | 59936 | 5.9% | 2.0%(+3.97)#20 | 2.1%(+3.87)#1,063 |
| 21. | 59716 | 5.5% | 2.0%(+3.54)#21 | 2.1%(+3.45)#1,246 |
| 22. | 59731 | 5.4% | 2.0%(+3.39)#22 | 2.1%(+3.30)#1,322 |
| 23. | 59030 | 5.3% | 2.0%(+3.38)#23 | 2.1%(+3.29)#1,325 |
| 24. | 59730 | 4.6% | 2.0%(+2.68)#24 | 2.1%(+2.58)#1,737 |
| 25. | 59018 | 4.5% | 2.0%(+2.48)#25 | 2.1%(+2.39)#1,895 |
| 26. | 59414 | 4.4% | 2.0%(+2.47)#26 | 2.1%(+2.38)#1,908 |
| 27. | 59803 | 4.3% | 2.0%(+2.33)#27 | 2.1%(+2.23)#2,047 |
| 28. | 59718 | 4.3% | 2.0%(+2.29)#28 | 2.1%(+2.19)#2,086 |
| 29. | 59052 | 4.2% | 2.0%(+2.26)#29 | 2.1%(+2.16)#2,125 |
| 30. | 59532 | 4.2% | 2.0%(+2.26)#30 | 2.1%(+2.16)#2,126 |
| 31. | 59918 | 4.0% | 2.0%(+2.00)#31 | 2.1%(+1.90)#2,416 |
| 32. | 59715 | 3.9% | 2.0%(+1.93)#32 | 2.1%(+1.83)#2,503 |
| 33. | 59871 | 3.9% | 2.0%(+1.91)#33 | 2.1%(+1.82)#2,527 |
| 34. | 59434 | 3.8% | 2.0%(+1.88)#34 | 2.1%(+1.79)#2,562 |
| 35. | 59047 | 3.7% | 2.0%(+1.75)#35 | 2.1%(+1.66)#2,742 |
| 36. | 59762 | 3.6% | 2.0%(+1.67)#36 | 2.1%(+1.58)#2,857 |
| 37. | 59917 | 3.5% | 2.0%(+1.53)#37 | 2.1%(+1.43)#3,080 |
| 38. | 59043 | 3.2% | 2.0%(+1.26)#38 | 2.1%(+1.16)#3,569 |
| 39. | 59450 | 3.2% | 2.0%(+1.23)#39 | 2.1%(+1.14)#3,615 |
| 40. | 59106 | 3.1% | 2.0%(+1.18)#40 | 2.1%(+1.09)#3,745 |
| 41. | 59422 | 3.1% | 2.0%(+1.14)#41 | 2.1%(+1.05)#3,836 |
| 42. | 59865 | 3.1% | 2.0%(+1.11)#42 | 2.1%(+1.01)#3,905 |
| 43. | 59068 | 3.1% | 2.0%(+1.10)#43 | 2.1%(+1.00)#3,938 |
| 44. | 59006 | 3.0% | 2.0%(+0.994)#44 | 2.1%(+0.900)#4,182 |
| 45. | 59318 | 2.9% | 2.0%(+0.975)#45 | 2.1%(+0.880)#4,231 |
| 46. | 59934 | 2.9% | 2.0%(+0.958)#46 | 2.1%(+0.863)#4,276 |
| 47. | 59016 | 2.9% | 2.0%(+0.911)#47 | 2.1%(+0.817)#4,403 |
| 48. | 59937 | 2.9% | 2.0%(+0.888)#48 | 2.1%(+0.793)#4,464 |
| 49. | 59644 | 2.9% | 2.0%(+0.886)#49 | 2.1%(+0.792)#4,469 |
| 50. | 59643 | 2.8% | 2.0%(+0.819)#50 | 2.1%(+0.725)#4,658 |
| 51. | 59639 | 2.8% | 2.0%(+0.801)#51 | 2.1%(+0.707)#4,707 |
| 52. | 59469 | 2.7% | 2.0%(+0.773)#52 | 2.1%(+0.679)#4,796 |
| 53. | 59911 | 2.7% | 2.0%(+0.733)#53 | 2.1%(+0.638)#4,910 |
| 54. | 59327 | 2.6% | 2.0%(+0.600)#54 | 2.1%(+0.506)#5,348 |
| 55. | 59802 | 2.5% | 2.0%(+0.543)#55 | 2.1%(+0.448)#5,525 |
| 56. | 59853 | 2.5% | 2.0%(+0.534)#56 | 2.1%(+0.439)#5,548 |
| 57. | 59801 | 2.5% | 2.0%(+0.521)#57 | 2.1%(+0.427)#5,593 |
| 58. | 59102 | 2.5% | 2.0%(+0.495)#58 | 2.1%(+0.401)#5,678 |
| 59. | 59872 | 2.4% | 2.0%(+0.473)#59 | 2.1%(+0.378)#5,786 |
| 60. | 59314 | 2.4% | 2.0%(+0.473)#60 | 2.1%(+0.378)#5,794 |
| 61. | 59501 | 2.4% | 2.0%(+0.392)#61 | 2.1%(+0.298)#6,096 |
| 62. | 59638 | 2.3% | 2.0%(+0.381)#62 | 2.1%(+0.287)#6,153 |
| 63. | 59837 | 2.3% | 2.0%(+0.349)#63 | 2.1%(+0.254)#6,318 |
| 64. | 59457 | 2.2% | 2.0%(+0.257)#64 | 2.1%(+0.162)#6,710 |
| 65. | 59089 | 2.2% | 2.0%(+0.256)#65 | 2.1%(+0.161)#6,720 |
| 66. | 59044 | 2.2% | 2.0%(+0.198)#66 | 2.1%(+0.103)#6,982 |
| 67. | 59870 | 2.1% | 2.0%(+0.168)#67 | 2.1%(+0.073)#7,111 |
| 68. | 59489 | 2.1% | 2.0%(+0.132)#68 | 2.1%(+0.037)#7,290 |
| 69. | 59259 | 2.1% | 2.0%(+0.106)#69 | 2.1%(+0.012)#7,424 |
| 70. | 59828 | 2.1% | 2.0%(+0.103)#70 | 2.1%(+0.008)#7,439 |
| 71. | 59645 | 2.0% | 2.0%(+0.058)#71 | 2.1%(-0.036)#7,679 |
| 72. | 59410 | 2.0% | 2.0%(+0.042)#72 | 2.1%(-0.053)#7,776 |
| 73. | 59480 | 2.0% | 2.0%(+0.007)#73 | 2.1%(-0.087)#7,963 |
| 74. | 59601 | 2.0% | 2.0%(-0.013)#74 | 2.1%(-0.108)#8,071 |
| 75. | 59932 | 1.9% | 2.0%(-0.070)#75 | 2.1%(-0.164)#8,402 |
| 76. | 59844 | 1.9% | 2.0%(-0.088)#76 | 2.1%(-0.183)#8,510 |
| 77. | 59248 | 1.9% | 2.0%(-0.101)#77 | 2.1%(-0.196)#8,588 |
| 78. | 59222 | 1.8% | 2.0%(-0.131)#78 | 2.1%(-0.226)#8,770 |
| 79. | 59749 | 1.8% | 2.0%(-0.146)#79 | 2.1%(-0.241)#8,860 |
| 80. | 59922 | 1.8% | 2.0%(-0.158)#80 | 2.1%(-0.252)#8,933 |
| 81. | 59714 | 1.8% | 2.0%(-0.167)#81 | 2.1%(-0.262)#8,981 |
| 82. | 59823 | 1.8% | 2.0%(-0.179)#82 | 2.1%(-0.273)#9,046 |
| 83. | 59105 | 1.8% | 2.0%(-0.179)#83 | 2.1%(-0.274)#9,048 |
| 84. | 59404 | 1.8% | 2.0%(-0.195)#84 | 2.1%(-0.289)#9,143 |
| 85. | 59448 | 1.8% | 2.0%(-0.196)#85 | 2.1%(-0.291)#9,156 |
| 86. | 59701 | 1.8% | 2.0%(-0.197)#86 | 2.1%(-0.291)#9,159 |
| 87. | 59875 | 1.8% | 2.0%(-0.197)#87 | 2.1%(-0.291)#9,162 |
| 88. | 59804 | 1.7% | 2.0%(-0.221)#88 | 2.1%(-0.315)#9,296 |
| 89. | 59633 | 1.7% | 2.0%(-0.232)#89 | 2.1%(-0.327)#9,379 |
| 90. | 59001 | 1.7% | 2.0%(-0.292)#90 | 2.1%(-0.387)#9,824 |
| 91. | 59741 | 1.7% | 2.0%(-0.297)#91 | 2.1%(-0.391)#9,857 |
| 92. | 59101 | 1.7% | 2.0%(-0.300)#92 | 2.1%(-0.394)#9,870 |
| 93. | 59720 | 1.7% | 2.0%(-0.300)#93 | 2.1%(-0.394)#9,877 |
| 94. | 59330 | 1.7% | 2.0%(-0.309)#94 | 2.1%(-0.404)#9,942 |
| 95. | 59808 | 1.6% | 2.0%(-0.319)#95 | 2.1%(-0.414)#10,017 |
| 96. | 59833 | 1.6% | 2.0%(-0.341)#96 | 2.1%(-0.436)#10,167 |
| 97. | 59847 | 1.6% | 2.0%(-0.354)#97 | 2.1%(-0.448)#10,253 |
| 98. | 59840 | 1.6% | 2.0%(-0.354)#98 | 2.1%(-0.449)#10,255 |
| 99. | 59912 | 1.6% | 2.0%(-0.366)#99 | 2.1%(-0.460)#10,333 |
| 100. | 59317 | 1.6% | 2.0%(-0.376)#100 | 2.1%(-0.471)#10,400 |
Common Questions
What are the Top 10 Zip Codes with the Highest Percentage of Population Employed in Arts, Media & Entertainment in Montana?
Top 10 Zip Codes with the Highest Percentage of Population Employed in Arts, Media & Entertainment in Montana are:
What zip code has the Highest Percentage of Population Employed in Arts, Media & Entertainment in Montana?
59053 has the Highest Percentage of Population Employed in Arts, Media & Entertainment in Montana with 38.0%.
What is the Percentage of Population Employed in Arts, Media & Entertainment in the State of Montana?
Percentage of Population Employed in Arts, Media & Entertainment in Montana is 2.0%.
What is the Percentage of Population Employed in Arts, Media & Entertainment in the United States?
Percentage of Population Employed in Arts, Media & Entertainment in the United States is 2.1%.