Zip Codes with the Highest Percentage of Population Employed in Arts, Media & Entertainment in Washington
RELATED REPORTS & OPTIONS
Arts, Media & Entertainment
Washington
Compare Zip Codes
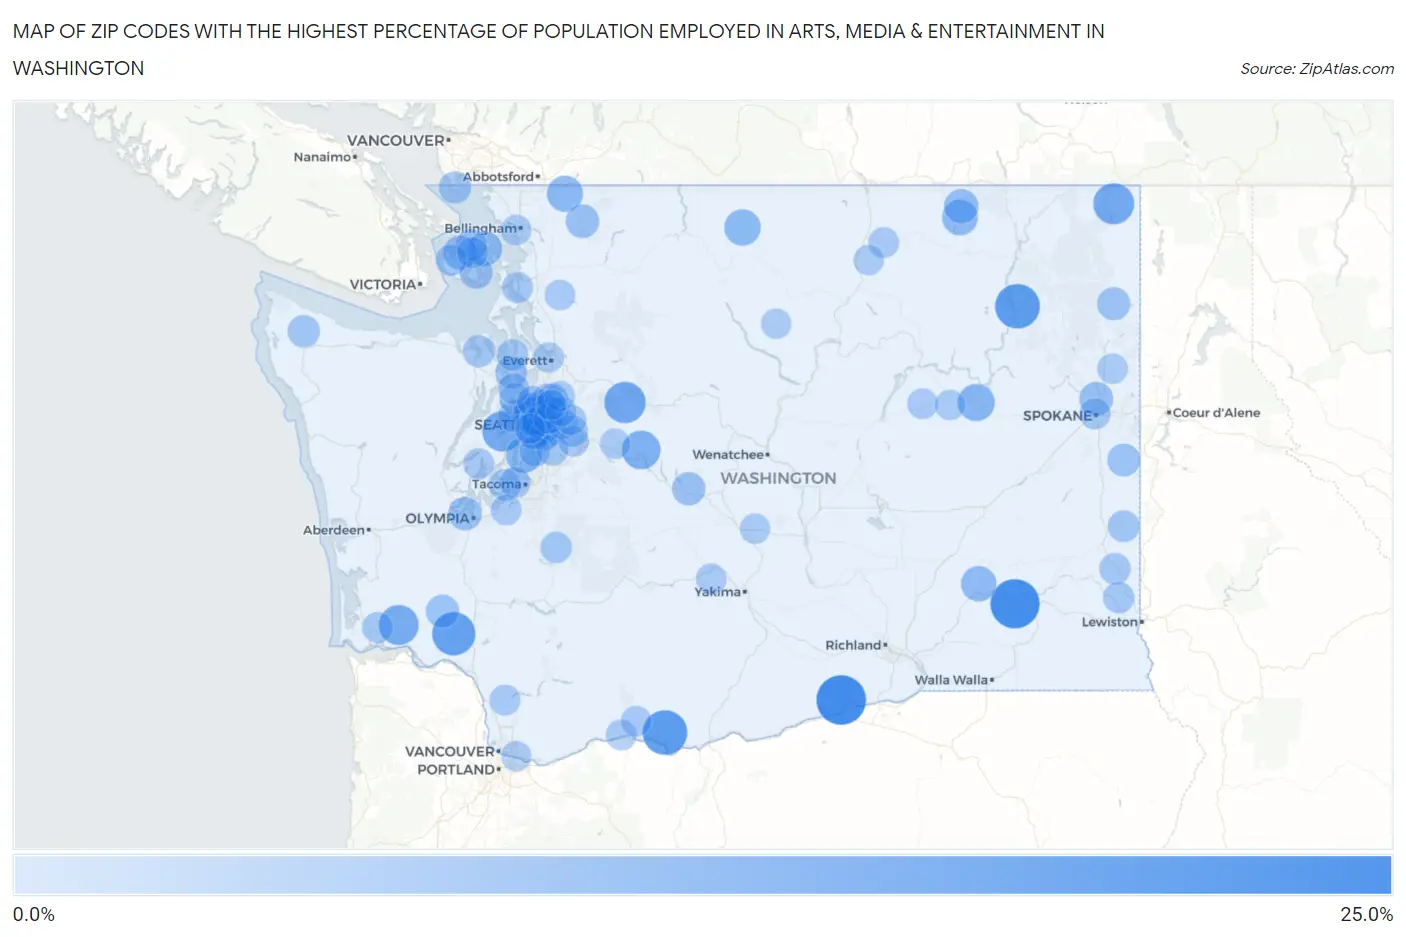
Map of Zip Codes with the Highest Percentage of Population Employed in Arts, Media & Entertainment in Washington
0.0%
25.0%
Zip Codes with the Highest Percentage of Population Employed in Arts, Media & Entertainment in Washington
| Zip Code | % Employed | vs State | vs National | |
| 1. | 99345 | 21.4% | 2.1%(+19.3)#1 | 2.1%(+19.4)#78 |
| 2. | 99359 | 21.1% | 2.1%(+19.0)#2 | 2.1%(+19.0)#83 |
| 3. | 99131 | 16.7% | 2.1%(+14.6)#3 | 2.1%(+14.6)#138 |
| 4. | 98635 | 16.6% | 2.1%(+14.5)#4 | 2.1%(+14.5)#139 |
| 5. | 98581 | 15.3% | 2.1%(+13.2)#5 | 2.1%(+13.2)#159 |
| 6. | 98224 | 13.4% | 2.1%(+11.3)#6 | 2.1%(+11.3)#202 |
| 7. | 99153 | 13.0% | 2.1%(+10.9)#7 | 2.1%(+10.9)#216 |
| 8. | 98314 | 12.5% | 2.1%(+10.4)#8 | 2.1%(+10.4)#232 |
| 9. | 98621 | 12.0% | 2.1%(+9.92)#9 | 2.1%(+9.94)#255 |
| 10. | 98068 | 10.7% | 2.1%(+8.65)#10 | 2.1%(+8.67)#325 |
| 11. | 99117 | 9.3% | 2.1%(+7.24)#11 | 2.1%(+7.27)#425 |
| 12. | 98833 | 8.6% | 2.1%(+6.54)#12 | 2.1%(+6.56)#478 |
| 13. | 98070 | 8.3% | 2.1%(+6.27)#13 | 2.1%(+6.29)#507 |
| 14. | 98266 | 8.3% | 2.1%(+6.23)#14 | 2.1%(+6.26)#516 |
| 15. | 99150 | 8.0% | 2.1%(+5.92)#15 | 2.1%(+5.94)#553 |
| 16. | 99335 | 7.7% | 2.1%(+5.61)#16 | 2.1%(+5.63)#601 |
| 17. | 98279 | 6.7% | 2.1%(+4.61)#17 | 2.1%(+4.63)#835 |
| 18. | 99118 | 6.7% | 2.1%(+4.60)#18 | 2.1%(+4.62)#837 |
| 19. | 98122 | 6.4% | 2.1%(+4.37)#19 | 2.1%(+4.39)#889 |
| 20. | 98243 | 6.2% | 2.1%(+4.17)#20 | 2.1%(+4.19)#953 |
| 21. | 99251 | 6.2% | 2.1%(+4.11)#21 | 2.1%(+4.13)#978 |
| 22. | 98107 | 6.2% | 2.1%(+4.07)#22 | 2.1%(+4.09)#986 |
| 23. | 98102 | 6.1% | 2.1%(+3.98)#23 | 2.1%(+4.00)#1,016 |
| 24. | 98244 | 5.9% | 2.1%(+3.85)#24 | 2.1%(+3.87)#1,062 |
| 25. | 98505 | 5.8% | 2.1%(+3.70)#25 | 2.1%(+3.72)#1,123 |
| 26. | 98941 | 5.7% | 2.1%(+3.62)#26 | 2.1%(+3.65)#1,158 |
| 27. | 98119 | 5.6% | 2.1%(+3.55)#27 | 2.1%(+3.57)#1,184 |
| 28. | 98144 | 5.6% | 2.1%(+3.52)#28 | 2.1%(+3.55)#1,193 |
| 29. | 98538 | 5.6% | 2.1%(+3.52)#29 | 2.1%(+3.54)#1,197 |
| 30. | 98104 | 5.5% | 2.1%(+3.42)#30 | 2.1%(+3.44)#1,249 |
| 31. | 98117 | 5.5% | 2.1%(+3.40)#31 | 2.1%(+3.42)#1,257 |
| 32. | 99180 | 5.5% | 2.1%(+3.39)#32 | 2.1%(+3.41)#1,264 |
| 33. | 98199 | 5.4% | 2.1%(+3.32)#33 | 2.1%(+3.34)#1,303 |
| 34. | 99012 | 5.4% | 2.1%(+3.27)#34 | 2.1%(+3.29)#1,324 |
| 35. | 98112 | 5.2% | 2.1%(+3.08)#35 | 2.1%(+3.10)#1,419 |
| 36. | 98261 | 5.2% | 2.1%(+3.07)#36 | 2.1%(+3.09)#1,422 |
| 37. | 98326 | 4.9% | 2.1%(+2.78)#37 | 2.1%(+2.80)#1,580 |
| 38. | 98281 | 4.7% | 2.1%(+2.66)#38 | 2.1%(+2.68)#1,667 |
| 39. | 98103 | 4.7% | 2.1%(+2.63)#39 | 2.1%(+2.66)#1,682 |
| 40. | 98126 | 4.6% | 2.1%(+2.49)#40 | 2.1%(+2.51)#1,797 |
| 41. | 98040 | 4.5% | 2.1%(+2.43)#41 | 2.1%(+2.46)#1,840 |
| 42. | 98368 | 4.5% | 2.1%(+2.43)#42 | 2.1%(+2.45)#1,845 |
| 43. | 98110 | 4.4% | 2.1%(+2.35)#43 | 2.1%(+2.37)#1,912 |
| 44. | 99130 | 4.3% | 2.1%(+2.23)#44 | 2.1%(+2.25)#2,023 |
| 45. | 98340 | 4.3% | 2.1%(+2.17)#45 | 2.1%(+2.19)#2,084 |
| 46. | 98109 | 4.2% | 2.1%(+2.15)#46 | 2.1%(+2.18)#2,108 |
| 47. | 98245 | 4.1% | 2.1%(+2.05)#47 | 2.1%(+2.07)#2,212 |
| 48. | 98333 | 4.1% | 2.1%(+2.04)#48 | 2.1%(+2.06)#2,221 |
| 49. | 99163 | 4.1% | 2.1%(+1.97)#49 | 2.1%(+1.99)#2,300 |
| 50. | 98249 | 3.9% | 2.1%(+1.84)#50 | 2.1%(+1.86)#2,473 |
| 51. | 98055 | 3.9% | 2.1%(+1.83)#51 | 2.1%(+1.86)#2,477 |
| 52. | 98115 | 3.9% | 2.1%(+1.83)#52 | 2.1%(+1.85)#2,478 |
| 53. | 99113 | 3.9% | 2.1%(+1.82)#53 | 2.1%(+1.85)#2,492 |
| 54. | 98250 | 3.9% | 2.1%(+1.78)#54 | 2.1%(+1.80)#2,540 |
| 55. | 98328 | 3.9% | 2.1%(+1.77)#55 | 2.1%(+1.79)#2,553 |
| 56. | 98342 | 3.8% | 2.1%(+1.71)#56 | 2.1%(+1.73)#2,631 |
| 57. | 98280 | 3.8% | 2.1%(+1.68)#57 | 2.1%(+1.70)#2,677 |
| 58. | 98106 | 3.7% | 2.1%(+1.67)#58 | 2.1%(+1.69)#2,694 |
| 59. | 98121 | 3.7% | 2.1%(+1.67)#59 | 2.1%(+1.69)#2,695 |
| 60. | 98029 | 3.7% | 2.1%(+1.62)#60 | 2.1%(+1.64)#2,770 |
| 61. | 99201 | 3.6% | 2.1%(+1.55)#61 | 2.1%(+1.57)#2,860 |
| 62. | 98346 | 3.6% | 2.1%(+1.54)#62 | 2.1%(+1.56)#2,880 |
| 63. | 98257 | 3.6% | 2.1%(+1.48)#63 | 2.1%(+1.50)#2,970 |
| 64. | 98118 | 3.5% | 2.1%(+1.46)#64 | 2.1%(+1.48)#3,016 |
| 65. | 98465 | 3.5% | 2.1%(+1.44)#65 | 2.1%(+1.47)#3,032 |
| 66. | 98638 | 3.5% | 2.1%(+1.44)#66 | 2.1%(+1.46)#3,041 |
| 67. | 98674 | 3.4% | 2.1%(+1.32)#67 | 2.1%(+1.35)#3,232 |
| 68. | 98524 | 3.4% | 2.1%(+1.29)#68 | 2.1%(+1.31)#3,310 |
| 69. | 98651 | 3.3% | 2.1%(+1.26)#69 | 2.1%(+1.28)#3,360 |
| 70. | 98433 | 3.3% | 2.1%(+1.20)#70 | 2.1%(+1.22)#3,458 |
| 71. | 98028 | 3.3% | 2.1%(+1.18)#71 | 2.1%(+1.20)#3,488 |
| 72. | 98033 | 3.2% | 2.1%(+1.15)#72 | 2.1%(+1.18)#3,534 |
| 73. | 99103 | 3.2% | 2.1%(+1.13)#73 | 2.1%(+1.15)#3,586 |
| 74. | 98947 | 3.2% | 2.1%(+1.12)#74 | 2.1%(+1.14)#3,601 |
| 75. | 98855 | 3.2% | 2.1%(+1.11)#75 | 2.1%(+1.14)#3,619 |
| 76. | 98125 | 3.2% | 2.1%(+1.11)#76 | 2.1%(+1.13)#3,623 |
| 77. | 98105 | 3.2% | 2.1%(+1.10)#77 | 2.1%(+1.12)#3,652 |
| 78. | 98177 | 3.2% | 2.1%(+1.10)#78 | 2.1%(+1.12)#3,666 |
| 79. | 98672 | 3.2% | 2.1%(+1.09)#79 | 2.1%(+1.12)#3,670 |
| 80. | 98011 | 3.2% | 2.1%(+1.08)#80 | 2.1%(+1.10)#3,708 |
| 81. | 98101 | 3.2% | 2.1%(+1.07)#81 | 2.1%(+1.09)#3,733 |
| 82. | 98008 | 3.1% | 2.1%(+1.07)#82 | 2.1%(+1.09)#3,736 |
| 83. | 98027 | 3.1% | 2.1%(+1.06)#83 | 2.1%(+1.09)#3,742 |
| 84. | 99003 | 3.1% | 2.1%(+1.04)#84 | 2.1%(+1.06)#3,799 |
| 85. | 98274 | 3.1% | 2.1%(+1.02)#85 | 2.1%(+1.05)#3,840 |
| 86. | 98039 | 3.1% | 2.1%(+1.02)#86 | 2.1%(+1.04)#3,850 |
| 87. | 98166 | 3.1% | 2.1%(+1.02)#87 | 2.1%(+1.04)#3,851 |
| 88. | 98849 | 3.0% | 2.1%(+0.947)#88 | 2.1%(+0.969)#4,010 |
| 89. | 98814 | 3.0% | 2.1%(+0.939)#89 | 2.1%(+0.961)#4,029 |
| 90. | 99185 | 3.0% | 2.1%(+0.935)#90 | 2.1%(+0.957)#4,037 |
| 91. | 98116 | 3.0% | 2.1%(+0.929)#91 | 2.1%(+0.951)#4,046 |
| 92. | 98225 | 3.0% | 2.1%(+0.929)#92 | 2.1%(+0.951)#4,048 |
| 93. | 98074 | 3.0% | 2.1%(+0.921)#93 | 2.1%(+0.943)#4,066 |
| 94. | 98934 | 3.0% | 2.1%(+0.915)#94 | 2.1%(+0.937)#4,079 |
| 95. | 98201 | 3.0% | 2.1%(+0.906)#95 | 2.1%(+0.928)#4,112 |
| 96. | 98052 | 3.0% | 2.1%(+0.893)#96 | 2.1%(+0.915)#4,148 |
| 97. | 98045 | 2.9% | 2.1%(+0.860)#97 | 2.1%(+0.882)#4,221 |
| 98. | 98072 | 2.9% | 2.1%(+0.833)#98 | 2.1%(+0.855)#4,301 |
| 99. | 98034 | 2.9% | 2.1%(+0.796)#99 | 2.1%(+0.818)#4,400 |
| 100. | 98683 | 2.9% | 2.1%(+0.790)#100 | 2.1%(+0.812)#4,420 |
Common Questions
What are the Top 10 Zip Codes with the Highest Percentage of Population Employed in Arts, Media & Entertainment in Washington?
Top 10 Zip Codes with the Highest Percentage of Population Employed in Arts, Media & Entertainment in Washington are:
What zip code has the Highest Percentage of Population Employed in Arts, Media & Entertainment in Washington?
99345 has the Highest Percentage of Population Employed in Arts, Media & Entertainment in Washington with 21.4%.
What is the Percentage of Population Employed in Arts, Media & Entertainment in the State of Washington?
Percentage of Population Employed in Arts, Media & Entertainment in Washington is 2.1%.
What is the Percentage of Population Employed in Arts, Media & Entertainment in the United States?
Percentage of Population Employed in Arts, Media & Entertainment in the United States is 2.1%.