Zip Codes with the Highest Percentage of Population Employed in Arts, Media & Entertainment in Colorado
RELATED REPORTS & OPTIONS
Arts, Media & Entertainment
Colorado
Compare Zip Codes
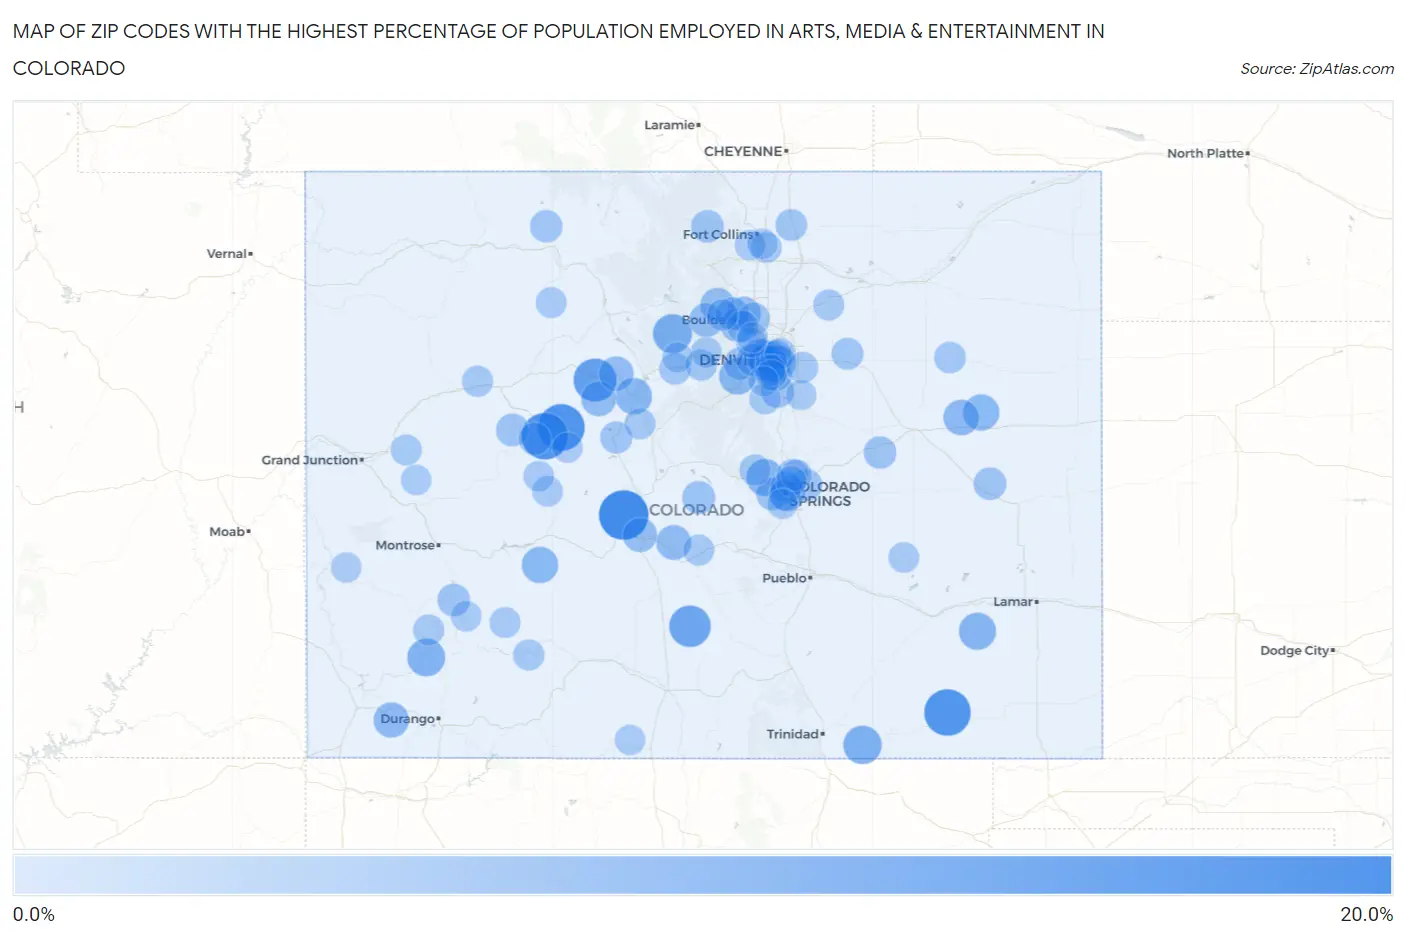
Map of Zip Codes with the Highest Percentage of Population Employed in Arts, Media & Entertainment in Colorado
0.0%
20.0%
Zip Codes with the Highest Percentage of Population Employed in Arts, Media & Entertainment in Colorado
| Zip Code | % Employed | vs State | vs National | |
| 1. | 81236 | 15.2% | 2.4%(+12.8)#1 | 2.1%(+13.1)#160 |
| 2. | 81656 | 13.5% | 2.4%(+11.0)#2 | 2.1%(+11.4)#201 |
| 3. | 81615 | 13.4% | 2.4%(+10.9)#3 | 2.1%(+11.3)#203 |
| 4. | 81049 | 13.2% | 2.4%(+10.8)#4 | 2.1%(+11.2)#210 |
| 5. | 81620 | 11.0% | 2.4%(+8.56)#5 | 2.1%(+8.94)#311 |
| 6. | 81131 | 10.1% | 2.4%(+7.69)#6 | 2.1%(+8.08)#366 |
| 7. | 80482 | 8.6% | 2.4%(+6.15)#7 | 2.1%(+6.53)#481 |
| 8. | 81081 | 8.1% | 2.4%(+5.66)#8 | 2.1%(+6.05)#538 |
| 9. | 81332 | 7.7% | 2.4%(+5.30)#9 | 2.1%(+5.69)#587 |
| 10. | 81054 | 7.3% | 2.4%(+4.84)#10 | 2.1%(+5.22)#694 |
| 11. | 80819 | 7.2% | 2.4%(+4.77)#11 | 2.1%(+5.15)#708 |
| 12. | 80454 | 7.0% | 2.4%(+4.56)#12 | 2.1%(+4.95)#762 |
| 13. | 80443 | 6.9% | 2.4%(+4.42)#13 | 2.1%(+4.81)#789 |
| 14. | 81230 | 6.8% | 2.4%(+4.38)#14 | 2.1%(+4.77)#798 |
| 15. | 80815 | 6.7% | 2.4%(+4.30)#15 | 2.1%(+4.68)#820 |
| 16. | 80804 | 6.3% | 2.4%(+3.90)#16 | 2.1%(+4.29)#914 |
| 17. | 80218 | 6.3% | 2.4%(+3.90)#17 | 2.1%(+4.29)#917 |
| 18. | 81328 | 6.1% | 2.4%(+3.66)#18 | 2.1%(+4.05)#996 |
| 19. | 81645 | 5.9% | 2.4%(+3.48)#19 | 2.1%(+3.87)#1,064 |
| 20. | 80903 | 5.9% | 2.4%(+3.48)#20 | 2.1%(+3.86)#1,069 |
| 21. | 81233 | 5.9% | 2.4%(+3.45)#21 | 2.1%(+3.84)#1,081 |
| 22. | 81657 | 5.8% | 2.4%(+3.37)#22 | 2.1%(+3.75)#1,111 |
| 23. | 80230 | 5.5% | 2.4%(+3.06)#23 | 2.1%(+3.45)#1,244 |
| 24. | 80301 | 5.5% | 2.4%(+3.04)#24 | 2.1%(+3.43)#1,255 |
| 25. | 81201 | 5.5% | 2.4%(+3.03)#25 | 2.1%(+3.41)#1,263 |
| 26. | 80455 | 5.5% | 2.4%(+3.02)#26 | 2.1%(+3.40)#1,274 |
| 27. | 80466 | 5.4% | 2.4%(+3.00)#27 | 2.1%(+3.39)#1,282 |
| 28. | 80305 | 5.1% | 2.4%(+2.70)#28 | 2.1%(+3.08)#1,426 |
| 29. | 80205 | 5.1% | 2.4%(+2.67)#29 | 2.1%(+3.06)#1,435 |
| 30. | 80203 | 4.9% | 2.4%(+2.43)#30 | 2.1%(+2.82)#1,570 |
| 31. | 80124 | 4.8% | 2.4%(+2.33)#31 | 2.1%(+2.72)#1,640 |
| 32. | 80304 | 4.8% | 2.4%(+2.32)#32 | 2.1%(+2.71)#1,644 |
| 33. | 80211 | 4.7% | 2.4%(+2.28)#33 | 2.1%(+2.67)#1,674 |
| 34. | 80820 | 4.7% | 2.4%(+2.26)#34 | 2.1%(+2.64)#1,689 |
| 35. | 80209 | 4.7% | 2.4%(+2.25)#35 | 2.1%(+2.64)#1,694 |
| 36. | 81623 | 4.6% | 2.4%(+2.20)#36 | 2.1%(+2.58)#1,740 |
| 37. | 80829 | 4.6% | 2.4%(+2.14)#37 | 2.1%(+2.53)#1,784 |
| 38. | 80212 | 4.6% | 2.4%(+2.14)#38 | 2.1%(+2.53)#1,785 |
| 39. | 80862 | 4.5% | 2.4%(+2.10)#39 | 2.1%(+2.48)#1,816 |
| 40. | 80832 | 4.5% | 2.4%(+2.02)#40 | 2.1%(+2.41)#1,883 |
| 41. | 81432 | 4.5% | 2.4%(+2.01)#41 | 2.1%(+2.39)#1,893 |
| 42. | 81654 | 4.4% | 2.4%(+2.00)#42 | 2.1%(+2.39)#1,898 |
| 43. | 80401 | 4.4% | 2.4%(+2.00)#43 | 2.1%(+2.38)#1,902 |
| 44. | 80512 | 4.4% | 2.4%(+1.99)#44 | 2.1%(+2.38)#1,907 |
| 45. | 80026 | 4.4% | 2.4%(+1.92)#45 | 2.1%(+2.30)#1,971 |
| 46. | 80487 | 4.4% | 2.4%(+1.92)#46 | 2.1%(+2.30)#1,973 |
| 47. | 80951 | 4.2% | 2.4%(+1.79)#47 | 2.1%(+2.17)#2,113 |
| 48. | 80461 | 4.2% | 2.4%(+1.78)#48 | 2.1%(+2.16)#2,131 |
| 49. | 80220 | 4.1% | 2.4%(+1.70)#49 | 2.1%(+2.09)#2,193 |
| 50. | 80215 | 4.1% | 2.4%(+1.66)#50 | 2.1%(+2.04)#2,247 |
| 51. | 80237 | 4.1% | 2.4%(+1.64)#51 | 2.1%(+2.02)#2,266 |
| 52. | 80204 | 4.1% | 2.4%(+1.64)#52 | 2.1%(+2.02)#2,268 |
| 53. | 80907 | 4.1% | 2.4%(+1.61)#53 | 2.1%(+2.00)#2,299 |
| 54. | 80207 | 4.0% | 2.4%(+1.57)#54 | 2.1%(+1.96)#2,351 |
| 55. | 80920 | 4.0% | 2.4%(+1.53)#55 | 2.1%(+1.92)#2,388 |
| 56. | 80136 | 4.0% | 2.4%(+1.53)#56 | 2.1%(+1.91)#2,402 |
| 57. | 80650 | 4.0% | 2.4%(+1.51)#57 | 2.1%(+1.89)#2,426 |
| 58. | 80476 | 3.9% | 2.4%(+1.44)#58 | 2.1%(+1.82)#2,518 |
| 59. | 80740 | 3.8% | 2.4%(+1.40)#59 | 2.1%(+1.79)#2,564 |
| 60. | 80303 | 3.8% | 2.4%(+1.35)#60 | 2.1%(+1.73)#2,630 |
| 61. | 80905 | 3.8% | 2.4%(+1.31)#61 | 2.1%(+1.70)#2,679 |
| 62. | 80206 | 3.7% | 2.4%(+1.30)#62 | 2.1%(+1.69)#2,693 |
| 63. | 80302 | 3.7% | 2.4%(+1.30)#63 | 2.1%(+1.69)#2,700 |
| 64. | 80222 | 3.7% | 2.4%(+1.29)#64 | 2.1%(+1.67)#2,717 |
| 65. | 80452 | 3.7% | 2.4%(+1.28)#65 | 2.1%(+1.67)#2,723 |
| 66. | 81130 | 3.6% | 2.4%(+1.19)#66 | 2.1%(+1.57)#2,859 |
| 67. | 80131 | 3.6% | 2.4%(+1.18)#67 | 2.1%(+1.56)#2,876 |
| 68. | 80238 | 3.6% | 2.4%(+1.17)#68 | 2.1%(+1.55)#2,890 |
| 69. | 81647 | 3.6% | 2.4%(+1.14)#69 | 2.1%(+1.53)#2,930 |
| 70. | 80018 | 3.6% | 2.4%(+1.11)#70 | 2.1%(+1.49)#2,988 |
| 71. | 80863 | 3.5% | 2.4%(+1.10)#71 | 2.1%(+1.49)#3,000 |
| 72. | 81223 | 3.5% | 2.4%(+1.10)#72 | 2.1%(+1.49)#3,004 |
| 73. | 80420 | 3.5% | 2.4%(+1.10)#73 | 2.1%(+1.49)#3,006 |
| 74. | 80924 | 3.5% | 2.4%(+1.07)#74 | 2.1%(+1.45)#3,049 |
| 75. | 80643 | 3.5% | 2.4%(+1.07)#75 | 2.1%(+1.45)#3,051 |
| 76. | 80210 | 3.5% | 2.4%(+1.05)#76 | 2.1%(+1.43)#3,077 |
| 77. | 81435 | 3.5% | 2.4%(+1.05)#77 | 2.1%(+1.43)#3,078 |
| 78. | 81643 | 3.4% | 2.4%(+1.00)#78 | 2.1%(+1.39)#3,138 |
| 79. | 80483 | 3.4% | 2.4%(+0.976)#79 | 2.1%(+1.36)#3,189 |
| 80. | 81235 | 3.4% | 2.4%(+0.948)#80 | 2.1%(+1.33)#3,249 |
| 81. | 81224 | 3.4% | 2.4%(+0.941)#81 | 2.1%(+1.33)#3,265 |
| 82. | 81063 | 3.3% | 2.4%(+0.899)#82 | 2.1%(+1.28)#3,351 |
| 83. | 80005 | 3.3% | 2.4%(+0.870)#83 | 2.1%(+1.26)#3,399 |
| 84. | 80427 | 3.3% | 2.4%(+0.865)#84 | 2.1%(+1.25)#3,404 |
| 85. | 80528 | 3.3% | 2.4%(+0.863)#85 | 2.1%(+1.25)#3,406 |
| 86. | 81225 | 3.3% | 2.4%(+0.815)#86 | 2.1%(+1.20)#3,492 |
| 87. | 81427 | 3.3% | 2.4%(+0.813)#87 | 2.1%(+1.20)#3,494 |
| 88. | 80526 | 3.2% | 2.4%(+0.744)#88 | 2.1%(+1.13)#3,637 |
| 89. | 80918 | 3.2% | 2.4%(+0.742)#89 | 2.1%(+1.13)#3,643 |
| 90. | 80906 | 3.2% | 2.4%(+0.730)#90 | 2.1%(+1.11)#3,672 |
| 91. | 80021 | 3.2% | 2.4%(+0.726)#91 | 2.1%(+1.11)#3,686 |
| 92. | 80525 | 3.2% | 2.4%(+0.715)#92 | 2.1%(+1.10)#3,714 |
| 93. | 81611 | 3.2% | 2.4%(+0.714)#93 | 2.1%(+1.10)#3,717 |
| 94. | 81418 | 3.2% | 2.4%(+0.713)#94 | 2.1%(+1.10)#3,719 |
| 95. | 81422 | 3.1% | 2.4%(+0.679)#95 | 2.1%(+1.06)#3,786 |
| 96. | 80113 | 3.1% | 2.4%(+0.665)#96 | 2.1%(+1.05)#3,821 |
| 97. | 80438 | 3.1% | 2.4%(+0.665)#97 | 2.1%(+1.05)#3,824 |
| 98. | 80120 | 3.1% | 2.4%(+0.651)#98 | 2.1%(+1.04)#3,857 |
| 99. | 80138 | 3.1% | 2.4%(+0.648)#99 | 2.1%(+1.03)#3,864 |
| 100. | 81120 | 3.1% | 2.4%(+0.620)#100 | 2.1%(+1.01)#3,936 |
Common Questions
What are the Top 10 Zip Codes with the Highest Percentage of Population Employed in Arts, Media & Entertainment in Colorado?
Top 10 Zip Codes with the Highest Percentage of Population Employed in Arts, Media & Entertainment in Colorado are:
What zip code has the Highest Percentage of Population Employed in Arts, Media & Entertainment in Colorado?
81236 has the Highest Percentage of Population Employed in Arts, Media & Entertainment in Colorado with 15.2%.
What is the Percentage of Population Employed in Arts, Media & Entertainment in the State of Colorado?
Percentage of Population Employed in Arts, Media & Entertainment in Colorado is 2.4%.
What is the Percentage of Population Employed in Arts, Media & Entertainment in the United States?
Percentage of Population Employed in Arts, Media & Entertainment in the United States is 2.1%.