Zip Codes with the Highest Percentage of Population Employed in Arts, Media & Entertainment in Missouri
RELATED REPORTS & OPTIONS
Arts, Media & Entertainment
Missouri
Compare Zip Codes
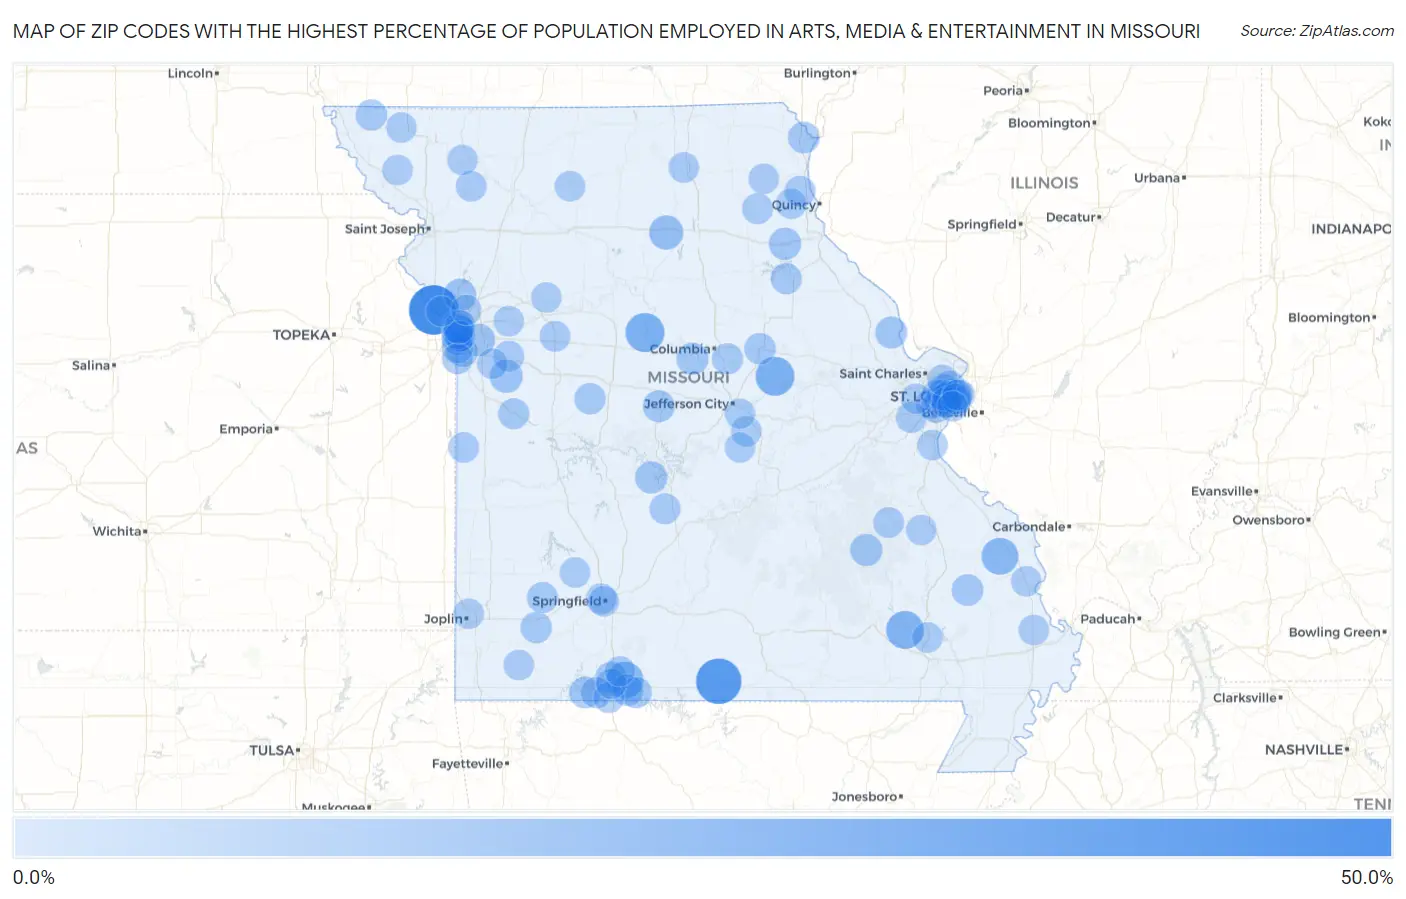
Map of Zip Codes with the Highest Percentage of Population Employed in Arts, Media & Entertainment in Missouri
0.0%
50.0%
Zip Codes with the Highest Percentage of Population Employed in Arts, Media & Entertainment in Missouri
| Zip Code | % Employed | vs State | vs National | |
| 1. | 64092 | 50.0% | 1.7%(+48.3)#1 | 2.1%(+47.9)#13 |
| 2. | 65760 | 39.5% | 1.7%(+37.8)#2 | 2.1%(+37.4)#22 |
| 3. | 65320 | 23.5% | 1.7%(+21.9)#3 | 2.1%(+21.5)#69 |
| 4. | 65077 | 23.2% | 1.7%(+21.5)#4 | 2.1%(+21.1)#70 |
| 5. | 63952 | 20.8% | 1.7%(+19.2)#5 | 2.1%(+18.8)#84 |
| 6. | 63743 | 18.2% | 1.7%(+16.5)#6 | 2.1%(+16.1)#117 |
| 7. | 65731 | 17.9% | 1.7%(+16.3)#7 | 2.1%(+15.9)#118 |
| 8. | 63558 | 11.9% | 1.7%(+10.3)#8 | 2.1%(+9.85)#263 |
| 9. | 64090 | 9.1% | 1.7%(+7.43)#9 | 2.1%(+7.03)#446 |
| 10. | 64165 | 8.0% | 1.7%(+6.34)#10 | 2.1%(+5.94)#554 |
| 11. | 64136 | 7.9% | 1.7%(+6.22)#11 | 2.1%(+5.81)#568 |
| 12. | 64105 | 7.3% | 1.7%(+5.63)#12 | 2.1%(+5.23)#692 |
| 13. | 63625 | 7.2% | 1.7%(+5.55)#13 | 2.1%(+5.15)#709 |
| 14. | 63456 | 7.2% | 1.7%(+5.54)#14 | 2.1%(+5.14)#710 |
| 15. | 65787 | 6.9% | 1.7%(+5.25)#15 | 2.1%(+4.85)#779 |
| 16. | 65287 | 6.5% | 1.7%(+4.87)#16 | 2.1%(+4.46)#873 |
| 17. | 63347 | 6.2% | 1.7%(+4.58)#17 | 2.1%(+4.18)#958 |
| 18. | 65034 | 6.1% | 1.7%(+4.45)#18 | 2.1%(+4.05)#997 |
| 19. | 63102 | 5.8% | 1.7%(+4.19)#19 | 2.1%(+3.78)#1,098 |
| 20. | 63103 | 5.8% | 1.7%(+4.13)#20 | 2.1%(+3.73)#1,120 |
| 21. | 63430 | 5.8% | 1.7%(+4.11)#21 | 2.1%(+3.71)#1,130 |
| 22. | 65616 | 5.6% | 1.7%(+3.98)#22 | 2.1%(+3.57)#1,179 |
| 23. | 64106 | 5.6% | 1.7%(+3.95)#23 | 2.1%(+3.54)#1,195 |
| 24. | 65681 | 5.3% | 1.7%(+3.65)#24 | 2.1%(+3.25)#1,346 |
| 25. | 63751 | 5.3% | 1.7%(+3.61)#25 | 2.1%(+3.20)#1,363 |
| 26. | 63130 | 5.2% | 1.7%(+3.57)#26 | 2.1%(+3.17)#1,384 |
| 27. | 65262 | 5.2% | 1.7%(+3.54)#27 | 2.1%(+3.13)#1,404 |
| 28. | 65679 | 5.1% | 1.7%(+3.41)#28 | 2.1%(+3.00)#1,465 |
| 29. | 64109 | 5.0% | 1.7%(+3.39)#29 | 2.1%(+2.98)#1,473 |
| 30. | 65654 | 5.0% | 1.7%(+3.34)#30 | 2.1%(+2.94)#1,502 |
| 31. | 64498 | 4.9% | 1.7%(+3.28)#31 | 2.1%(+2.88)#1,537 |
| 32. | 65332 | 4.9% | 1.7%(+3.26)#32 | 2.1%(+2.85)#1,552 |
| 33. | 63118 | 4.8% | 1.7%(+3.12)#33 | 2.1%(+2.71)#1,641 |
| 34. | 64112 | 4.6% | 1.7%(+2.95)#34 | 2.1%(+2.55)#1,772 |
| 35. | 65627 | 4.6% | 1.7%(+2.93)#35 | 2.1%(+2.52)#1,792 |
| 36. | 64137 | 4.5% | 1.7%(+2.84)#36 | 2.1%(+2.43)#1,858 |
| 37. | 64114 | 4.5% | 1.7%(+2.83)#37 | 2.1%(+2.42)#1,865 |
| 38. | 63462 | 4.4% | 1.7%(+2.73)#38 | 2.1%(+2.33)#1,949 |
| 39. | 65201 | 4.3% | 1.7%(+2.66)#39 | 2.1%(+2.26)#2,019 |
| 40. | 65611 | 4.2% | 1.7%(+2.58)#40 | 2.1%(+2.17)#2,114 |
| 41. | 65707 | 4.2% | 1.7%(+2.57)#41 | 2.1%(+2.17)#2,120 |
| 42. | 64113 | 4.2% | 1.7%(+2.50)#42 | 2.1%(+2.10)#2,181 |
| 43. | 64739 | 4.1% | 1.7%(+2.45)#43 | 2.1%(+2.05)#2,245 |
| 44. | 63122 | 4.0% | 1.7%(+2.36)#44 | 2.1%(+1.95)#2,358 |
| 45. | 63120 | 4.0% | 1.7%(+2.32)#45 | 2.1%(+1.92)#2,390 |
| 46. | 64070 | 4.0% | 1.7%(+2.31)#46 | 2.1%(+1.91)#2,408 |
| 47. | 65463 | 4.0% | 1.7%(+2.31)#47 | 2.1%(+1.91)#2,413 |
| 48. | 63124 | 4.0% | 1.7%(+2.30)#48 | 2.1%(+1.90)#2,423 |
| 49. | 63448 | 4.0% | 1.7%(+2.30)#49 | 2.1%(+1.89)#2,427 |
| 50. | 63434 | 3.9% | 1.7%(+2.20)#50 | 2.1%(+1.80)#2,545 |
| 51. | 63108 | 3.8% | 1.7%(+2.18)#51 | 2.1%(+1.78)#2,567 |
| 52. | 63139 | 3.8% | 1.7%(+2.18)#52 | 2.1%(+1.78)#2,574 |
| 53. | 65739 | 3.8% | 1.7%(+2.16)#53 | 2.1%(+1.76)#2,600 |
| 54. | 63119 | 3.8% | 1.7%(+2.14)#54 | 2.1%(+1.74)#2,626 |
| 55. | 63143 | 3.7% | 1.7%(+2.08)#55 | 2.1%(+1.67)#2,715 |
| 56. | 63126 | 3.7% | 1.7%(+2.06)#56 | 2.1%(+1.65)#2,750 |
| 57. | 64111 | 3.7% | 1.7%(+2.00)#57 | 2.1%(+1.59)#2,828 |
| 58. | 63110 | 3.6% | 1.7%(+1.97)#58 | 2.1%(+1.57)#2,863 |
| 59. | 63117 | 3.6% | 1.7%(+1.96)#59 | 2.1%(+1.55)#2,886 |
| 60. | 64037 | 3.6% | 1.7%(+1.95)#60 | 2.1%(+1.55)#2,899 |
| 61. | 64110 | 3.6% | 1.7%(+1.92)#61 | 2.1%(+1.51)#2,954 |
| 62. | 64108 | 3.5% | 1.7%(+1.85)#62 | 2.1%(+1.45)#3,058 |
| 63. | 63109 | 3.5% | 1.7%(+1.82)#63 | 2.1%(+1.41)#3,105 |
| 64. | 63140 | 3.4% | 1.7%(+1.77)#64 | 2.1%(+1.37)#3,174 |
| 65. | 65802 | 3.4% | 1.7%(+1.77)#65 | 2.1%(+1.36)#3,182 |
| 66. | 64145 | 3.4% | 1.7%(+1.76)#66 | 2.1%(+1.35)#3,214 |
| 67. | 63104 | 3.4% | 1.7%(+1.75)#67 | 2.1%(+1.34)#3,240 |
| 68. | 63101 | 3.4% | 1.7%(+1.72)#68 | 2.1%(+1.32)#3,276 |
| 69. | 63025 | 3.4% | 1.7%(+1.70)#69 | 2.1%(+1.30)#3,331 |
| 70. | 64463 | 3.3% | 1.7%(+1.69)#70 | 2.1%(+1.29)#3,345 |
| 71. | 63631 | 3.3% | 1.7%(+1.62)#71 | 2.1%(+1.21)#3,471 |
| 72. | 63454 | 3.2% | 1.7%(+1.58)#72 | 2.1%(+1.18)#3,536 |
| 73. | 64722 | 3.2% | 1.7%(+1.57)#73 | 2.1%(+1.16)#3,557 |
| 74. | 65085 | 3.2% | 1.7%(+1.54)#74 | 2.1%(+1.14)#3,617 |
| 75. | 63501 | 3.2% | 1.7%(+1.49)#75 | 2.1%(+1.09)#3,730 |
| 76. | 64066 | 3.1% | 1.7%(+1.47)#76 | 2.1%(+1.06)#3,787 |
| 77. | 64428 | 3.1% | 1.7%(+1.46)#77 | 2.1%(+1.05)#3,815 |
| 78. | 64466 | 3.1% | 1.7%(+1.40)#78 | 2.1%(+0.996)#3,956 |
| 79. | 63447 | 3.0% | 1.7%(+1.34)#79 | 2.1%(+0.936)#4,080 |
| 80. | 65806 | 3.0% | 1.7%(+1.33)#80 | 2.1%(+0.929)#4,108 |
| 81. | 64874 | 3.0% | 1.7%(+1.31)#81 | 2.1%(+0.905)#4,166 |
| 82. | 64034 | 3.0% | 1.7%(+1.30)#82 | 2.1%(+0.893)#4,197 |
| 83. | 64152 | 2.9% | 1.7%(+1.28)#83 | 2.1%(+0.871)#4,255 |
| 84. | 63011 | 2.9% | 1.7%(+1.27)#84 | 2.1%(+0.862)#4,278 |
| 85. | 63967 | 2.9% | 1.7%(+1.26)#85 | 2.1%(+0.860)#4,285 |
| 86. | 64683 | 2.9% | 1.7%(+1.26)#86 | 2.1%(+0.859)#4,287 |
| 87. | 63070 | 2.9% | 1.7%(+1.26)#87 | 2.1%(+0.854)#4,308 |
| 88. | 63111 | 2.9% | 1.7%(+1.22)#88 | 2.1%(+0.812)#4,416 |
| 89. | 65726 | 2.8% | 1.7%(+1.14)#89 | 2.1%(+0.740)#4,617 |
| 90. | 64489 | 2.8% | 1.7%(+1.14)#90 | 2.1%(+0.732)#4,639 |
| 91. | 65058 | 2.8% | 1.7%(+1.12)#91 | 2.1%(+0.711)#4,691 |
| 92. | 65740 | 2.8% | 1.7%(+1.11)#92 | 2.1%(+0.708)#4,702 |
| 93. | 64801 | 2.7% | 1.7%(+1.07)#93 | 2.1%(+0.666)#4,828 |
| 94. | 65770 | 2.7% | 1.7%(+1.07)#94 | 2.1%(+0.663)#4,842 |
| 95. | 63824 | 2.7% | 1.7%(+1.05)#95 | 2.1%(+0.642)#4,900 |
| 96. | 63637 | 2.7% | 1.7%(+1.04)#96 | 2.1%(+0.635)#4,928 |
| 97. | 65101 | 2.7% | 1.7%(+1.00)#97 | 2.1%(+0.598)#5,036 |
| 98. | 63701 | 2.7% | 1.7%(+0.995)#98 | 2.1%(+0.591)#5,055 |
| 99. | 64035 | 2.7% | 1.7%(+0.995)#99 | 2.1%(+0.591)#5,058 |
| 100. | 64119 | 2.7% | 1.7%(+0.994)#100 | 2.1%(+0.590)#5,061 |
Common Questions
What are the Top 10 Zip Codes with the Highest Percentage of Population Employed in Arts, Media & Entertainment in Missouri?
Top 10 Zip Codes with the Highest Percentage of Population Employed in Arts, Media & Entertainment in Missouri are:
What zip code has the Highest Percentage of Population Employed in Arts, Media & Entertainment in Missouri?
64092 has the Highest Percentage of Population Employed in Arts, Media & Entertainment in Missouri with 50.0%.
What is the Percentage of Population Employed in Arts, Media & Entertainment in the State of Missouri?
Percentage of Population Employed in Arts, Media & Entertainment in Missouri is 1.7%.
What is the Percentage of Population Employed in Arts, Media & Entertainment in the United States?
Percentage of Population Employed in Arts, Media & Entertainment in the United States is 2.1%.