Zip Codes with the Highest Percentage of Population Employed in Arts, Media & Entertainment in Rhode Island
RELATED REPORTS & OPTIONS
Arts, Media & Entertainment
Rhode Island
Compare Zip Codes
Map of Zip Codes with the Highest Percentage of Population Employed in Arts, Media & Entertainment in Rhode Island
0.0%
60.0%
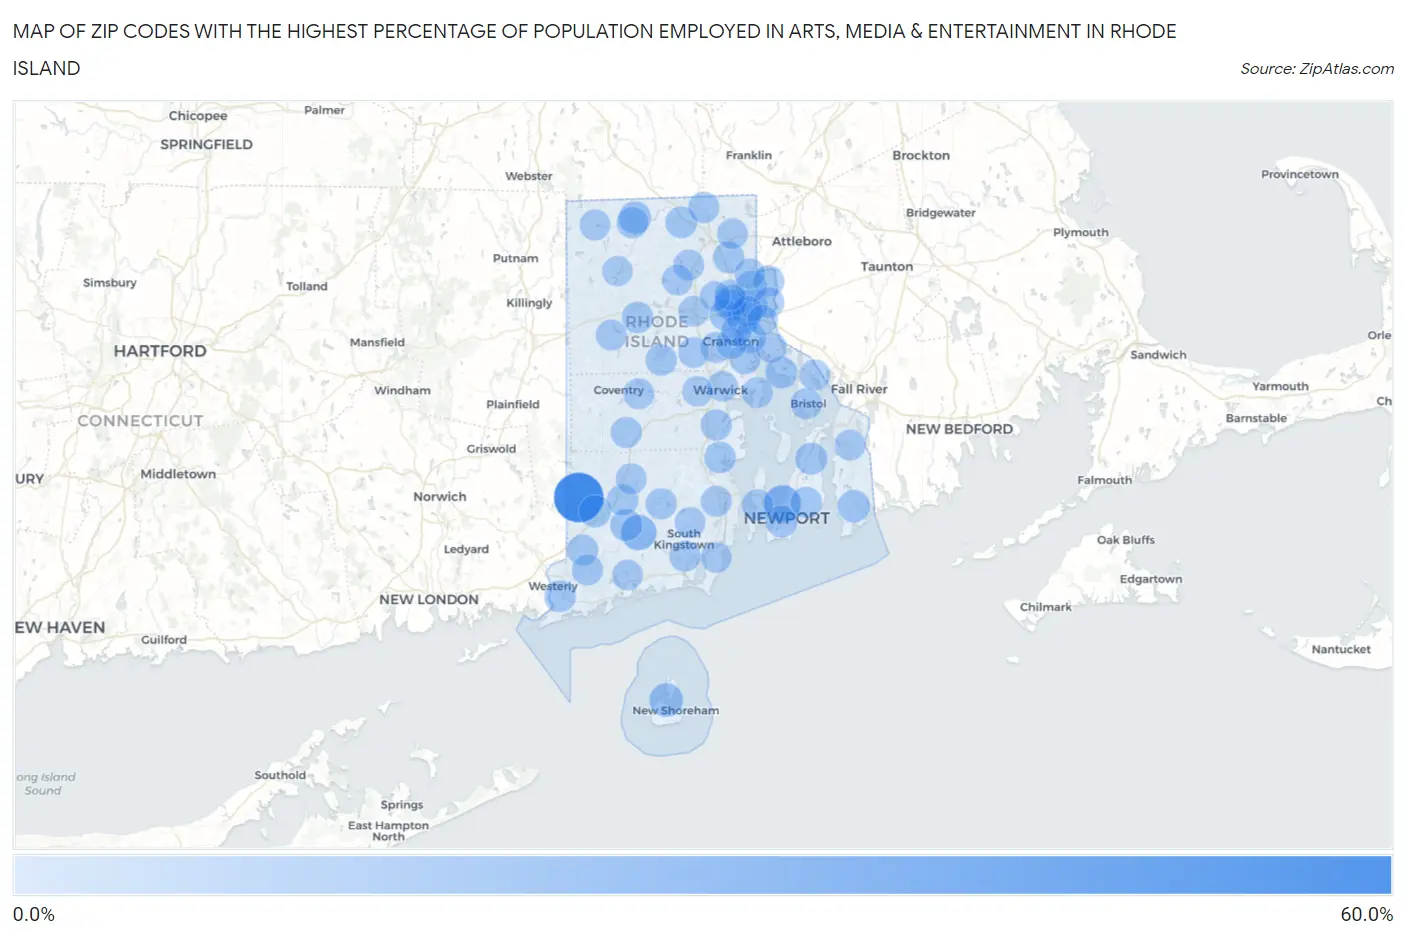
Zip Codes with the Highest Percentage of Population Employed in Arts, Media & Entertainment in Rhode Island
| Zip Code | % Employed | vs State | vs National | |
| 1. | 02873 | 57.1% | 2.4%(+54.8)#1 | 2.1%(+55.1)#7 |
| 2. | 02841 | 19.3% | 2.4%(+16.9)#2 | 2.1%(+17.2)#105 |
| 3. | 02875 | 14.6% | 2.4%(+12.2)#3 | 2.1%(+12.5)#177 |
| 4. | 02807 | 9.9% | 2.4%(+7.55)#4 | 2.1%(+7.85)#381 |
| 5. | 02903 | 8.3% | 2.4%(+5.97)#5 | 2.1%(+6.26)#515 |
| 6. | 02918 | 7.0% | 2.4%(+4.67)#6 | 2.1%(+4.96)#761 |
| 7. | 02837 | 6.4% | 2.4%(+4.04)#7 | 2.1%(+4.34)#899 |
| 8. | 02906 | 6.1% | 2.4%(+3.71)#8 | 2.1%(+4.00)#1,012 |
| 9. | 02826 | 5.9% | 2.4%(+3.53)#9 | 2.1%(+3.82)#1,086 |
| 10. | 02832 | 5.3% | 2.4%(+2.97)#10 | 2.1%(+3.27)#1,334 |
| 11. | 02871 | 4.8% | 2.4%(+2.49)#11 | 2.1%(+2.79)#1,584 |
| 12. | 02812 | 4.6% | 2.4%(+2.22)#12 | 2.1%(+2.51)#1,799 |
| 13. | 02806 | 4.3% | 2.4%(+1.94)#13 | 2.1%(+2.23)#2,050 |
| 14. | 02896 | 4.2% | 2.4%(+1.86)#14 | 2.1%(+2.15)#2,139 |
| 15. | 02891 | 4.1% | 2.4%(+1.73)#15 | 2.1%(+2.03)#2,263 |
| 16. | 02840 | 4.0% | 2.4%(+1.61)#16 | 2.1%(+1.91)#2,410 |
| 17. | 02830 | 3.7% | 2.4%(+1.37)#17 | 2.1%(+1.66)#2,733 |
| 18. | 02852 | 3.4% | 2.4%(+1.00)#18 | 2.1%(+1.30)#3,334 |
| 19. | 02865 | 3.3% | 2.4%(+0.931)#19 | 2.1%(+1.23)#3,448 |
| 20. | 02831 | 3.2% | 2.4%(+0.866)#20 | 2.1%(+1.16)#3,570 |
| 21. | 02857 | 3.1% | 2.4%(+0.768)#21 | 2.1%(+1.06)#3,790 |
| 22. | 02905 | 3.1% | 2.4%(+0.744)#22 | 2.1%(+1.04)#3,854 |
| 23. | 02835 | 3.1% | 2.4%(+0.738)#23 | 2.1%(+1.03)#3,867 |
| 24. | 02908 | 3.1% | 2.4%(+0.736)#24 | 2.1%(+1.03)#3,871 |
| 25. | 02842 | 3.1% | 2.4%(+0.712)#25 | 2.1%(+1.01)#3,931 |
| 26. | 02898 | 3.0% | 2.4%(+0.692)#26 | 2.1%(+0.986)#3,981 |
| 27. | 02818 | 3.0% | 2.4%(+0.599)#27 | 2.1%(+0.893)#4,198 |
| 28. | 02920 | 2.8% | 2.4%(+0.441)#28 | 2.1%(+0.735)#4,629 |
| 29. | 02895 | 2.8% | 2.4%(+0.418)#29 | 2.1%(+0.712)#4,689 |
| 30. | 02804 | 2.7% | 2.4%(+0.358)#30 | 2.1%(+0.652)#4,869 |
| 31. | 02879 | 2.5% | 2.4%(+0.182)#31 | 2.1%(+0.476)#5,432 |
| 32. | 02892 | 2.5% | 2.4%(+0.098)#32 | 2.1%(+0.393)#5,714 |
| 33. | 02888 | 2.4% | 2.4%(+0.016)#33 | 2.1%(+0.310)#6,050 |
| 34. | 02809 | 2.3% | 2.4%(-0.043)#34 | 2.1%(+0.251)#6,329 |
| 35. | 02860 | 2.3% | 2.4%(-0.048)#35 | 2.1%(+0.246)#6,354 |
| 36. | 02909 | 2.3% | 2.4%(-0.083)#36 | 2.1%(+0.211)#6,502 |
| 37. | 02808 | 2.2% | 2.4%(-0.124)#37 | 2.1%(+0.170)#6,683 |
| 38. | 02861 | 2.2% | 2.4%(-0.151)#38 | 2.1%(+0.143)#6,803 |
| 39. | 02817 | 2.2% | 2.4%(-0.201)#39 | 2.1%(+0.093)#7,034 |
| 40. | 02825 | 1.9% | 2.4%(-0.456)#40 | 2.1%(-0.162)#8,385 |
| 41. | 02816 | 1.8% | 2.4%(-0.570)#41 | 2.1%(-0.275)#9,065 |
| 42. | 02917 | 1.8% | 2.4%(-0.578)#42 | 2.1%(-0.284)#9,112 |
| 43. | 02822 | 1.8% | 2.4%(-0.583)#43 | 2.1%(-0.289)#9,138 |
| 44. | 02889 | 1.7% | 2.4%(-0.626)#44 | 2.1%(-0.332)#9,412 |
| 45. | 02859 | 1.7% | 2.4%(-0.633)#45 | 2.1%(-0.339)#9,448 |
| 46. | 02916 | 1.7% | 2.4%(-0.663)#46 | 2.1%(-0.368)#9,684 |
| 47. | 02878 | 1.7% | 2.4%(-0.690)#47 | 2.1%(-0.396)#9,894 |
| 48. | 02828 | 1.6% | 2.4%(-0.708)#48 | 2.1%(-0.414)#10,018 |
| 49. | 02910 | 1.6% | 2.4%(-0.793)#49 | 2.1%(-0.498)#10,563 |
| 50. | 02915 | 1.6% | 2.4%(-0.796)#50 | 2.1%(-0.502)#10,593 |
| 51. | 02874 | 1.5% | 2.4%(-0.852)#51 | 2.1%(-0.558)#10,967 |
| 52. | 02885 | 1.5% | 2.4%(-0.872)#52 | 2.1%(-0.577)#11,081 |
| 53. | 02864 | 1.5% | 2.4%(-0.883)#53 | 2.1%(-0.589)#11,166 |
| 54. | 02882 | 1.4% | 2.4%(-0.912)#54 | 2.1%(-0.618)#11,394 |
| 55. | 02912 | 1.4% | 2.4%(-0.954)#55 | 2.1%(-0.660)#11,708 |
| 56. | 02921 | 1.4% | 2.4%(-0.987)#56 | 2.1%(-0.692)#11,930 |
| 57. | 02904 | 1.2% | 2.4%(-1.15)#57 | 2.1%(-0.852)#13,151 |
| 58. | 02919 | 1.1% | 2.4%(-1.28)#58 | 2.1%(-0.981)#14,162 |
| 59. | 02813 | 1.0% | 2.4%(-1.31)#59 | 2.1%(-1.01)#14,422 |
| 60. | 02881 | 0.94% | 2.4%(-1.42)#60 | 2.1%(-1.12)#15,337 |
| 61. | 02907 | 0.90% | 2.4%(-1.45)#61 | 2.1%(-1.16)#15,623 |
| 62. | 02886 | 0.89% | 2.4%(-1.47)#62 | 2.1%(-1.18)#15,767 |
| 63. | 02893 | 0.75% | 2.4%(-1.60)#63 | 2.1%(-1.31)#16,813 |
| 64. | 02863 | 0.72% | 2.4%(-1.63)#64 | 2.1%(-1.34)#17,032 |
| 65. | 02911 | 0.39% | 2.4%(-1.97)#65 | 2.1%(-1.67)#19,722 |
| 66. | 02814 | 0.32% | 2.4%(-2.03)#66 | 2.1%(-1.74)#20,190 |
| 67. | 02914 | 0.25% | 2.4%(-2.10)#67 | 2.1%(-1.81)#20,670 |
1
Common Questions
What are the Top 10 Zip Codes with the Highest Percentage of Population Employed in Arts, Media & Entertainment in Rhode Island?
Top 10 Zip Codes with the Highest Percentage of Population Employed in Arts, Media & Entertainment in Rhode Island are:
What zip code has the Highest Percentage of Population Employed in Arts, Media & Entertainment in Rhode Island?
02873 has the Highest Percentage of Population Employed in Arts, Media & Entertainment in Rhode Island with 57.1%.
What is the Percentage of Population Employed in Arts, Media & Entertainment in the State of Rhode Island?
Percentage of Population Employed in Arts, Media & Entertainment in Rhode Island is 2.4%.
What is the Percentage of Population Employed in Arts, Media & Entertainment in the United States?
Percentage of Population Employed in Arts, Media & Entertainment in the United States is 2.1%.