Zip Codes with the Highest Percentage of Population Employed in Arts, Media & Entertainment in Oklahoma
RELATED REPORTS & OPTIONS
Arts, Media & Entertainment
Oklahoma
Compare Zip Codes
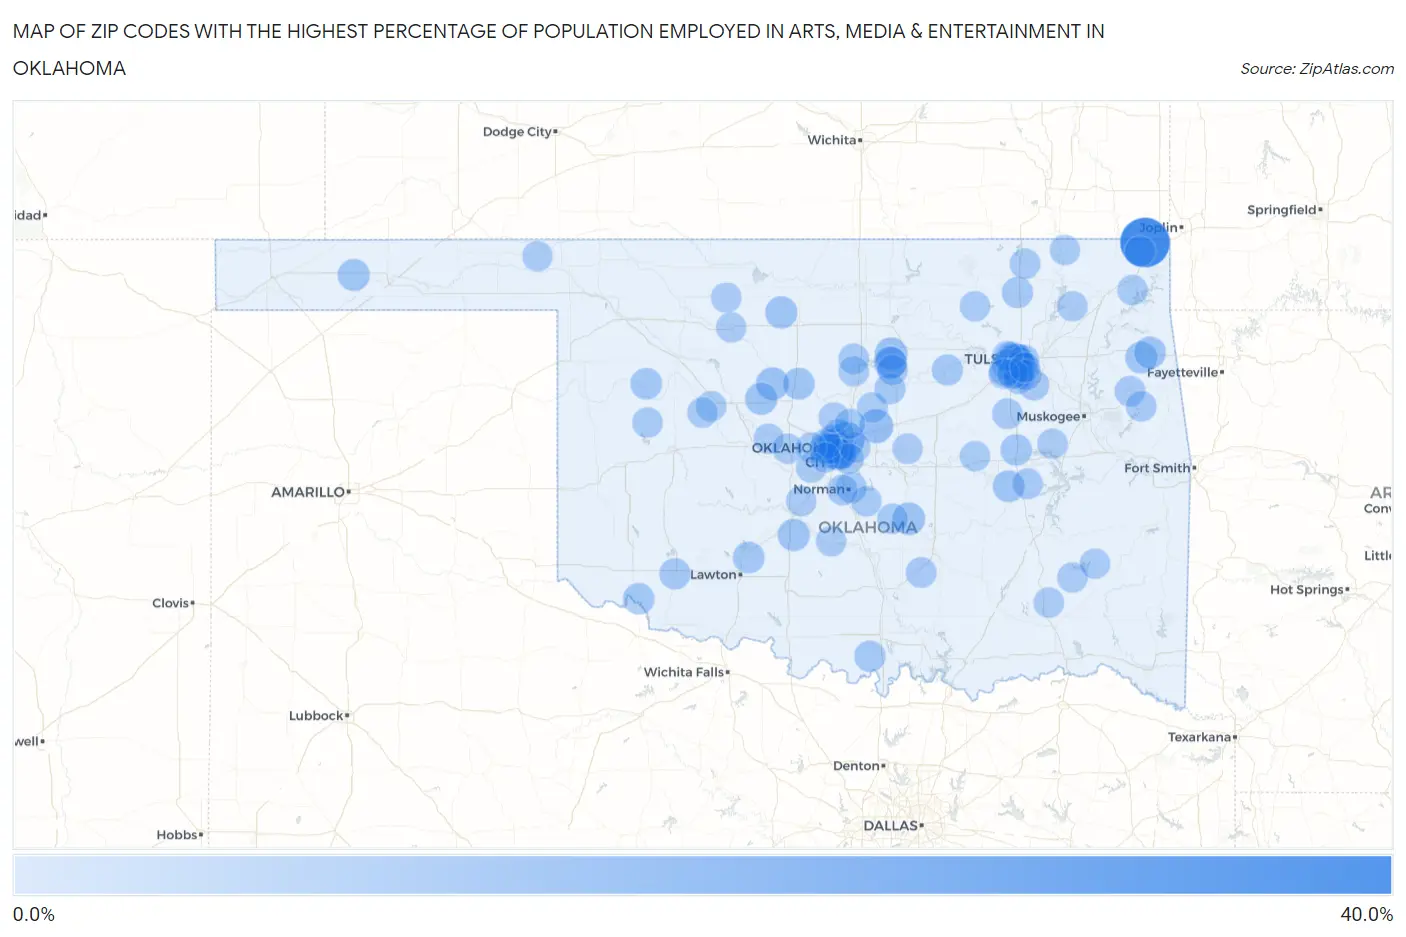
Map of Zip Codes with the Highest Percentage of Population Employed in Arts, Media & Entertainment in Oklahoma
0.0%
40.0%
Zip Codes with the Highest Percentage of Population Employed in Arts, Media & Entertainment in Oklahoma
| Zip Code | % Employed | vs State | vs National | |
| 1. | 74360 | 37.5% | 1.4%(+36.1)#1 | 2.1%(+35.4)#27 |
| 2. | 73131 | 12.8% | 1.4%(+11.3)#2 | 2.1%(+10.7)#224 |
| 3. | 73054 | 8.5% | 1.4%(+7.03)#3 | 2.1%(+6.40)#495 |
| 4. | 74103 | 8.0% | 1.4%(+6.62)#4 | 2.1%(+5.99)#547 |
| 5. | 74119 | 7.7% | 1.4%(+6.29)#5 | 2.1%(+5.66)#593 |
| 6. | 74120 | 7.4% | 1.4%(+5.97)#6 | 2.1%(+5.34)#668 |
| 7. | 73756 | 6.3% | 1.4%(+4.86)#7 | 2.1%(+4.23)#931 |
| 8. | 73103 | 6.1% | 1.4%(+4.64)#8 | 2.1%(+4.01)#1,009 |
| 9. | 74826 | 6.0% | 1.4%(+4.59)#9 | 2.1%(+3.96)#1,022 |
| 10. | 74075 | 5.9% | 1.4%(+4.48)#10 | 2.1%(+3.85)#1,073 |
| 11. | 74078 | 5.6% | 1.4%(+4.20)#11 | 2.1%(+3.57)#1,181 |
| 12. | 73764 | 5.3% | 1.4%(+3.83)#12 | 2.1%(+3.20)#1,365 |
| 13. | 73727 | 5.1% | 1.4%(+3.66)#13 | 2.1%(+3.02)#1,457 |
| 14. | 73067 | 4.9% | 1.4%(+3.51)#14 | 2.1%(+2.88)#1,532 |
| 15. | 73939 | 4.6% | 1.4%(+3.20)#15 | 2.1%(+2.56)#1,753 |
| 16. | 74359 | 4.5% | 1.4%(+3.12)#16 | 2.1%(+2.48)#1,815 |
| 17. | 74104 | 4.5% | 1.4%(+3.03)#17 | 2.1%(+2.40)#1,886 |
| 18. | 74347 | 4.4% | 1.4%(+2.96)#18 | 2.1%(+2.33)#1,947 |
| 19. | 74839 | 4.3% | 1.4%(+2.92)#19 | 2.1%(+2.29)#1,985 |
| 20. | 73734 | 4.3% | 1.4%(+2.92)#20 | 2.1%(+2.29)#1,986 |
| 21. | 73105 | 4.3% | 1.4%(+2.89)#21 | 2.1%(+2.26)#2,017 |
| 22. | 73118 | 4.2% | 1.4%(+2.77)#22 | 2.1%(+2.14)#2,149 |
| 23. | 73538 | 4.1% | 1.4%(+2.67)#23 | 2.1%(+2.04)#2,254 |
| 24. | 73835 | 4.1% | 1.4%(+2.64)#24 | 2.1%(+2.00)#2,290 |
| 25. | 74077 | 4.0% | 1.4%(+2.54)#25 | 2.1%(+1.91)#2,415 |
| 26. | 74171 | 3.9% | 1.4%(+2.52)#26 | 2.1%(+1.89)#2,433 |
| 27. | 73539 | 3.8% | 1.4%(+2.37)#27 | 2.1%(+1.74)#2,628 |
| 28. | 73013 | 3.8% | 1.4%(+2.33)#28 | 2.1%(+1.70)#2,675 |
| 29. | 74460 | 3.7% | 1.4%(+2.27)#29 | 2.1%(+1.64)#2,766 |
| 30. | 74050 | 3.6% | 1.4%(+2.21)#30 | 2.1%(+1.58)#2,854 |
| 31. | 73453 | 3.3% | 1.4%(+1.90)#31 | 2.1%(+1.27)#3,375 |
| 32. | 74051 | 3.3% | 1.4%(+1.86)#32 | 2.1%(+1.23)#3,437 |
| 33. | 74105 | 3.2% | 1.4%(+1.75)#33 | 2.1%(+1.11)#3,673 |
| 34. | 73102 | 3.2% | 1.4%(+1.74)#34 | 2.1%(+1.11)#3,698 |
| 35. | 73566 | 3.1% | 1.4%(+1.67)#35 | 2.1%(+1.04)#3,848 |
| 36. | 74107 | 3.0% | 1.4%(+1.57)#36 | 2.1%(+0.940)#4,073 |
| 37. | 74052 | 3.0% | 1.4%(+1.57)#37 | 2.1%(+0.936)#4,081 |
| 38. | 73071 | 2.9% | 1.4%(+1.49)#38 | 2.1%(+0.857)#4,297 |
| 39. | 73008 | 2.9% | 1.4%(+1.48)#39 | 2.1%(+0.848)#4,327 |
| 40. | 74059 | 2.8% | 1.4%(+1.41)#40 | 2.1%(+0.782)#4,493 |
| 41. | 73116 | 2.8% | 1.4%(+1.37)#41 | 2.1%(+0.743)#4,604 |
| 42. | 73120 | 2.7% | 1.4%(+1.31)#42 | 2.1%(+0.675)#4,806 |
| 43. | 74114 | 2.7% | 1.4%(+1.29)#43 | 2.1%(+0.659)#4,853 |
| 44. | 74011 | 2.7% | 1.4%(+1.26)#44 | 2.1%(+0.633)#4,934 |
| 45. | 74135 | 2.7% | 1.4%(+1.26)#45 | 2.1%(+0.624)#4,956 |
| 46. | 73058 | 2.6% | 1.4%(+1.20)#46 | 2.1%(+0.571)#5,139 |
| 47. | 73106 | 2.6% | 1.4%(+1.19)#47 | 2.1%(+0.558)#5,167 |
| 48. | 73107 | 2.6% | 1.4%(+1.14)#48 | 2.1%(+0.510)#5,328 |
| 49. | 74112 | 2.5% | 1.4%(+1.05)#49 | 2.1%(+0.418)#5,625 |
| 50. | 73104 | 2.5% | 1.4%(+1.04)#50 | 2.1%(+0.412)#5,643 |
| 51. | 74865 | 2.5% | 1.4%(+1.02)#51 | 2.1%(+0.390)#5,733 |
| 52. | 74358 | 2.4% | 1.4%(+0.923)#52 | 2.1%(+0.292)#6,121 |
| 53. | 73112 | 2.3% | 1.4%(+0.865)#53 | 2.1%(+0.234)#6,398 |
| 54. | 73073 | 2.3% | 1.4%(+0.853)#54 | 2.1%(+0.222)#6,451 |
| 55. | 74136 | 2.3% | 1.4%(+0.839)#55 | 2.1%(+0.207)#6,517 |
| 56. | 74074 | 2.3% | 1.4%(+0.834)#56 | 2.1%(+0.203)#6,538 |
| 57. | 74029 | 2.3% | 1.4%(+0.825)#57 | 2.1%(+0.194)#6,582 |
| 58. | 73122 | 2.3% | 1.4%(+0.821)#58 | 2.1%(+0.190)#6,602 |
| 59. | 74845 | 2.2% | 1.4%(+0.809)#59 | 2.1%(+0.178)#6,652 |
| 60. | 74137 | 2.2% | 1.4%(+0.805)#60 | 2.1%(+0.174)#6,667 |
| 61. | 74127 | 2.2% | 1.4%(+0.740)#61 | 2.1%(+0.109)#6,959 |
| 62. | 73141 | 2.2% | 1.4%(+0.738)#62 | 2.1%(+0.107)#6,969 |
| 63. | 73068 | 2.2% | 1.4%(+0.735)#63 | 2.1%(+0.104)#6,978 |
| 64. | 74464 | 2.2% | 1.4%(+0.727)#64 | 2.1%(+0.096)#7,020 |
| 65. | 74471 | 2.1% | 1.4%(+0.702)#65 | 2.1%(+0.071)#7,116 |
| 66. | 74878 | 2.1% | 1.4%(+0.698)#66 | 2.1%(+0.067)#7,131 |
| 67. | 74133 | 2.1% | 1.4%(+0.695)#67 | 2.1%(+0.064)#7,148 |
| 68. | 74132 | 2.1% | 1.4%(+0.680)#68 | 2.1%(+0.049)#7,213 |
| 69. | 74421 | 2.1% | 1.4%(+0.651)#69 | 2.1%(+0.020)#7,380 |
| 70. | 73072 | 2.1% | 1.4%(+0.639)#70 | 2.1%(+0.008)#7,444 |
| 71. | 73625 | 2.1% | 1.4%(+0.632)#71 | 2.1%(+0.001)#7,482 |
| 72. | 73063 | 2.1% | 1.4%(+0.622)#72 | 2.1%(-0.010)#7,538 |
| 73. | 73646 | 2.0% | 1.4%(+0.611)#73 | 2.1%(-0.020)#7,603 |
| 74. | 74557 | 2.0% | 1.4%(+0.590)#74 | 2.1%(-0.041)#7,711 |
| 75. | 74536 | 2.0% | 1.4%(+0.581)#75 | 2.1%(-0.050)#7,756 |
| 76. | 73052 | 2.0% | 1.4%(+0.575)#76 | 2.1%(-0.057)#7,800 |
| 77. | 73669 | 2.0% | 1.4%(+0.567)#77 | 2.1%(-0.064)#7,827 |
| 78. | 74859 | 2.0% | 1.4%(+0.565)#78 | 2.1%(-0.066)#7,839 |
| 79. | 73115 | 2.0% | 1.4%(+0.560)#79 | 2.1%(-0.071)#7,865 |
| 80. | 73132 | 2.0% | 1.4%(+0.544)#80 | 2.1%(-0.087)#7,954 |
| 81. | 73726 | 2.0% | 1.4%(+0.531)#81 | 2.1%(-0.100)#8,025 |
| 82. | 73004 | 1.9% | 1.4%(+0.489)#82 | 2.1%(-0.142)#8,266 |
| 83. | 74331 | 1.9% | 1.4%(+0.466)#83 | 2.1%(-0.165)#8,407 |
| 84. | 74855 | 1.9% | 1.4%(+0.423)#84 | 2.1%(-0.208)#8,656 |
| 85. | 73099 | 1.8% | 1.4%(+0.411)#85 | 2.1%(-0.221)#8,731 |
| 86. | 73025 | 1.8% | 1.4%(+0.382)#86 | 2.1%(-0.249)#8,913 |
| 87. | 74131 | 1.8% | 1.4%(+0.368)#87 | 2.1%(-0.263)#8,989 |
| 88. | 74428 | 1.8% | 1.4%(+0.335)#88 | 2.1%(-0.296)#9,187 |
| 89. | 73844 | 1.7% | 1.4%(+0.317)#89 | 2.1%(-0.314)#9,289 |
| 90. | 74016 | 1.7% | 1.4%(+0.317)#90 | 2.1%(-0.315)#9,292 |
| 91. | 73729 | 1.7% | 1.4%(+0.309)#91 | 2.1%(-0.322)#9,342 |
| 92. | 74084 | 1.7% | 1.4%(+0.304)#92 | 2.1%(-0.327)#9,377 |
| 93. | 73064 | 1.7% | 1.4%(+0.303)#93 | 2.1%(-0.328)#9,387 |
| 94. | 73036 | 1.7% | 1.4%(+0.302)#94 | 2.1%(-0.329)#9,392 |
| 95. | 73128 | 1.7% | 1.4%(+0.297)#95 | 2.1%(-0.334)#9,425 |
| 96. | 73034 | 1.7% | 1.4%(+0.296)#96 | 2.1%(-0.335)#9,431 |
| 97. | 73014 | 1.7% | 1.4%(+0.286)#97 | 2.1%(-0.346)#9,500 |
| 98. | 74145 | 1.7% | 1.4%(+0.279)#98 | 2.1%(-0.353)#9,560 |
| 99. | 74574 | 1.7% | 1.4%(+0.273)#99 | 2.1%(-0.358)#9,595 |
| 100. | 74072 | 1.7% | 1.4%(+0.268)#100 | 2.1%(-0.364)#9,644 |
Common Questions
What are the Top 10 Zip Codes with the Highest Percentage of Population Employed in Arts, Media & Entertainment in Oklahoma?
Top 10 Zip Codes with the Highest Percentage of Population Employed in Arts, Media & Entertainment in Oklahoma are:
What zip code has the Highest Percentage of Population Employed in Arts, Media & Entertainment in Oklahoma?
74360 has the Highest Percentage of Population Employed in Arts, Media & Entertainment in Oklahoma with 37.5%.
What is the Percentage of Population Employed in Arts, Media & Entertainment in the State of Oklahoma?
Percentage of Population Employed in Arts, Media & Entertainment in Oklahoma is 1.4%.
What is the Percentage of Population Employed in Arts, Media & Entertainment in the United States?
Percentage of Population Employed in Arts, Media & Entertainment in the United States is 2.1%.