Zip Codes with the Highest Percentage of Population Employed in Arts, Media & Entertainment in Minnesota
RELATED REPORTS & OPTIONS
Arts, Media & Entertainment
Minnesota
Compare Zip Codes
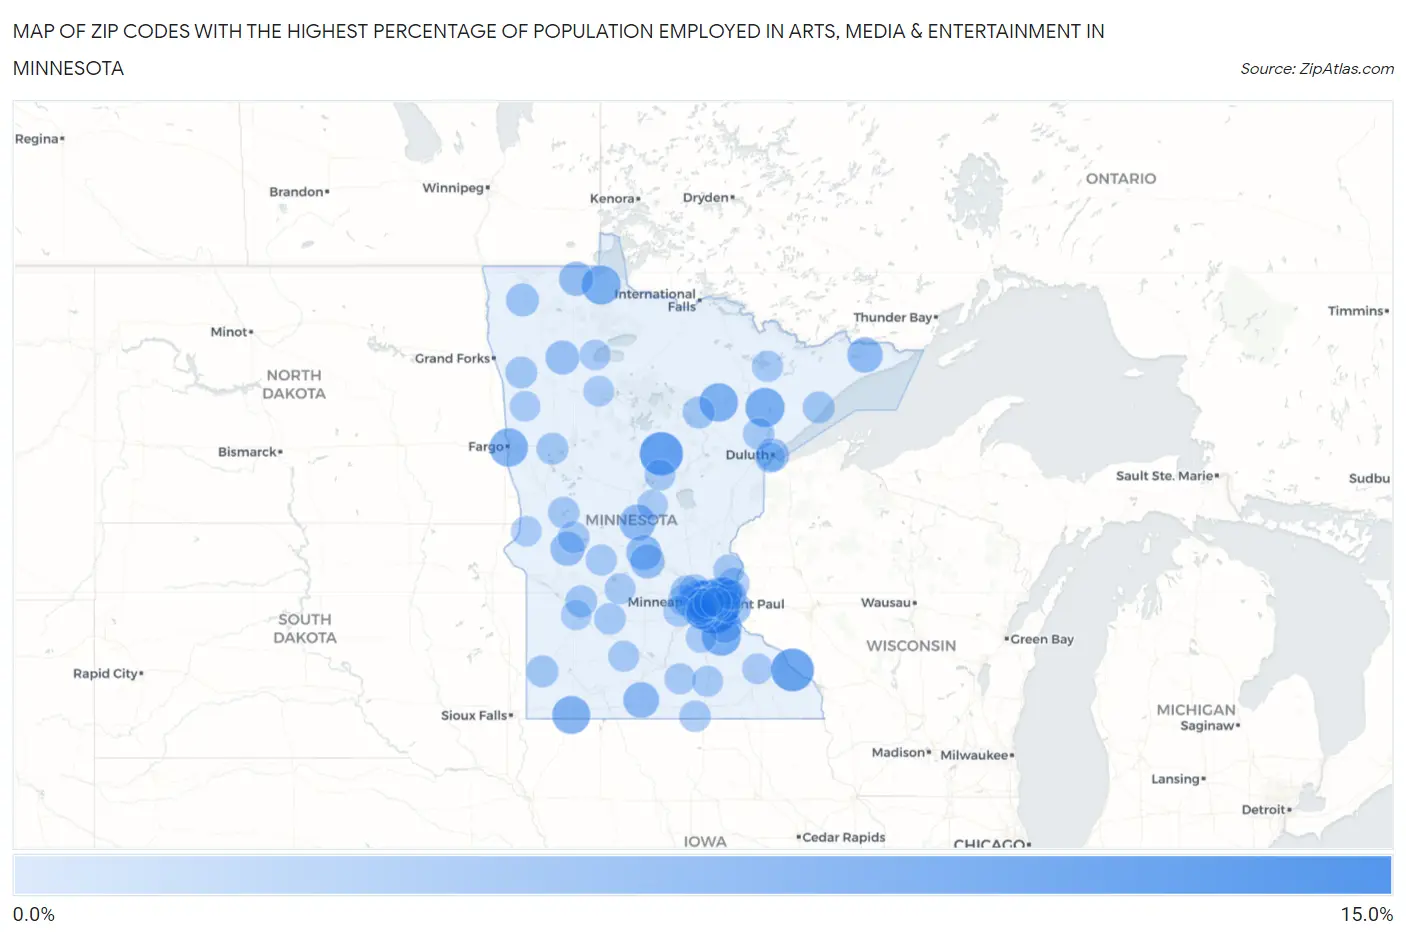
Map of Zip Codes with the Highest Percentage of Population Employed in Arts, Media & Entertainment in Minnesota
0.0%
15.0%
Zip Codes with the Highest Percentage of Population Employed in Arts, Media & Entertainment in Minnesota
| Zip Code | % Employed | vs State | vs National | |
| 1. | 55150 | 12.9% | 2.1%(+10.8)#1 | 2.1%(+10.8)#218 |
| 2. | 56448 | 9.5% | 2.1%(+7.42)#2 | 2.1%(+7.46)#411 |
| 3. | 55959 | 9.2% | 2.1%(+7.14)#3 | 2.1%(+7.17)#433 |
| 4. | 55409 | 7.9% | 2.1%(+5.82)#4 | 2.1%(+5.86)#564 |
| 5. | 55763 | 7.3% | 2.1%(+5.22)#5 | 2.1%(+5.26)#685 |
| 6. | 55065 | 7.3% | 2.1%(+5.19)#6 | 2.1%(+5.23)#690 |
| 7. | 56673 | 7.2% | 2.1%(+5.12)#7 | 2.1%(+5.16)#707 |
| 8. | 55413 | 7.2% | 2.1%(+5.08)#8 | 2.1%(+5.11)#717 |
| 9. | 55753 | 7.0% | 2.1%(+4.87)#9 | 2.1%(+4.91)#766 |
| 10. | 56562 | 6.9% | 2.1%(+4.76)#10 | 2.1%(+4.80)#791 |
| 11. | 55435 | 6.7% | 2.1%(+4.65)#11 | 2.1%(+4.69)#818 |
| 12. | 56117 | 6.7% | 2.1%(+4.60)#12 | 2.1%(+4.64)#833 |
| 13. | 55405 | 6.3% | 2.1%(+4.21)#13 | 2.1%(+4.25)#924 |
| 14. | 55419 | 6.0% | 2.1%(+3.86)#14 | 2.1%(+3.90)#1,052 |
| 15. | 55417 | 5.8% | 2.1%(+3.72)#15 | 2.1%(+3.76)#1,108 |
| 16. | 55116 | 5.6% | 2.1%(+3.54)#16 | 2.1%(+3.58)#1,174 |
| 17. | 56328 | 5.6% | 2.1%(+3.52)#17 | 2.1%(+3.56)#1,186 |
| 18. | 56075 | 5.6% | 2.1%(+3.46)#18 | 2.1%(+3.49)#1,216 |
| 19. | 55403 | 5.5% | 2.1%(+3.43)#19 | 2.1%(+3.46)#1,232 |
| 20. | 55418 | 5.5% | 2.1%(+3.37)#20 | 2.1%(+3.41)#1,267 |
| 21. | 55408 | 5.4% | 2.1%(+3.29)#21 | 2.1%(+3.33)#1,309 |
| 22. | 55604 | 5.3% | 2.1%(+3.22)#22 | 2.1%(+3.26)#1,340 |
| 23. | 55105 | 5.3% | 2.1%(+3.16)#23 | 2.1%(+3.20)#1,371 |
| 24. | 56321 | 5.2% | 2.1%(+3.07)#24 | 2.1%(+3.11)#1,413 |
| 25. | 55406 | 5.1% | 2.1%(+3.00)#25 | 2.1%(+3.04)#1,449 |
| 26. | 55422 | 5.0% | 2.1%(+2.91)#26 | 2.1%(+2.95)#1,496 |
| 27. | 55410 | 5.0% | 2.1%(+2.86)#27 | 2.1%(+2.89)#1,527 |
| 28. | 55415 | 4.9% | 2.1%(+2.83)#28 | 2.1%(+2.87)#1,546 |
| 29. | 55001 | 4.8% | 2.1%(+2.70)#29 | 2.1%(+2.74)#1,618 |
| 30. | 56369 | 4.8% | 2.1%(+2.68)#30 | 2.1%(+2.72)#1,637 |
| 31. | 56756 | 4.7% | 2.1%(+2.65)#31 | 2.1%(+2.69)#1,660 |
| 32. | 56323 | 4.7% | 2.1%(+2.58)#32 | 2.1%(+2.62)#1,707 |
| 33. | 55114 | 4.7% | 2.1%(+2.57)#33 | 2.1%(+2.61)#1,717 |
| 34. | 55085 | 4.6% | 2.1%(+2.49)#34 | 2.1%(+2.53)#1,787 |
| 35. | 56742 | 4.6% | 2.1%(+2.47)#35 | 2.1%(+2.51)#1,803 |
| 36. | 55412 | 4.5% | 2.1%(+2.42)#36 | 2.1%(+2.46)#1,835 |
| 37. | 55102 | 4.4% | 2.1%(+2.34)#37 | 2.1%(+2.37)#1,910 |
| 38. | 55090 | 4.4% | 2.1%(+2.30)#38 | 2.1%(+2.33)#1,943 |
| 39. | 55806 | 4.2% | 2.1%(+2.14)#39 | 2.1%(+2.18)#2,106 |
| 40. | 55407 | 4.2% | 2.1%(+2.06)#40 | 2.1%(+2.10)#2,174 |
| 41. | 56732 | 4.1% | 2.1%(+1.98)#41 | 2.1%(+2.02)#2,276 |
| 42. | 55401 | 4.0% | 2.1%(+1.95)#42 | 2.1%(+1.99)#2,314 |
| 43. | 55442 | 4.0% | 2.1%(+1.94)#43 | 2.1%(+1.98)#2,318 |
| 44. | 55104 | 4.0% | 2.1%(+1.86)#44 | 2.1%(+1.90)#2,425 |
| 45. | 55455 | 3.9% | 2.1%(+1.78)#45 | 2.1%(+1.82)#2,519 |
| 46. | 55436 | 3.7% | 2.1%(+1.65)#46 | 2.1%(+1.68)#2,701 |
| 47. | 55722 | 3.6% | 2.1%(+1.50)#47 | 2.1%(+1.53)#2,912 |
| 48. | 55108 | 3.6% | 2.1%(+1.49)#48 | 2.1%(+1.53)#2,932 |
| 49. | 55614 | 3.6% | 2.1%(+1.48)#49 | 2.1%(+1.52)#2,939 |
| 50. | 55115 | 3.6% | 2.1%(+1.46)#50 | 2.1%(+1.50)#2,975 |
| 51. | 56511 | 3.5% | 2.1%(+1.45)#51 | 2.1%(+1.49)#3,005 |
| 52. | 56139 | 3.5% | 2.1%(+1.44)#52 | 2.1%(+1.48)#3,010 |
| 53. | 55101 | 3.5% | 2.1%(+1.42)#53 | 2.1%(+1.46)#3,039 |
| 54. | 56260 | 3.5% | 2.1%(+1.42)#54 | 2.1%(+1.46)#3,043 |
| 55. | 55127 | 3.5% | 2.1%(+1.39)#55 | 2.1%(+1.43)#3,081 |
| 56. | 56716 | 3.5% | 2.1%(+1.39)#56 | 2.1%(+1.43)#3,091 |
| 57. | 55343 | 3.4% | 2.1%(+1.34)#57 | 2.1%(+1.37)#3,158 |
| 58. | 55047 | 3.4% | 2.1%(+1.31)#58 | 2.1%(+1.35)#3,234 |
| 59. | 56277 | 3.4% | 2.1%(+1.29)#59 | 2.1%(+1.33)#3,264 |
| 60. | 56327 | 3.3% | 2.1%(+1.25)#60 | 2.1%(+1.29)#3,344 |
| 61. | 55717 | 3.3% | 2.1%(+1.23)#61 | 2.1%(+1.27)#3,376 |
| 62. | 56309 | 3.3% | 2.1%(+1.20)#62 | 2.1%(+1.24)#3,419 |
| 63. | 56029 | 3.3% | 2.1%(+1.19)#63 | 2.1%(+1.23)#3,441 |
| 64. | 55113 | 3.3% | 2.1%(+1.17)#64 | 2.1%(+1.21)#3,478 |
| 65. | 55391 | 3.3% | 2.1%(+1.17)#65 | 2.1%(+1.21)#3,483 |
| 66. | 55420 | 3.3% | 2.1%(+1.17)#66 | 2.1%(+1.20)#3,485 |
| 67. | 55414 | 3.3% | 2.1%(+1.15)#67 | 2.1%(+1.19)#3,503 |
| 68. | 55311 | 3.2% | 2.1%(+1.13)#68 | 2.1%(+1.17)#3,545 |
| 69. | 55344 | 3.2% | 2.1%(+1.13)#69 | 2.1%(+1.17)#3,546 |
| 70. | 55110 | 3.2% | 2.1%(+1.12)#70 | 2.1%(+1.15)#3,580 |
| 71. | 55416 | 3.2% | 2.1%(+1.11)#71 | 2.1%(+1.15)#3,590 |
| 72. | 55125 | 3.2% | 2.1%(+1.09)#72 | 2.1%(+1.13)#3,626 |
| 73. | 55305 | 3.2% | 2.1%(+1.09)#73 | 2.1%(+1.13)#3,627 |
| 74. | 55359 | 3.2% | 2.1%(+1.09)#74 | 2.1%(+1.13)#3,640 |
| 75. | 56316 | 3.2% | 2.1%(+1.06)#75 | 2.1%(+1.10)#3,711 |
| 76. | 55357 | 3.1% | 2.1%(+1.05)#76 | 2.1%(+1.08)#3,747 |
| 77. | 55782 | 3.1% | 2.1%(+1.04)#77 | 2.1%(+1.08)#3,755 |
| 78. | 55426 | 3.1% | 2.1%(+1.02)#78 | 2.1%(+1.06)#3,792 |
| 79. | 56078 | 3.1% | 2.1%(+0.990)#79 | 2.1%(+1.03)#3,877 |
| 80. | 56046 | 3.1% | 2.1%(+0.978)#80 | 2.1%(+1.02)#3,902 |
| 81. | 55387 | 3.1% | 2.1%(+0.974)#81 | 2.1%(+1.01)#3,910 |
| 82. | 56085 | 3.1% | 2.1%(+0.964)#82 | 2.1%(+1.00)#3,942 |
| 83. | 56465 | 3.1% | 2.1%(+0.954)#83 | 2.1%(+0.992)#3,967 |
| 84. | 55013 | 3.0% | 2.1%(+0.943)#84 | 2.1%(+0.981)#3,992 |
| 85. | 56209 | 3.0% | 2.1%(+0.922)#85 | 2.1%(+0.960)#4,030 |
| 86. | 55438 | 3.0% | 2.1%(+0.898)#86 | 2.1%(+0.936)#4,084 |
| 87. | 55088 | 3.0% | 2.1%(+0.893)#87 | 2.1%(+0.931)#4,102 |
| 88. | 56676 | 2.9% | 2.1%(+0.842)#88 | 2.1%(+0.880)#4,228 |
| 89. | 55906 | 2.9% | 2.1%(+0.789)#89 | 2.1%(+0.827)#4,381 |
| 90. | 55424 | 2.9% | 2.1%(+0.788)#90 | 2.1%(+0.827)#4,383 |
| 91. | 56510 | 2.9% | 2.1%(+0.771)#91 | 2.1%(+0.809)#4,427 |
| 92. | 56671 | 2.9% | 2.1%(+0.764)#92 | 2.1%(+0.802)#4,444 |
| 93. | 55439 | 2.9% | 2.1%(+0.754)#93 | 2.1%(+0.792)#4,466 |
| 94. | 56296 | 2.8% | 2.1%(+0.729)#94 | 2.1%(+0.767)#4,538 |
| 95. | 56449 | 2.8% | 2.1%(+0.725)#95 | 2.1%(+0.763)#4,547 |
| 96. | 55082 | 2.8% | 2.1%(+0.720)#96 | 2.1%(+0.758)#4,565 |
| 97. | 56241 | 2.8% | 2.1%(+0.656)#97 | 2.1%(+0.695)#4,746 |
| 98. | 55404 | 2.8% | 2.1%(+0.652)#98 | 2.1%(+0.691)#4,756 |
| 99. | 55103 | 2.7% | 2.1%(+0.644)#99 | 2.1%(+0.682)#4,780 |
| 100. | 55807 | 2.7% | 2.1%(+0.615)#100 | 2.1%(+0.653)#4,867 |
Common Questions
What are the Top 10 Zip Codes with the Highest Percentage of Population Employed in Arts, Media & Entertainment in Minnesota?
Top 10 Zip Codes with the Highest Percentage of Population Employed in Arts, Media & Entertainment in Minnesota are:
What zip code has the Highest Percentage of Population Employed in Arts, Media & Entertainment in Minnesota?
55150 has the Highest Percentage of Population Employed in Arts, Media & Entertainment in Minnesota with 12.9%.
What is the Percentage of Population Employed in Arts, Media & Entertainment in the State of Minnesota?
Percentage of Population Employed in Arts, Media & Entertainment in Minnesota is 2.1%.
What is the Percentage of Population Employed in Arts, Media & Entertainment in the United States?
Percentage of Population Employed in Arts, Media & Entertainment in the United States is 2.1%.