Zip Codes with the Highest Percentage of Population Employed in Arts, Media & Entertainment in Arizona
RELATED REPORTS & OPTIONS
Arts, Media & Entertainment
Arizona
Compare Zip Codes
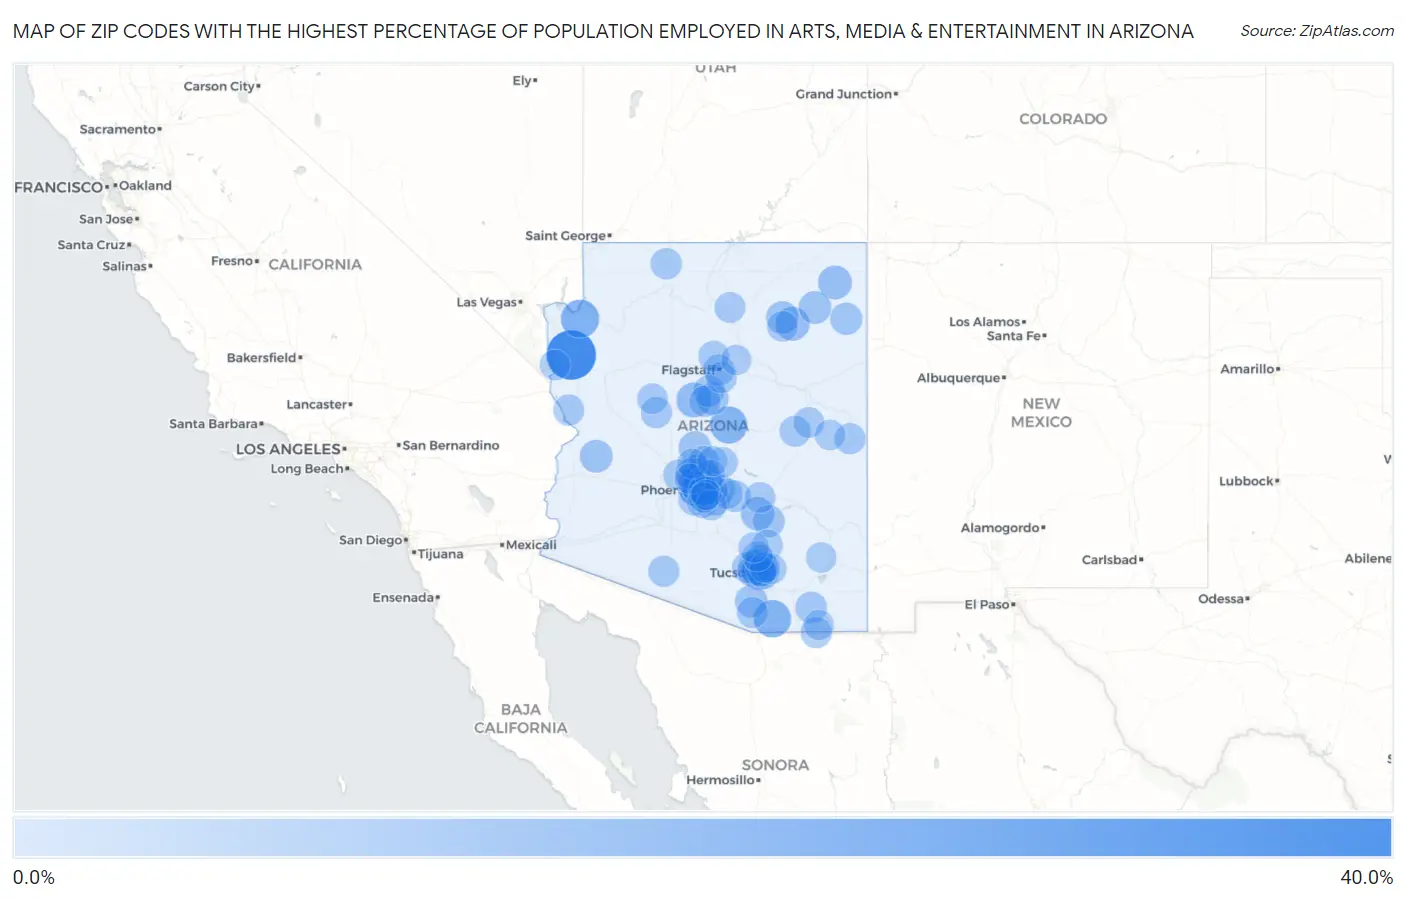
Map of Zip Codes with the Highest Percentage of Population Employed in Arts, Media & Entertainment in Arizona
0.0%
40.0%
Zip Codes with the Highest Percentage of Population Employed in Arts, Media & Entertainment in Arizona
| Zip Code | % Employed | vs State | vs National | |
| 1. | 86431 | 35.5% | 1.8%(+33.7)#1 | 2.1%(+33.4)#31 |
| 2. | 86444 | 15.5% | 1.8%(+13.7)#2 | 2.1%(+13.5)#156 |
| 3. | 85624 | 14.0% | 1.8%(+12.2)#3 | 2.1%(+11.9)#191 |
| 4. | 85544 | 13.8% | 1.8%(+12.0)#4 | 2.1%(+11.7)#194 |
| 5. | 86331 | 9.8% | 1.8%(+8.02)#5 | 2.1%(+7.78)#385 |
| 6. | 86042 | 8.4% | 1.8%(+6.59)#6 | 2.1%(+6.36)#500 |
| 7. | 86538 | 8.1% | 1.8%(+6.23)#7 | 2.1%(+5.99)#545 |
| 8. | 85137 | 7.3% | 1.8%(+5.45)#8 | 2.1%(+5.22)#697 |
| 9. | 85325 | 6.5% | 1.8%(+4.71)#9 | 2.1%(+4.48)#867 |
| 10. | 85701 | 6.4% | 1.8%(+4.55)#10 | 2.1%(+4.31)#904 |
| 11. | 86520 | 6.2% | 1.8%(+4.37)#11 | 2.1%(+4.14)#972 |
| 12. | 85054 | 6.2% | 1.8%(+4.36)#12 | 2.1%(+4.12)#982 |
| 13. | 86039 | 6.1% | 1.8%(+4.30)#13 | 2.1%(+4.07)#993 |
| 14. | 85324 | 6.0% | 1.8%(+4.15)#14 | 2.1%(+3.92)#1,039 |
| 15. | 85622 | 5.8% | 1.8%(+3.93)#15 | 2.1%(+3.69)#1,139 |
| 16. | 86540 | 5.5% | 1.8%(+3.64)#16 | 2.1%(+3.40)#1,272 |
| 17. | 85004 | 5.3% | 1.8%(+3.45)#17 | 2.1%(+3.21)#1,359 |
| 18. | 86351 | 5.2% | 1.8%(+3.37)#18 | 2.1%(+3.14)#1,401 |
| 19. | 85135 | 5.0% | 1.8%(+3.21)#19 | 2.1%(+2.98)#1,481 |
| 20. | 85013 | 4.7% | 1.8%(+2.83)#20 | 2.1%(+2.60)#1,720 |
| 21. | 85718 | 4.6% | 1.8%(+2.81)#21 | 2.1%(+2.58)#1,741 |
| 22. | 85118 | 4.5% | 1.8%(+2.65)#22 | 2.1%(+2.42)#1,871 |
| 23. | 85638 | 4.5% | 1.8%(+2.64)#23 | 2.1%(+2.41)#1,878 |
| 24. | 85012 | 4.4% | 1.8%(+2.60)#24 | 2.1%(+2.37)#1,917 |
| 25. | 86336 | 4.4% | 1.8%(+2.56)#25 | 2.1%(+2.32)#1,955 |
| 26. | 85007 | 4.3% | 1.8%(+2.48)#26 | 2.1%(+2.24)#2,034 |
| 27. | 85018 | 4.0% | 1.8%(+2.21)#27 | 2.1%(+1.98)#2,326 |
| 28. | 85034 | 4.0% | 1.8%(+2.18)#28 | 2.1%(+1.95)#2,356 |
| 29. | 86338 | 3.9% | 1.8%(+2.09)#29 | 2.1%(+1.86)#2,469 |
| 30. | 86325 | 3.9% | 1.8%(+2.03)#30 | 2.1%(+1.79)#2,551 |
| 31. | 86022 | 3.8% | 1.8%(+2.00)#31 | 2.1%(+1.77)#2,589 |
| 32. | 85251 | 3.8% | 1.8%(+1.95)#32 | 2.1%(+1.72)#2,652 |
| 33. | 85620 | 3.7% | 1.8%(+1.85)#33 | 2.1%(+1.62)#2,790 |
| 34. | 85704 | 3.7% | 1.8%(+1.85)#34 | 2.1%(+1.62)#2,792 |
| 35. | 85321 | 3.7% | 1.8%(+1.83)#35 | 2.1%(+1.59)#2,829 |
| 36. | 86011 | 3.6% | 1.8%(+1.78)#36 | 2.1%(+1.54)#2,904 |
| 37. | 85375 | 3.6% | 1.8%(+1.76)#37 | 2.1%(+1.52)#2,933 |
| 38. | 85938 | 3.6% | 1.8%(+1.75)#38 | 2.1%(+1.52)#2,950 |
| 39. | 85719 | 3.6% | 1.8%(+1.72)#39 | 2.1%(+1.49)#2,995 |
| 40. | 85646 | 3.5% | 1.8%(+1.71)#40 | 2.1%(+1.48)#3,018 |
| 41. | 86005 | 3.5% | 1.8%(+1.68)#41 | 2.1%(+1.45)#3,052 |
| 42. | 85923 | 3.4% | 1.8%(+1.59)#42 | 2.1%(+1.36)#3,196 |
| 43. | 85016 | 3.4% | 1.8%(+1.59)#43 | 2.1%(+1.35)#3,206 |
| 44. | 85260 | 3.4% | 1.8%(+1.55)#44 | 2.1%(+1.31)#3,285 |
| 45. | 86404 | 3.4% | 1.8%(+1.55)#45 | 2.1%(+1.31)#3,290 |
| 46. | 85741 | 3.4% | 1.8%(+1.54)#46 | 2.1%(+1.31)#3,313 |
| 47. | 85743 | 3.3% | 1.8%(+1.48)#47 | 2.1%(+1.25)#3,407 |
| 48. | 85028 | 3.3% | 1.8%(+1.45)#48 | 2.1%(+1.22)#3,468 |
| 49. | 85283 | 3.2% | 1.8%(+1.40)#49 | 2.1%(+1.16)#3,563 |
| 50. | 85282 | 3.2% | 1.8%(+1.40)#50 | 2.1%(+1.16)#3,564 |
| 51. | 85085 | 3.2% | 1.8%(+1.39)#51 | 2.1%(+1.16)#3,571 |
| 52. | 85022 | 3.2% | 1.8%(+1.35)#52 | 2.1%(+1.12)#3,657 |
| 53. | 85258 | 3.2% | 1.8%(+1.35)#53 | 2.1%(+1.12)#3,659 |
| 54. | 85003 | 3.1% | 1.8%(+1.32)#54 | 2.1%(+1.09)#3,744 |
| 55. | 85053 | 3.1% | 1.8%(+1.29)#55 | 2.1%(+1.06)#3,800 |
| 56. | 86001 | 3.1% | 1.8%(+1.26)#56 | 2.1%(+1.03)#3,881 |
| 57. | 85024 | 3.1% | 1.8%(+1.24)#57 | 2.1%(+1.01)#3,914 |
| 58. | 85201 | 3.0% | 1.8%(+1.15)#58 | 2.1%(+0.918)#4,139 |
| 59. | 85253 | 2.9% | 1.8%(+1.10)#59 | 2.1%(+0.872)#4,251 |
| 60. | 85021 | 2.9% | 1.8%(+1.10)#60 | 2.1%(+0.871)#4,258 |
| 61. | 85705 | 2.9% | 1.8%(+1.10)#61 | 2.1%(+0.867)#4,268 |
| 62. | 85539 | 2.9% | 1.8%(+1.08)#62 | 2.1%(+0.846)#4,336 |
| 63. | 86020 | 2.9% | 1.8%(+1.07)#63 | 2.1%(+0.842)#4,344 |
| 64. | 86305 | 2.9% | 1.8%(+1.06)#64 | 2.1%(+0.832)#4,364 |
| 65. | 85623 | 2.9% | 1.8%(+1.06)#65 | 2.1%(+0.831)#4,369 |
| 66. | 85939 | 2.9% | 1.8%(+1.05)#66 | 2.1%(+0.813)#4,414 |
| 67. | 85745 | 2.8% | 1.8%(+1.02)#67 | 2.1%(+0.786)#4,480 |
| 68. | 85295 | 2.8% | 1.8%(+0.971)#68 | 2.1%(+0.738)#4,622 |
| 69. | 85045 | 2.8% | 1.8%(+0.954)#69 | 2.1%(+0.722)#4,664 |
| 70. | 85006 | 2.7% | 1.8%(+0.914)#70 | 2.1%(+0.682)#4,782 |
| 71. | 85207 | 2.7% | 1.8%(+0.907)#71 | 2.1%(+0.674)#4,807 |
| 72. | 85014 | 2.7% | 1.8%(+0.877)#72 | 2.1%(+0.645)#4,885 |
| 73. | 86429 | 2.7% | 1.8%(+0.874)#73 | 2.1%(+0.642)#4,894 |
| 74. | 85310 | 2.7% | 1.8%(+0.871)#74 | 2.1%(+0.638)#4,912 |
| 75. | 86043 | 2.7% | 1.8%(+0.866)#75 | 2.1%(+0.634)#4,932 |
| 76. | 85226 | 2.7% | 1.8%(+0.857)#76 | 2.1%(+0.624)#4,955 |
| 77. | 85263 | 2.6% | 1.8%(+0.815)#77 | 2.1%(+0.583)#5,083 |
| 78. | 85737 | 2.6% | 1.8%(+0.810)#78 | 2.1%(+0.577)#5,106 |
| 79. | 85711 | 2.6% | 1.8%(+0.794)#79 | 2.1%(+0.561)#5,160 |
| 80. | 85119 | 2.6% | 1.8%(+0.791)#80 | 2.1%(+0.559)#5,166 |
| 81. | 85213 | 2.6% | 1.8%(+0.787)#81 | 2.1%(+0.555)#5,179 |
| 82. | 85749 | 2.6% | 1.8%(+0.782)#82 | 2.1%(+0.549)#5,196 |
| 83. | 85281 | 2.6% | 1.8%(+0.757)#83 | 2.1%(+0.524)#5,280 |
| 84. | 85716 | 2.6% | 1.8%(+0.723)#84 | 2.1%(+0.490)#5,398 |
| 85. | 85940 | 2.5% | 1.8%(+0.693)#85 | 2.1%(+0.460)#5,488 |
| 86. | 85750 | 2.5% | 1.8%(+0.631)#86 | 2.1%(+0.399)#5,685 |
| 87. | 85257 | 2.5% | 1.8%(+0.626)#87 | 2.1%(+0.393)#5,712 |
| 88. | 85249 | 2.4% | 1.8%(+0.586)#88 | 2.1%(+0.353)#5,888 |
| 89. | 85755 | 2.4% | 1.8%(+0.562)#89 | 2.1%(+0.330)#5,968 |
| 90. | 85331 | 2.4% | 1.8%(+0.557)#90 | 2.1%(+0.324)#5,988 |
| 91. | 85255 | 2.4% | 1.8%(+0.533)#91 | 2.1%(+0.300)#6,079 |
| 92. | 85643 | 2.3% | 1.8%(+0.521)#92 | 2.1%(+0.289)#6,142 |
| 93. | 85739 | 2.3% | 1.8%(+0.514)#93 | 2.1%(+0.282)#6,176 |
| 94. | 86004 | 2.3% | 1.8%(+0.498)#94 | 2.1%(+0.266)#6,261 |
| 95. | 85086 | 2.3% | 1.8%(+0.484)#95 | 2.1%(+0.251)#6,332 |
| 96. | 85306 | 2.3% | 1.8%(+0.476)#96 | 2.1%(+0.244)#6,367 |
| 97. | 85262 | 2.3% | 1.8%(+0.455)#97 | 2.1%(+0.223)#6,448 |
| 98. | 85603 | 2.3% | 1.8%(+0.441)#98 | 2.1%(+0.209)#6,512 |
| 99. | 85284 | 2.3% | 1.8%(+0.428)#99 | 2.1%(+0.195)#6,567 |
| 100. | 85202 | 2.2% | 1.8%(+0.393)#100 | 2.1%(+0.160)#6,728 |
Common Questions
What are the Top 10 Zip Codes with the Highest Percentage of Population Employed in Arts, Media & Entertainment in Arizona?
Top 10 Zip Codes with the Highest Percentage of Population Employed in Arts, Media & Entertainment in Arizona are:
What zip code has the Highest Percentage of Population Employed in Arts, Media & Entertainment in Arizona?
86431 has the Highest Percentage of Population Employed in Arts, Media & Entertainment in Arizona with 35.5%.
What is the Percentage of Population Employed in Arts, Media & Entertainment in the State of Arizona?
Percentage of Population Employed in Arts, Media & Entertainment in Arizona is 1.8%.
What is the Percentage of Population Employed in Arts, Media & Entertainment in the United States?
Percentage of Population Employed in Arts, Media & Entertainment in the United States is 2.1%.