Zip Codes with the Highest Percentage of Population Employed in Arts, Media & Entertainment in Nebraska
RELATED REPORTS & OPTIONS
Arts, Media & Entertainment
Nebraska
Compare Zip Codes
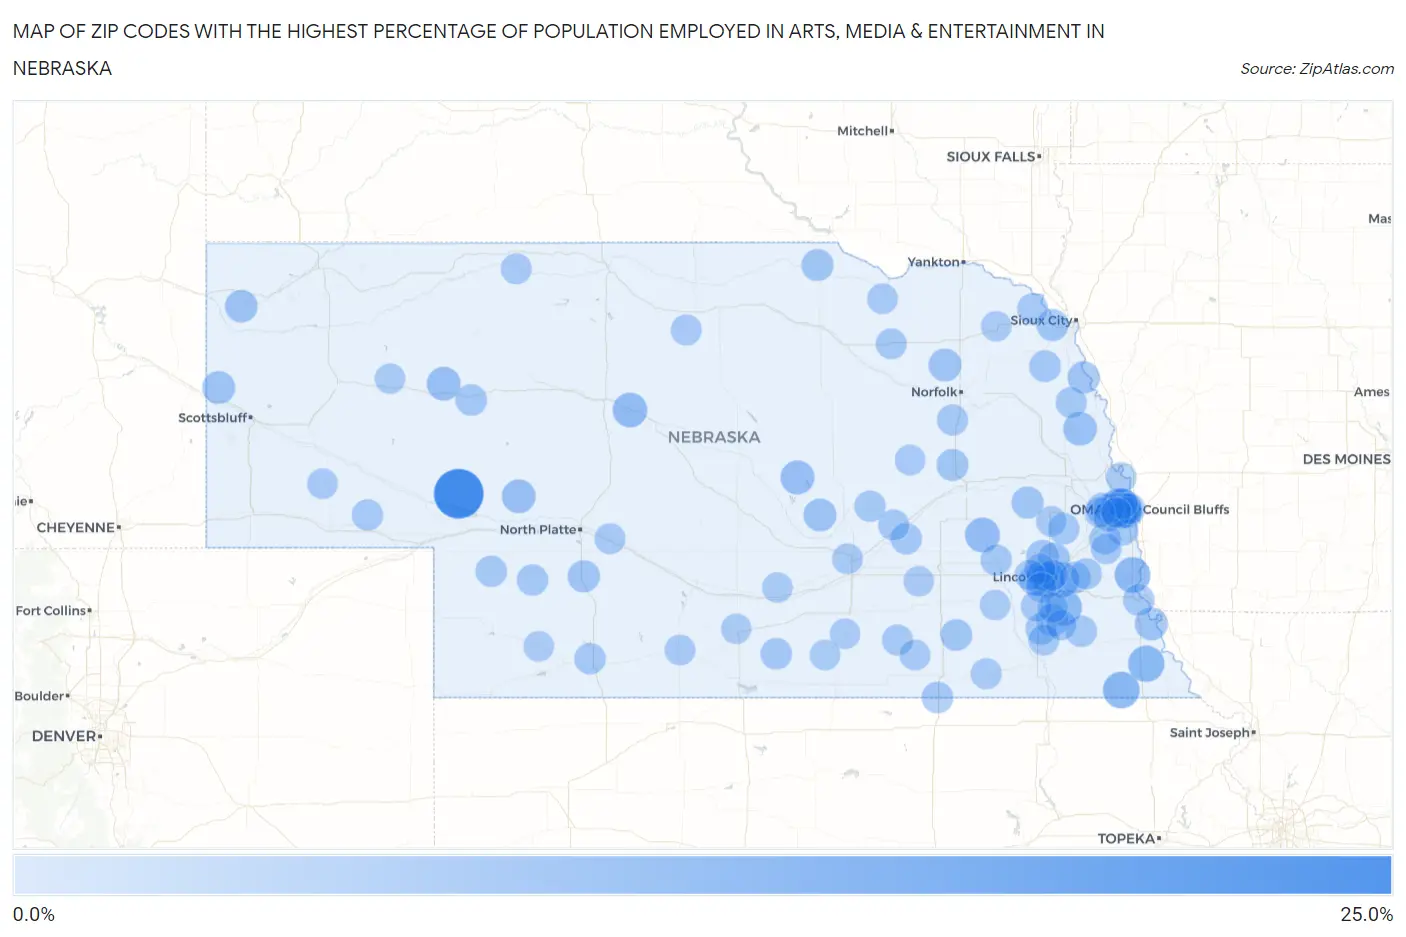
Map of Zip Codes with the Highest Percentage of Population Employed in Arts, Media & Entertainment in Nebraska
0.0%
25.0%
Zip Codes with the Highest Percentage of Population Employed in Arts, Media & Entertainment in Nebraska
| Zip Code | % Employed | vs State | vs National | |
| 1. | 69146 | 21.3% | 1.5%(+19.8)#1 | 2.1%(+19.2)#81 |
| 2. | 68182 | 11.4% | 1.5%(+9.94)#2 | 2.1%(+9.38)#284 |
| 3. | 68345 | 7.9% | 1.5%(+6.37)#3 | 2.1%(+5.80)#570 |
| 4. | 68419 | 7.6% | 1.5%(+6.10)#4 | 2.1%(+5.53)#627 |
| 5. | 68442 | 7.6% | 1.5%(+6.10)#5 | 2.1%(+5.53)#628 |
| 6. | 68520 | 7.3% | 1.5%(+5.75)#6 | 2.1%(+5.19)#702 |
| 7. | 68455 | 7.1% | 1.5%(+5.58)#7 | 2.1%(+5.01)#741 |
| 8. | 68669 | 6.2% | 1.5%(+4.69)#8 | 2.1%(+4.13)#979 |
| 9. | 69142 | 6.0% | 1.5%(+4.47)#9 | 2.1%(+3.91)#1,044 |
| 10. | 68859 | 5.4% | 1.5%(+3.86)#10 | 2.1%(+3.30)#1,321 |
| 11. | 69333 | 5.1% | 1.5%(+3.65)#11 | 2.1%(+3.09)#1,425 |
| 12. | 69165 | 5.1% | 1.5%(+3.61)#12 | 2.1%(+3.05)#1,440 |
| 13. | 68019 | 5.1% | 1.5%(+3.56)#13 | 2.1%(+3.00)#1,466 |
| 14. | 68132 | 5.0% | 1.5%(+3.54)#14 | 2.1%(+2.98)#1,474 |
| 15. | 68767 | 4.3% | 1.5%(+2.76)#15 | 2.1%(+2.20)#2,082 |
| 16. | 68838 | 4.2% | 1.5%(+2.74)#16 | 2.1%(+2.18)#2,100 |
| 17. | 69358 | 4.2% | 1.5%(+2.73)#17 | 2.1%(+2.16)#2,122 |
| 18. | 68506 | 4.2% | 1.5%(+2.67)#18 | 2.1%(+2.11)#2,164 |
| 19. | 68421 | 4.1% | 1.5%(+2.64)#19 | 2.1%(+2.08)#2,199 |
| 20. | 69346 | 3.9% | 1.5%(+2.44)#20 | 2.1%(+1.88)#2,444 |
| 21. | 68358 | 3.9% | 1.5%(+2.36)#21 | 2.1%(+1.80)#2,538 |
| 22. | 68336 | 3.9% | 1.5%(+2.36)#22 | 2.1%(+1.80)#2,546 |
| 23. | 68517 | 3.8% | 1.5%(+2.30)#23 | 2.1%(+1.74)#2,623 |
| 24. | 68039 | 3.7% | 1.5%(+2.18)#24 | 2.1%(+1.62)#2,797 |
| 25. | 69170 | 3.6% | 1.5%(+2.15)#25 | 2.1%(+1.59)#2,836 |
| 26. | 68050 | 3.5% | 1.5%(+1.97)#26 | 2.1%(+1.41)#3,110 |
| 27. | 68777 | 3.4% | 1.5%(+1.92)#27 | 2.1%(+1.36)#3,195 |
| 28. | 68653 | 3.3% | 1.5%(+1.84)#28 | 2.1%(+1.28)#3,355 |
| 29. | 68743 | 3.3% | 1.5%(+1.81)#29 | 2.1%(+1.25)#3,408 |
| 30. | 68118 | 3.2% | 1.5%(+1.75)#30 | 2.1%(+1.19)#3,514 |
| 31. | 68416 | 3.1% | 1.5%(+1.65)#31 | 2.1%(+1.09)#3,734 |
| 32. | 68510 | 3.1% | 1.5%(+1.61)#32 | 2.1%(+1.05)#3,813 |
| 33. | 68062 | 3.1% | 1.5%(+1.58)#33 | 2.1%(+1.02)#3,901 |
| 34. | 68331 | 3.0% | 1.5%(+1.52)#34 | 2.1%(+0.955)#4,041 |
| 35. | 69350 | 3.0% | 1.5%(+1.49)#35 | 2.1%(+0.924)#4,126 |
| 36. | 68059 | 2.9% | 1.5%(+1.42)#36 | 2.1%(+0.856)#4,300 |
| 37. | 68947 | 2.9% | 1.5%(+1.41)#37 | 2.1%(+0.848)#4,325 |
| 38. | 68410 | 2.9% | 1.5%(+1.40)#38 | 2.1%(+0.837)#4,354 |
| 39. | 68502 | 2.9% | 1.5%(+1.39)#39 | 2.1%(+0.829)#4,376 |
| 40. | 68347 | 2.9% | 1.5%(+1.37)#40 | 2.1%(+0.808)#4,431 |
| 41. | 68327 | 2.9% | 1.5%(+1.36)#41 | 2.1%(+0.796)#4,453 |
| 42. | 68846 | 2.9% | 1.5%(+1.36)#42 | 2.1%(+0.796)#4,455 |
| 43. | 68443 | 2.8% | 1.5%(+1.34)#43 | 2.1%(+0.779)#4,503 |
| 44. | 68033 | 2.8% | 1.5%(+1.28)#44 | 2.1%(+0.717)#4,671 |
| 45. | 69150 | 2.7% | 1.5%(+1.24)#45 | 2.1%(+0.679)#4,793 |
| 46. | 68522 | 2.7% | 1.5%(+1.23)#46 | 2.1%(+0.672)#4,811 |
| 47. | 69149 | 2.7% | 1.5%(+1.22)#47 | 2.1%(+0.664)#4,840 |
| 48. | 69001 | 2.7% | 1.5%(+1.22)#48 | 2.1%(+0.659)#4,852 |
| 49. | 69169 | 2.7% | 1.5%(+1.21)#49 | 2.1%(+0.652)#4,868 |
| 50. | 68864 | 2.7% | 1.5%(+1.17)#50 | 2.1%(+0.606)#5,012 |
| 51. | 68134 | 2.7% | 1.5%(+1.16)#51 | 2.1%(+0.594)#5,046 |
| 52. | 68434 | 2.6% | 1.5%(+1.15)#52 | 2.1%(+0.585)#5,076 |
| 53. | 68131 | 2.6% | 1.5%(+1.10)#53 | 2.1%(+0.538)#5,237 |
| 54. | 68105 | 2.5% | 1.5%(+1.04)#54 | 2.1%(+0.478)#5,422 |
| 55. | 68349 | 2.5% | 1.5%(+1.03)#55 | 2.1%(+0.464)#5,468 |
| 56. | 68133 | 2.5% | 1.5%(+1.02)#56 | 2.1%(+0.463)#5,474 |
| 57. | 68748 | 2.5% | 1.5%(+0.998)#57 | 2.1%(+0.437)#5,562 |
| 58. | 68038 | 2.5% | 1.5%(+0.985)#58 | 2.1%(+0.424)#5,598 |
| 59. | 68508 | 2.5% | 1.5%(+0.981)#59 | 2.1%(+0.420)#5,617 |
| 60. | 68137 | 2.5% | 1.5%(+0.971)#60 | 2.1%(+0.410)#5,652 |
| 61. | 68422 | 2.4% | 1.5%(+0.907)#61 | 2.1%(+0.346)#5,916 |
| 62. | 68935 | 2.4% | 1.5%(+0.881)#62 | 2.1%(+0.320)#6,007 |
| 63. | 68720 | 2.4% | 1.5%(+0.881)#63 | 2.1%(+0.320)#6,009 |
| 64. | 68826 | 2.4% | 1.5%(+0.880)#64 | 2.1%(+0.319)#6,015 |
| 65. | 68352 | 2.4% | 1.5%(+0.860)#65 | 2.1%(+0.299)#6,084 |
| 66. | 69151 | 2.3% | 1.5%(+0.837)#66 | 2.1%(+0.276)#6,201 |
| 67. | 68404 | 2.3% | 1.5%(+0.821)#67 | 2.1%(+0.260)#6,292 |
| 68. | 68505 | 2.3% | 1.5%(+0.785)#68 | 2.1%(+0.224)#6,441 |
| 69. | 69210 | 2.3% | 1.5%(+0.777)#69 | 2.1%(+0.216)#6,470 |
| 70. | 69211 | 2.3% | 1.5%(+0.773)#70 | 2.1%(+0.212)#6,496 |
| 71. | 68106 | 2.2% | 1.5%(+0.705)#71 | 2.1%(+0.144)#6,800 |
| 72. | 68770 | 2.2% | 1.5%(+0.705)#72 | 2.1%(+0.144)#6,802 |
| 73. | 68521 | 2.2% | 1.5%(+0.694)#73 | 2.1%(+0.133)#6,859 |
| 74. | 68102 | 2.1% | 1.5%(+0.613)#74 | 2.1%(+0.052)#7,203 |
| 75. | 68154 | 2.1% | 1.5%(+0.605)#75 | 2.1%(+0.044)#7,257 |
| 76. | 68660 | 2.1% | 1.5%(+0.603)#76 | 2.1%(+0.042)#7,266 |
| 77. | 68783 | 2.1% | 1.5%(+0.593)#77 | 2.1%(+0.032)#7,311 |
| 78. | 68335 | 2.1% | 1.5%(+0.592)#78 | 2.1%(+0.031)#7,317 |
| 79. | 68803 | 2.1% | 1.5%(+0.572)#79 | 2.1%(+0.011)#7,427 |
| 80. | 68104 | 2.1% | 1.5%(+0.567)#80 | 2.1%(+0.006)#7,454 |
| 81. | 69131 | 2.1% | 1.5%(+0.565)#81 | 2.1%(+0.004)#7,470 |
| 82. | 68922 | 2.1% | 1.5%(+0.558)#82 | 2.1%(-0.003)#7,501 |
| 83. | 68037 | 2.0% | 1.5%(+0.541)#83 | 2.1%(-0.020)#7,594 |
| 84. | 68130 | 2.0% | 1.5%(+0.522)#84 | 2.1%(-0.039)#7,698 |
| 85. | 68301 | 2.0% | 1.5%(+0.503)#85 | 2.1%(-0.058)#7,807 |
| 86. | 68528 | 2.0% | 1.5%(+0.488)#86 | 2.1%(-0.073)#7,871 |
| 87. | 68847 | 2.0% | 1.5%(+0.477)#87 | 2.1%(-0.084)#7,934 |
| 88. | 68928 | 2.0% | 1.5%(+0.474)#88 | 2.1%(-0.087)#7,962 |
| 89. | 68124 | 2.0% | 1.5%(+0.470)#89 | 2.1%(-0.091)#7,978 |
| 90. | 68023 | 2.0% | 1.5%(+0.469)#90 | 2.1%(-0.092)#7,983 |
| 91. | 68512 | 2.0% | 1.5%(+0.453)#91 | 2.1%(-0.108)#8,068 |
| 92. | 69351 | 1.9% | 1.5%(+0.442)#92 | 2.1%(-0.119)#8,126 |
| 93. | 68372 | 1.9% | 1.5%(+0.426)#93 | 2.1%(-0.135)#8,222 |
| 94. | 68745 | 1.9% | 1.5%(+0.426)#94 | 2.1%(-0.135)#8,226 |
| 95. | 68371 | 1.9% | 1.5%(+0.420)#95 | 2.1%(-0.141)#8,256 |
| 96. | 69040 | 1.9% | 1.5%(+0.416)#96 | 2.1%(-0.145)#8,287 |
| 97. | 68066 | 1.9% | 1.5%(+0.367)#97 | 2.1%(-0.194)#8,577 |
| 98. | 68925 | 1.9% | 1.5%(+0.361)#98 | 2.1%(-0.200)#8,611 |
| 99. | 68343 | 1.8% | 1.5%(+0.315)#99 | 2.1%(-0.246)#8,901 |
| 100. | 68949 | 1.8% | 1.5%(+0.279)#100 | 2.1%(-0.282)#9,101 |
Common Questions
What are the Top 10 Zip Codes with the Highest Percentage of Population Employed in Arts, Media & Entertainment in Nebraska?
Top 10 Zip Codes with the Highest Percentage of Population Employed in Arts, Media & Entertainment in Nebraska are:
What zip code has the Highest Percentage of Population Employed in Arts, Media & Entertainment in Nebraska?
69146 has the Highest Percentage of Population Employed in Arts, Media & Entertainment in Nebraska with 21.3%.
What is the Percentage of Population Employed in Arts, Media & Entertainment in the State of Nebraska?
Percentage of Population Employed in Arts, Media & Entertainment in Nebraska is 1.5%.
What is the Percentage of Population Employed in Arts, Media & Entertainment in the United States?
Percentage of Population Employed in Arts, Media & Entertainment in the United States is 2.1%.