Zip Codes with the Highest Percentage of Population Employed in Arts, Media & Entertainment in Pennsylvania
RELATED REPORTS & OPTIONS
Arts, Media & Entertainment
Pennsylvania
Compare Zip Codes
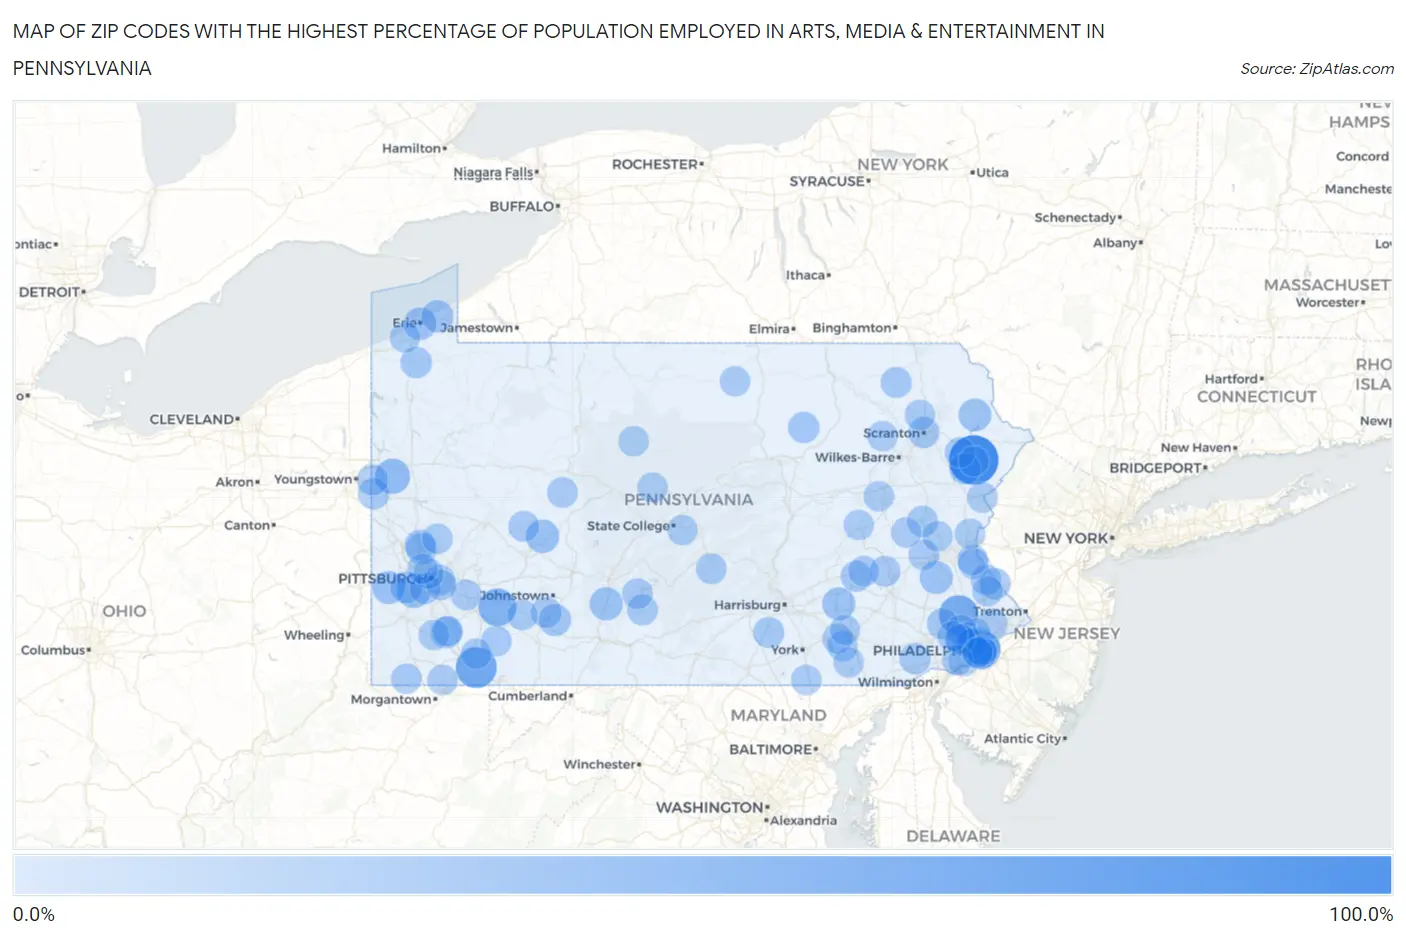
Map of Zip Codes with the Highest Percentage of Population Employed in Arts, Media & Entertainment in Pennsylvania
0.0%
100.0%
Zip Codes with the Highest Percentage of Population Employed in Arts, Media & Entertainment in Pennsylvania
| Zip Code | % Employed | vs State | vs National | |
| 1. | 18357 | 91.7% | 1.8%(+89.9)#1 | 2.1%(+89.6)#3 |
| 2. | 15421 | 52.1% | 1.8%(+50.3)#2 | 2.1%(+50.0)#9 |
| 3. | 19490 | 45.7% | 1.8%(+43.9)#3 | 2.1%(+43.6)#16 |
| 4. | 19108 | 39.1% | 1.8%(+37.4)#4 | 2.1%(+37.1)#23 |
| 5. | 15693 | 37.1% | 1.8%(+35.4)#5 | 2.1%(+35.1)#30 |
| 6. | 16172 | 25.3% | 1.8%(+23.6)#6 | 2.1%(+23.3)#59 |
| 7. | 15064 | 18.6% | 1.8%(+16.9)#7 | 2.1%(+16.6)#114 |
| 8. | 15734 | 17.9% | 1.8%(+16.1)#8 | 2.1%(+15.8)#120 |
| 9. | 16682 | 16.2% | 1.8%(+14.4)#9 | 2.1%(+14.1)#146 |
| 10. | 18056 | 16.0% | 1.8%(+14.3)#10 | 2.1%(+14.0)#149 |
| 11. | 17016 | 15.8% | 1.8%(+14.1)#11 | 2.1%(+13.8)#151 |
| 12. | 15053 | 15.6% | 1.8%(+13.8)#12 | 2.1%(+13.5)#155 |
| 13. | 18473 | 15.1% | 1.8%(+13.3)#13 | 2.1%(+13.0)#167 |
| 14. | 16501 | 13.6% | 1.8%(+11.8)#14 | 2.1%(+11.5)#197 |
| 15. | 15082 | 12.0% | 1.8%(+10.2)#15 | 2.1%(+9.90)#258 |
| 16. | 16421 | 11.8% | 1.8%(+10.0)#16 | 2.1%(+9.70)#269 |
| 17. | 15936 | 11.6% | 1.8%(+9.89)#17 | 2.1%(+9.59)#274 |
| 18. | 15477 | 9.8% | 1.8%(+8.03)#18 | 2.1%(+7.72)#390 |
| 19. | 16444 | 8.7% | 1.8%(+6.96)#19 | 2.1%(+6.65)#473 |
| 20. | 18342 | 8.6% | 1.8%(+6.88)#20 | 2.1%(+6.57)#476 |
| 21. | 18619 | 8.6% | 1.8%(+6.82)#21 | 2.1%(+6.51)#484 |
| 22. | 18933 | 8.5% | 1.8%(+6.70)#22 | 2.1%(+6.39)#496 |
| 23. | 15015 | 7.8% | 1.8%(+6.07)#23 | 2.1%(+5.77)#575 |
| 24. | 19375 | 7.8% | 1.8%(+6.04)#24 | 2.1%(+5.73)#582 |
| 25. | 16132 | 7.6% | 1.8%(+5.86)#25 | 2.1%(+5.55)#623 |
| 26. | 19453 | 7.6% | 1.8%(+5.82)#26 | 2.1%(+5.51)#632 |
| 27. | 18503 | 7.5% | 1.8%(+5.75)#27 | 2.1%(+5.44)#647 |
| 28. | 16140 | 7.4% | 1.8%(+5.68)#28 | 2.1%(+5.37)#658 |
| 29. | 18816 | 7.1% | 1.8%(+5.39)#29 | 2.1%(+5.08)#726 |
| 30. | 19550 | 7.0% | 1.8%(+5.30)#30 | 2.1%(+4.99)#751 |
| 31. | 18244 | 6.7% | 1.8%(+4.95)#31 | 2.1%(+4.65)#831 |
| 32. | 19129 | 6.5% | 1.8%(+4.71)#32 | 2.1%(+4.40)#882 |
| 33. | 17323 | 6.5% | 1.8%(+4.70)#33 | 2.1%(+4.39)#888 |
| 34. | 18930 | 6.4% | 1.8%(+4.61)#34 | 2.1%(+4.30)#908 |
| 35. | 19147 | 6.1% | 1.8%(+4.34)#35 | 2.1%(+4.04)#1,004 |
| 36. | 16621 | 6.0% | 1.8%(+4.28)#36 | 2.1%(+3.97)#1,020 |
| 37. | 15937 | 6.0% | 1.8%(+4.25)#37 | 2.1%(+3.94)#1,030 |
| 38. | 19516 | 5.8% | 1.8%(+4.06)#38 | 2.1%(+3.75)#1,110 |
| 39. | 15692 | 5.8% | 1.8%(+4.06)#39 | 2.1%(+3.75)#1,112 |
| 40. | 15086 | 5.8% | 1.8%(+4.04)#40 | 2.1%(+3.74)#1,118 |
| 41. | 19125 | 5.8% | 1.8%(+4.02)#41 | 2.1%(+3.71)#1,133 |
| 42. | 15469 | 5.8% | 1.8%(+4.00)#42 | 2.1%(+3.70)#1,136 |
| 43. | 19118 | 5.7% | 1.8%(+3.96)#43 | 2.1%(+3.65)#1,156 |
| 44. | 19106 | 5.7% | 1.8%(+3.91)#44 | 2.1%(+3.60)#1,170 |
| 45. | 19405 | 5.6% | 1.8%(+3.86)#45 | 2.1%(+3.55)#1,190 |
| 46. | 17058 | 5.6% | 1.8%(+3.83)#46 | 2.1%(+3.53)#1,203 |
| 47. | 16657 | 5.6% | 1.8%(+3.81)#47 | 2.1%(+3.50)#1,214 |
| 48. | 18327 | 5.5% | 1.8%(+3.74)#48 | 2.1%(+3.43)#1,253 |
| 49. | 16246 | 5.5% | 1.8%(+3.73)#49 | 2.1%(+3.42)#1,258 |
| 50. | 15863 | 5.5% | 1.8%(+3.70)#50 | 2.1%(+3.39)#1,278 |
| 51. | 18947 | 5.4% | 1.8%(+3.65)#51 | 2.1%(+3.34)#1,304 |
| 52. | 15228 | 5.4% | 1.8%(+3.64)#52 | 2.1%(+3.33)#1,307 |
| 53. | 18051 | 5.3% | 1.8%(+3.50)#53 | 2.1%(+3.20)#1,374 |
| 54. | 19130 | 5.2% | 1.8%(+3.49)#54 | 2.1%(+3.18)#1,376 |
| 55. | 19035 | 5.1% | 1.8%(+3.35)#55 | 2.1%(+3.05)#1,442 |
| 56. | 15217 | 5.0% | 1.8%(+3.28)#56 | 2.1%(+2.98)#1,478 |
| 57. | 18460 | 5.0% | 1.8%(+3.25)#57 | 2.1%(+2.94)#1,503 |
| 58. | 15362 | 5.0% | 1.8%(+3.23)#58 | 2.1%(+2.92)#1,512 |
| 59. | 19072 | 5.0% | 1.8%(+3.21)#59 | 2.1%(+2.91)#1,516 |
| 60. | 18077 | 5.0% | 1.8%(+3.21)#60 | 2.1%(+2.90)#1,523 |
| 61. | 19559 | 4.9% | 1.8%(+3.11)#61 | 2.1%(+2.80)#1,579 |
| 62. | 17551 | 4.8% | 1.8%(+3.05)#62 | 2.1%(+2.74)#1,612 |
| 63. | 15431 | 4.8% | 1.8%(+3.04)#63 | 2.1%(+2.73)#1,625 |
| 64. | 19010 | 4.8% | 1.8%(+3.00)#64 | 2.1%(+2.69)#1,657 |
| 65. | 19004 | 4.7% | 1.8%(+2.97)#65 | 2.1%(+2.66)#1,679 |
| 66. | 16059 | 4.7% | 1.8%(+2.94)#66 | 2.1%(+2.64)#1,693 |
| 67. | 15832 | 4.7% | 1.8%(+2.93)#67 | 2.1%(+2.63)#1,700 |
| 68. | 18471 | 4.7% | 1.8%(+2.93)#68 | 2.1%(+2.62)#1,704 |
| 69. | 18059 | 4.7% | 1.8%(+2.91)#69 | 2.1%(+2.60)#1,724 |
| 70. | 18211 | 4.6% | 1.8%(+2.85)#70 | 2.1%(+2.54)#1,776 |
| 71. | 19076 | 4.5% | 1.8%(+2.79)#71 | 2.1%(+2.48)#1,818 |
| 72. | 19066 | 4.5% | 1.8%(+2.74)#72 | 2.1%(+2.44)#1,856 |
| 73. | 19123 | 4.5% | 1.8%(+2.73)#73 | 2.1%(+2.42)#1,864 |
| 74. | 15474 | 4.4% | 1.8%(+2.69)#74 | 2.1%(+2.38)#1,903 |
| 75. | 18618 | 4.4% | 1.8%(+2.66)#75 | 2.1%(+2.35)#1,931 |
| 76. | 15427 | 4.4% | 1.8%(+2.60)#76 | 2.1%(+2.30)#1,977 |
| 77. | 18219 | 4.3% | 1.8%(+2.59)#77 | 2.1%(+2.28)#1,995 |
| 78. | 19107 | 4.3% | 1.8%(+2.59)#78 | 2.1%(+2.28)#1,997 |
| 79. | 16859 | 4.3% | 1.8%(+2.58)#79 | 2.1%(+2.27)#2,002 |
| 80. | 15483 | 4.3% | 1.8%(+2.56)#80 | 2.1%(+2.26)#2,021 |
| 81. | 15655 | 4.3% | 1.8%(+2.55)#81 | 2.1%(+2.24)#2,041 |
| 82. | 19085 | 4.3% | 1.8%(+2.53)#82 | 2.1%(+2.22)#2,064 |
| 83. | 19086 | 4.3% | 1.8%(+2.52)#83 | 2.1%(+2.22)#2,065 |
| 84. | 18325 | 4.2% | 1.8%(+2.49)#84 | 2.1%(+2.19)#2,093 |
| 85. | 16827 | 4.2% | 1.8%(+2.48)#85 | 2.1%(+2.17)#2,115 |
| 86. | 17355 | 4.1% | 1.8%(+2.31)#86 | 2.1%(+2.00)#2,294 |
| 87. | 19009 | 4.1% | 1.8%(+2.30)#87 | 2.1%(+1.99)#2,307 |
| 88. | 17565 | 4.0% | 1.8%(+2.28)#88 | 2.1%(+1.97)#2,336 |
| 89. | 19146 | 3.9% | 1.8%(+2.18)#89 | 2.1%(+1.87)#2,451 |
| 90. | 15120 | 3.9% | 1.8%(+2.17)#90 | 2.1%(+1.86)#2,474 |
| 91. | 17554 | 3.9% | 1.8%(+2.12)#91 | 2.1%(+1.82)#2,525 |
| 92. | 17520 | 3.9% | 1.8%(+2.12)#92 | 2.1%(+1.81)#2,532 |
| 93. | 19087 | 3.9% | 1.8%(+2.12)#93 | 2.1%(+1.81)#2,535 |
| 94. | 18902 | 3.8% | 1.8%(+2.06)#94 | 2.1%(+1.75)#2,614 |
| 95. | 15212 | 3.8% | 1.8%(+2.04)#95 | 2.1%(+1.73)#2,633 |
| 96. | 16415 | 3.8% | 1.8%(+2.03)#96 | 2.1%(+1.73)#2,644 |
| 97. | 17949 | 3.8% | 1.8%(+2.02)#97 | 2.1%(+1.71)#2,666 |
| 98. | 18085 | 3.8% | 1.8%(+2.01)#98 | 2.1%(+1.71)#2,670 |
| 99. | 16901 | 3.8% | 1.8%(+2.01)#99 | 2.1%(+1.70)#2,674 |
| 100. | 15202 | 3.7% | 1.8%(+1.99)#100 | 2.1%(+1.68)#2,706 |
Common Questions
What are the Top 10 Zip Codes with the Highest Percentage of Population Employed in Arts, Media & Entertainment in Pennsylvania?
Top 10 Zip Codes with the Highest Percentage of Population Employed in Arts, Media & Entertainment in Pennsylvania are:
What zip code has the Highest Percentage of Population Employed in Arts, Media & Entertainment in Pennsylvania?
18357 has the Highest Percentage of Population Employed in Arts, Media & Entertainment in Pennsylvania with 91.7%.
What is the Percentage of Population Employed in Arts, Media & Entertainment in the State of Pennsylvania?
Percentage of Population Employed in Arts, Media & Entertainment in Pennsylvania is 1.8%.
What is the Percentage of Population Employed in Arts, Media & Entertainment in the United States?
Percentage of Population Employed in Arts, Media & Entertainment in the United States is 2.1%.