Zip Codes with the Highest Percentage of Population Employed in Arts, Media & Entertainment in Nevada
RELATED REPORTS & OPTIONS
Arts, Media & Entertainment
Nevada
Compare Zip Codes
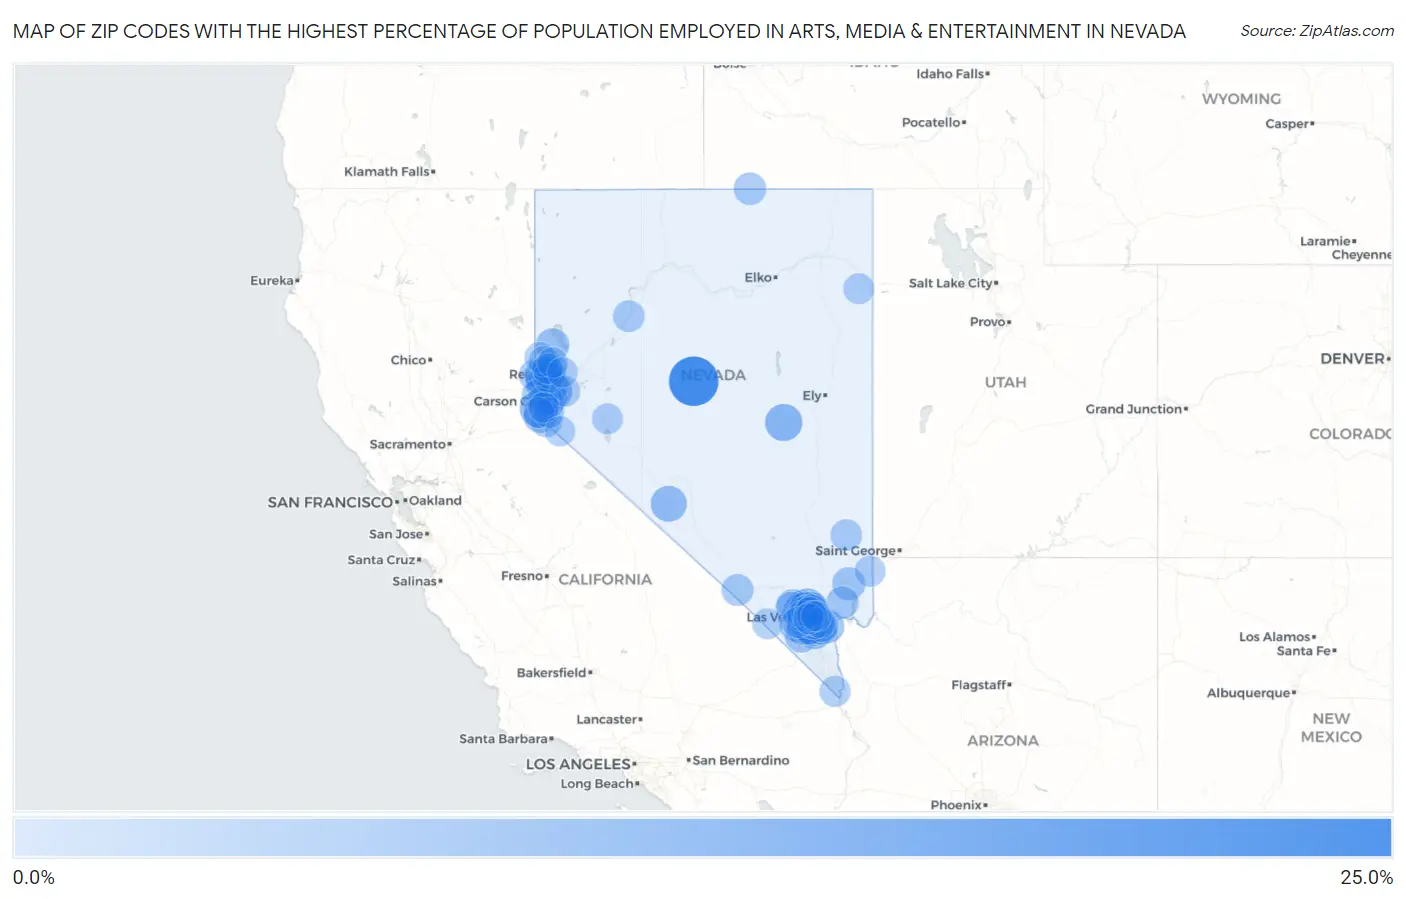
Map of Zip Codes with the Highest Percentage of Population Employed in Arts, Media & Entertainment in Nevada
0.0%
25.0%
Zip Codes with the Highest Percentage of Population Employed in Arts, Media & Entertainment in Nevada
| Zip Code | % Employed | vs State | vs National | |
| 1. | 89310 | 21.1% | 2.1%(+19.0)#1 | 2.1%(+19.0)#82 |
| 2. | 89413 | 8.5% | 2.1%(+6.40)#2 | 2.1%(+6.40)#494 |
| 3. | 89314 | 7.9% | 2.1%(+5.83)#3 | 2.1%(+5.83)#567 |
| 4. | 89440 | 7.5% | 2.1%(+5.49)#4 | 2.1%(+5.49)#636 |
| 5. | 89047 | 6.6% | 2.1%(+4.56)#5 | 2.1%(+4.56)#847 |
| 6. | 89085 | 6.3% | 2.1%(+4.21)#6 | 2.1%(+4.21)#935 |
| 7. | 89519 | 5.8% | 2.1%(+3.76)#7 | 2.1%(+3.76)#1,106 |
| 8. | 89014 | 5.1% | 2.1%(+3.01)#8 | 2.1%(+3.01)#1,463 |
| 9. | 89501 | 4.7% | 2.1%(+2.67)#9 | 2.1%(+2.67)#1,672 |
| 10. | 89118 | 4.6% | 2.1%(+2.57)#10 | 2.1%(+2.57)#1,748 |
| 11. | 89109 | 4.6% | 2.1%(+2.55)#11 | 2.1%(+2.55)#1,770 |
| 12. | 89004 | 4.2% | 2.1%(+2.10)#12 | 2.1%(+2.11)#2,172 |
| 13. | 89005 | 4.1% | 2.1%(+2.09)#13 | 2.1%(+2.09)#2,192 |
| 14. | 89044 | 4.1% | 2.1%(+2.01)#14 | 2.1%(+2.01)#2,285 |
| 15. | 89510 | 4.0% | 2.1%(+1.91)#15 | 2.1%(+1.91)#2,403 |
| 16. | 89158 | 3.8% | 2.1%(+1.69)#16 | 2.1%(+1.69)#2,684 |
| 17. | 89021 | 3.7% | 2.1%(+1.66)#17 | 2.1%(+1.66)#2,735 |
| 18. | 89134 | 3.7% | 2.1%(+1.65)#18 | 2.1%(+1.65)#2,744 |
| 19. | 89449 | 3.6% | 2.1%(+1.58)#19 | 2.1%(+1.58)#2,846 |
| 20. | 89179 | 3.4% | 2.1%(+1.33)#20 | 2.1%(+1.33)#3,266 |
| 21. | 89138 | 3.3% | 2.1%(+1.28)#21 | 2.1%(+1.28)#3,357 |
| 22. | 89144 | 3.3% | 2.1%(+1.28)#22 | 2.1%(+1.28)#3,359 |
| 23. | 89117 | 3.3% | 2.1%(+1.24)#23 | 2.1%(+1.24)#3,427 |
| 24. | 89012 | 3.2% | 2.1%(+1.17)#24 | 2.1%(+1.17)#3,548 |
| 25. | 89113 | 3.2% | 2.1%(+1.13)#25 | 2.1%(+1.13)#3,625 |
| 26. | 89128 | 3.2% | 2.1%(+1.12)#26 | 2.1%(+1.12)#3,647 |
| 27. | 89178 | 3.2% | 2.1%(+1.12)#27 | 2.1%(+1.12)#3,664 |
| 28. | 89832 | 3.1% | 2.1%(+1.01)#28 | 2.1%(+1.01)#3,909 |
| 29. | 89148 | 3.0% | 2.1%(+0.917)#29 | 2.1%(+0.918)#4,138 |
| 30. | 89139 | 2.9% | 2.1%(+0.883)#30 | 2.1%(+0.884)#4,218 |
| 31. | 89040 | 2.9% | 2.1%(+0.850)#31 | 2.1%(+0.851)#4,318 |
| 32. | 89123 | 2.9% | 2.1%(+0.815)#32 | 2.1%(+0.816)#4,405 |
| 33. | 89143 | 2.9% | 2.1%(+0.791)#33 | 2.1%(+0.792)#4,467 |
| 34. | 89146 | 2.8% | 2.1%(+0.766)#34 | 2.1%(+0.767)#4,540 |
| 35. | 89052 | 2.8% | 2.1%(+0.735)#35 | 2.1%(+0.735)#4,628 |
| 36. | 89074 | 2.8% | 2.1%(+0.707)#36 | 2.1%(+0.708)#4,704 |
| 37. | 89141 | 2.7% | 2.1%(+0.680)#37 | 2.1%(+0.680)#4,786 |
| 38. | 89086 | 2.7% | 2.1%(+0.643)#38 | 2.1%(+0.644)#4,887 |
| 39. | 89439 | 2.6% | 2.1%(+0.573)#39 | 2.1%(+0.574)#5,118 |
| 40. | 89119 | 2.6% | 2.1%(+0.563)#40 | 2.1%(+0.563)#5,156 |
| 41. | 89103 | 2.4% | 2.1%(+0.368)#41 | 2.1%(+0.369)#5,822 |
| 42. | 89002 | 2.4% | 2.1%(+0.358)#42 | 2.1%(+0.358)#5,867 |
| 43. | 89104 | 2.4% | 2.1%(+0.314)#43 | 2.1%(+0.315)#6,028 |
| 44. | 89149 | 2.4% | 2.1%(+0.307)#44 | 2.1%(+0.308)#6,059 |
| 45. | 89122 | 2.4% | 2.1%(+0.298)#45 | 2.1%(+0.299)#6,086 |
| 46. | 89020 | 2.4% | 2.1%(+0.293)#46 | 2.1%(+0.294)#6,108 |
| 47. | 89706 | 2.3% | 2.1%(+0.230)#47 | 2.1%(+0.231)#6,407 |
| 48. | 89509 | 2.3% | 2.1%(+0.206)#48 | 2.1%(+0.207)#6,520 |
| 49. | 89503 | 2.2% | 2.1%(+0.179)#49 | 2.1%(+0.179)#6,646 |
| 50. | 89460 | 2.2% | 2.1%(+0.161)#50 | 2.1%(+0.162)#6,711 |
| 51. | 89523 | 2.1% | 2.1%(+0.065)#51 | 2.1%(+0.066)#7,135 |
| 52. | 89084 | 2.1% | 2.1%(+0.057)#52 | 2.1%(+0.058)#7,180 |
| 53. | 89183 | 2.1% | 2.1%(+0.043)#53 | 2.1%(+0.043)#7,258 |
| 54. | 89419 | 2.1% | 2.1%(+0.041)#54 | 2.1%(+0.041)#7,271 |
| 55. | 89166 | 2.1% | 2.1%(+0.026)#55 | 2.1%(+0.027)#7,348 |
| 56. | 89147 | 2.1% | 2.1%(-0.004)#56 | 2.1%(-0.003)#7,507 |
| 57. | 89521 | 2.0% | 2.1%(-0.049)#57 | 2.1%(-0.048)#7,745 |
| 58. | 89124 | 2.0% | 2.1%(-0.088)#58 | 2.1%(-0.087)#7,961 |
| 59. | 89015 | 2.0% | 2.1%(-0.106)#59 | 2.1%(-0.105)#8,050 |
| 60. | 89008 | 1.9% | 2.1%(-0.114)#60 | 2.1%(-0.113)#8,097 |
| 61. | 89701 | 1.9% | 2.1%(-0.139)#61 | 2.1%(-0.138)#8,241 |
| 62. | 89031 | 1.9% | 2.1%(-0.142)#62 | 2.1%(-0.141)#8,255 |
| 63. | 89169 | 1.9% | 2.1%(-0.149)#63 | 2.1%(-0.148)#8,297 |
| 64. | 89511 | 1.9% | 2.1%(-0.169)#64 | 2.1%(-0.168)#8,421 |
| 65. | 89129 | 1.8% | 2.1%(-0.213)#65 | 2.1%(-0.213)#8,677 |
| 66. | 89107 | 1.8% | 2.1%(-0.226)#66 | 2.1%(-0.226)#8,764 |
| 67. | 89121 | 1.8% | 2.1%(-0.233)#67 | 2.1%(-0.232)#8,807 |
| 68. | 89108 | 1.8% | 2.1%(-0.237)#68 | 2.1%(-0.236)#8,828 |
| 69. | 89451 | 1.8% | 2.1%(-0.260)#69 | 2.1%(-0.260)#8,972 |
| 70. | 89512 | 1.8% | 2.1%(-0.265)#70 | 2.1%(-0.264)#8,992 |
| 71. | 89131 | 1.7% | 2.1%(-0.313)#71 | 2.1%(-0.312)#9,276 |
| 72. | 89120 | 1.7% | 2.1%(-0.316)#72 | 2.1%(-0.315)#9,298 |
| 73. | 89703 | 1.7% | 2.1%(-0.325)#73 | 2.1%(-0.324)#9,356 |
| 74. | 89436 | 1.7% | 2.1%(-0.368)#74 | 2.1%(-0.368)#9,675 |
| 75. | 89431 | 1.6% | 2.1%(-0.445)#75 | 2.1%(-0.444)#10,221 |
| 76. | 89130 | 1.6% | 2.1%(-0.468)#76 | 2.1%(-0.467)#10,381 |
| 77. | 89145 | 1.6% | 2.1%(-0.471)#77 | 2.1%(-0.471)#10,399 |
| 78. | 89135 | 1.5% | 2.1%(-0.514)#78 | 2.1%(-0.513)#10,670 |
| 79. | 89029 | 1.5% | 2.1%(-0.522)#79 | 2.1%(-0.521)#10,719 |
| 80. | 89081 | 1.5% | 2.1%(-0.527)#80 | 2.1%(-0.526)#10,751 |
| 81. | 89502 | 1.5% | 2.1%(-0.579)#81 | 2.1%(-0.578)#11,083 |
| 82. | 89011 | 1.5% | 2.1%(-0.586)#82 | 2.1%(-0.585)#11,148 |
| 83. | 89027 | 1.4% | 2.1%(-0.618)#83 | 2.1%(-0.617)#11,387 |
| 84. | 89032 | 1.4% | 2.1%(-0.631)#84 | 2.1%(-0.630)#11,485 |
| 85. | 89427 | 1.4% | 2.1%(-0.669)#85 | 2.1%(-0.668)#11,770 |
| 86. | 89508 | 1.3% | 2.1%(-0.722)#86 | 2.1%(-0.721)#12,161 |
| 87. | 89101 | 1.3% | 2.1%(-0.734)#87 | 2.1%(-0.733)#12,254 |
| 88. | 89102 | 1.3% | 2.1%(-0.747)#88 | 2.1%(-0.746)#12,342 |
| 89. | 89423 | 1.3% | 2.1%(-0.750)#89 | 2.1%(-0.749)#12,362 |
| 90. | 89883 | 1.3% | 2.1%(-0.771)#90 | 2.1%(-0.770)#12,522 |
| 91. | 89448 | 1.3% | 2.1%(-0.783)#91 | 2.1%(-0.782)#12,611 |
| 92. | 89403 | 1.3% | 2.1%(-0.786)#92 | 2.1%(-0.785)#12,636 |
| 93. | 89705 | 1.2% | 2.1%(-0.892)#93 | 2.1%(-0.891)#13,436 |
| 94. | 89506 | 1.1% | 2.1%(-0.951)#94 | 2.1%(-0.950)#13,908 |
| 95. | 89061 | 1.1% | 2.1%(-0.966)#95 | 2.1%(-0.966)#14,037 |
| 96. | 89433 | 0.99% | 2.1%(-1.07)#96 | 2.1%(-1.07)#14,858 |
| 97. | 89441 | 0.98% | 2.1%(-1.08)#97 | 2.1%(-1.08)#14,953 |
| 98. | 89110 | 0.93% | 2.1%(-1.13)#98 | 2.1%(-1.13)#15,416 |
| 99. | 89434 | 0.88% | 2.1%(-1.18)#99 | 2.1%(-1.18)#15,829 |
| 100. | 89410 | 0.86% | 2.1%(-1.20)#100 | 2.1%(-1.20)#15,965 |
1
2Common Questions
What are the Top 10 Zip Codes with the Highest Percentage of Population Employed in Arts, Media & Entertainment in Nevada?
Top 10 Zip Codes with the Highest Percentage of Population Employed in Arts, Media & Entertainment in Nevada are:
What zip code has the Highest Percentage of Population Employed in Arts, Media & Entertainment in Nevada?
89310 has the Highest Percentage of Population Employed in Arts, Media & Entertainment in Nevada with 21.1%.
What is the Percentage of Population Employed in Arts, Media & Entertainment in the State of Nevada?
Percentage of Population Employed in Arts, Media & Entertainment in Nevada is 2.1%.
What is the Percentage of Population Employed in Arts, Media & Entertainment in the United States?
Percentage of Population Employed in Arts, Media & Entertainment in the United States is 2.1%.