Minong, WI Map & Demographics
Minong Map
Minong Overview
$25,692
PER CAPITA INCOME
$66,250
AVG FAMILY INCOME
$29,545
AVG HOUSEHOLD INCOME
40.3%
WAGE / INCOME GAP [ % ]
59.7¢/ $1
WAGE / INCOME GAP [ $ ]
0.46
INEQUALITY / GINI INDEX
611
TOTAL POPULATION
253
MALE POPULATION
358
FEMALE POPULATION
70.67
MALES / 100 FEMALES
141.50
FEMALES / 100 MALES
47.5
MEDIAN AGE
2.9
AVG FAMILY SIZE
2.0
AVG HOUSEHOLD SIZE
230
LABOR FORCE [ PEOPLE ]
46.0%
PERCENT IN LABOR FORCE
3.0%
UNEMPLOYMENT RATE
Minong Zip Codes
Minong Area Codes
Income in Minong
Income Overview in Minong
Per Capita Income in Minong is $25,692, while median incomes of families and households are $66,250 and $29,545 respectively.
| Characteristic | Number | Measure |
| Per Capita Income | 611 | $25,692 |
| Median Family Income | 145 | $66,250 |
| Mean Family Income | 145 | $74,514 |
| Median Household Income | 306 | $29,545 |
| Mean Household Income | 306 | $50,127 |
| Income Deficit | 145 | $0 |
| Wage / Income Gap (%) | 611 | 40.30% |
| Wage / Income Gap ($) | 611 | 59.70¢ per $1 |
| Gini / Inequality Index | 611 | 0.46 |
Earnings by Sex in Minong
Average Earnings in Minong are $33,438, $40,481 for men and $24,167 for women, a difference of 40.3%.
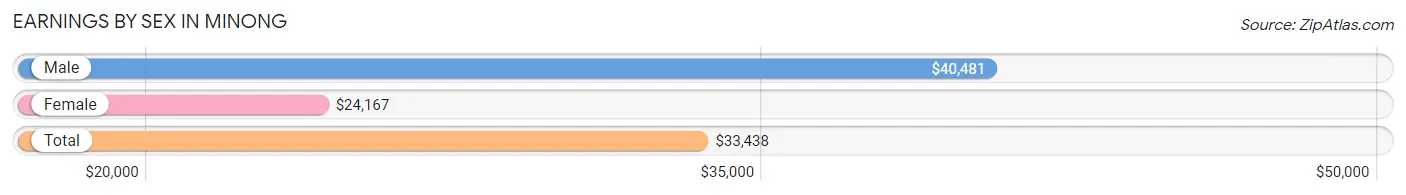
| Sex | Number | Average Earnings |
| Male | 101 (40.6%) | $40,481 |
| Female | 148 (59.4%) | $24,167 |
| Total | 249 (100.0%) | $33,438 |
Earnings by Sex by Income Bracket in Minong
The most common earnings brackets in Minong are $55,000 to $64,999 for men (20 | 19.8%) and $5,000 to $7,499 for women (31 | 20.9%).
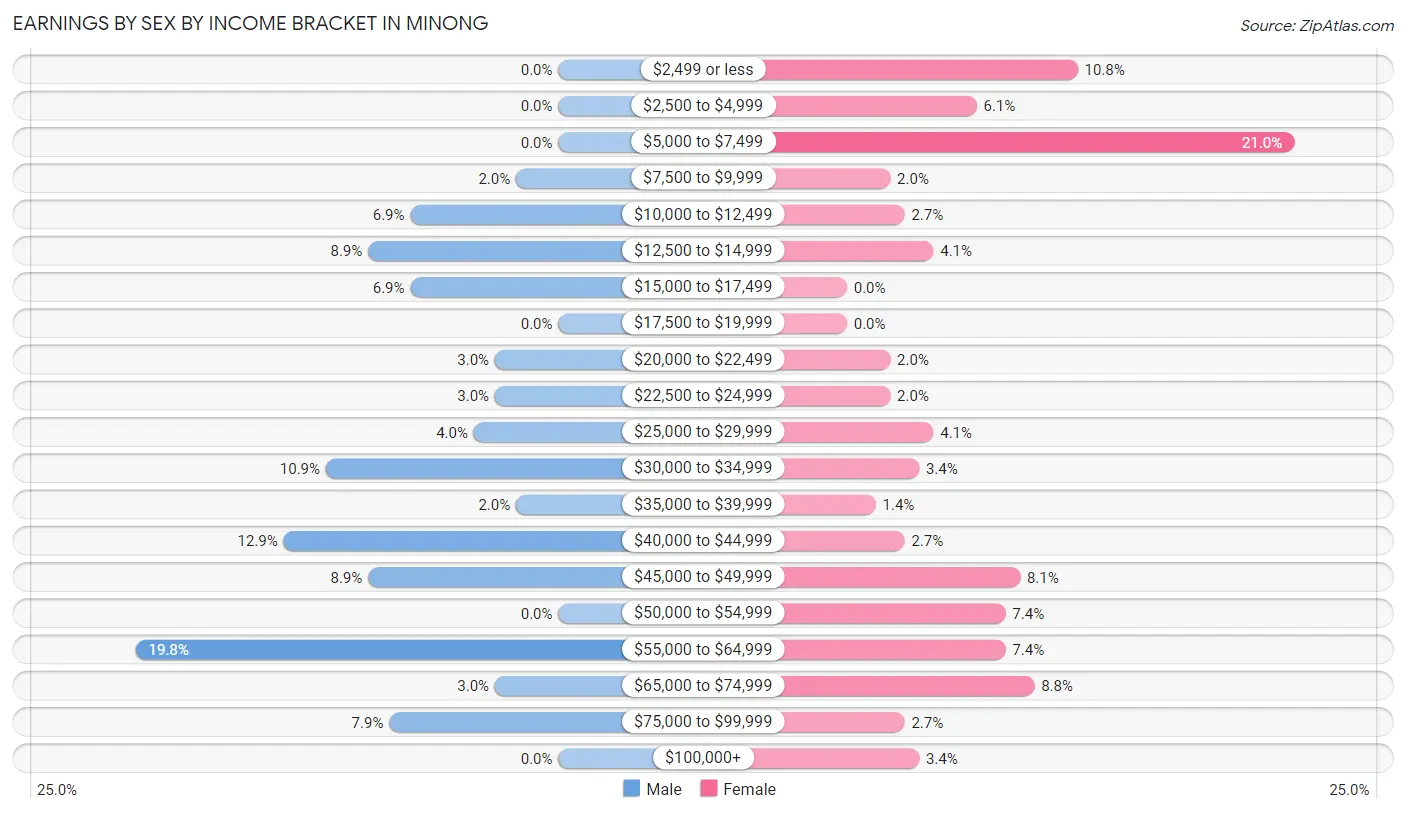
| Income | Male | Female |
| $2,499 or less | 0 (0.0%) | 16 (10.8%) |
| $2,500 to $4,999 | 0 (0.0%) | 9 (6.1%) |
| $5,000 to $7,499 | 0 (0.0%) | 31 (20.9%) |
| $7,500 to $9,999 | 2 (2.0%) | 3 (2.0%) |
| $10,000 to $12,499 | 7 (6.9%) | 4 (2.7%) |
| $12,500 to $14,999 | 9 (8.9%) | 6 (4.1%) |
| $15,000 to $17,499 | 7 (6.9%) | 0 (0.0%) |
| $17,500 to $19,999 | 0 (0.0%) | 0 (0.0%) |
| $20,000 to $22,499 | 3 (3.0%) | 3 (2.0%) |
| $22,500 to $24,999 | 3 (3.0%) | 3 (2.0%) |
| $25,000 to $29,999 | 4 (4.0%) | 6 (4.1%) |
| $30,000 to $34,999 | 11 (10.9%) | 5 (3.4%) |
| $35,000 to $39,999 | 2 (2.0%) | 2 (1.3%) |
| $40,000 to $44,999 | 13 (12.9%) | 4 (2.7%) |
| $45,000 to $49,999 | 9 (8.9%) | 12 (8.1%) |
| $50,000 to $54,999 | 0 (0.0%) | 11 (7.4%) |
| $55,000 to $64,999 | 20 (19.8%) | 11 (7.4%) |
| $65,000 to $74,999 | 3 (3.0%) | 13 (8.8%) |
| $75,000 to $99,999 | 8 (7.9%) | 4 (2.7%) |
| $100,000+ | 0 (0.0%) | 5 (3.4%) |
| Total | 101 (100.0%) | 148 (100.0%) |
Earnings by Sex by Educational Attainment in Minong
Average earnings in Minong are $40,769 for men and $46,111 for women, a difference of 11.6%. Men with an educational attainment of college or associate's degree enjoy the highest average annual earnings of $40,156, while those with high school diploma education earn the least with $34,688. Women with an educational attainment of graduate degree earn the most with the average annual earnings of $62,188, while those with high school diploma education have the smallest earnings of $34,250.
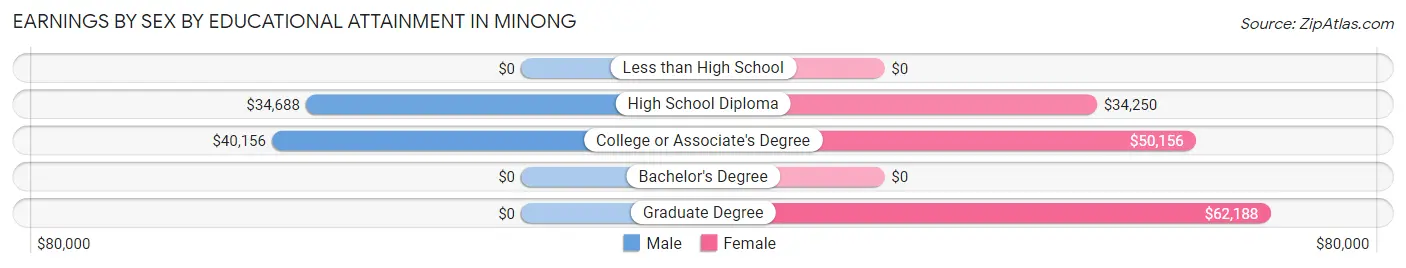
| Educational Attainment | Male Income | Female Income |
| Less than High School | - | - |
| High School Diploma | $34,688 | $34,250 |
| College or Associate's Degree | $40,156 | $50,156 |
| Bachelor's Degree | - | - |
| Graduate Degree | - | - |
| Total | $40,769 | $46,111 |
Family Income in Minong
Family Income Brackets in Minong
According to the Minong family income data, there are 29 families falling into the $25,000 to $34,999 income range, which is the most common income bracket and makes up 20.0% of all families. Conversely, the less than $10,000 income bracket is the least frequent group with only 3 families (2.1%) belonging to this category.
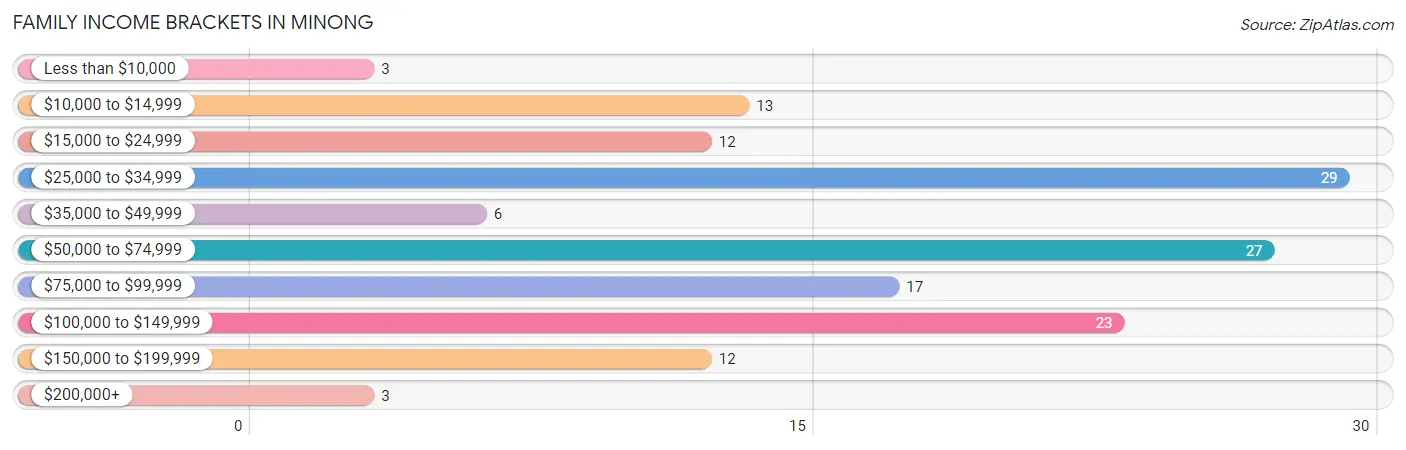
| Income Bracket | # Families | % Families |
| Less than $10,000 | 3 | 2.1% |
| $10,000 to $14,999 | 13 | 9.0% |
| $15,000 to $24,999 | 12 | 8.3% |
| $25,000 to $34,999 | 29 | 20.0% |
| $35,000 to $49,999 | 6 | 4.1% |
| $50,000 to $74,999 | 27 | 18.6% |
| $75,000 to $99,999 | 17 | 11.7% |
| $100,000 to $149,999 | 23 | 15.9% |
| $150,000 to $199,999 | 12 | 8.3% |
| $200,000+ | 3 | 2.1% |
Family Income by Famaliy Size in Minong
3-person families (50 | 34.5%) account for the highest median family income in Minong with $93,750 per family, while 2-person families (53 | 36.5%) have the highest median income of $33,660 per family member.
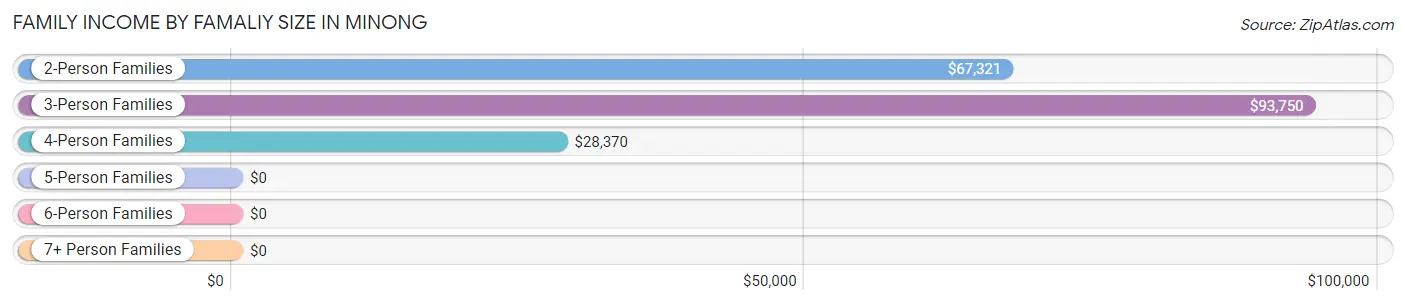
| Income Bracket | # Families | Median Income |
| 2-Person Families | 53 (36.5%) | $67,321 |
| 3-Person Families | 50 (34.5%) | $93,750 |
| 4-Person Families | 40 (27.6%) | $28,370 |
| 5-Person Families | 2 (1.4%) | $0 |
| 6-Person Families | 0 (0.0%) | $0 |
| 7+ Person Families | 0 (0.0%) | $0 |
| Total | 145 (100.0%) | $66,250 |
Family Income by Number of Earners in Minong
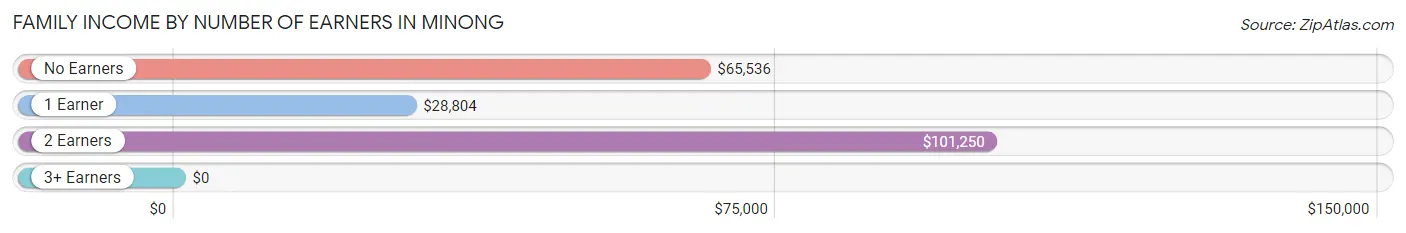
| Number of Earners | # Families | Median Income |
| No Earners | 13 (9.0%) | $65,536 |
| 1 Earner | 78 (53.8%) | $28,804 |
| 2 Earners | 47 (32.4%) | $101,250 |
| 3+ Earners | 7 (4.8%) | $0 |
| Total | 145 (100.0%) | $66,250 |
Household Income in Minong
Household Income Brackets in Minong
With 91 households falling in the category, the $25,000 to $34,999 income range is the most frequent in Minong, accounting for 29.7% of all households. In contrast, only 3 households (1.0%) fall into the $200,000+ income bracket, making it the least populous group.
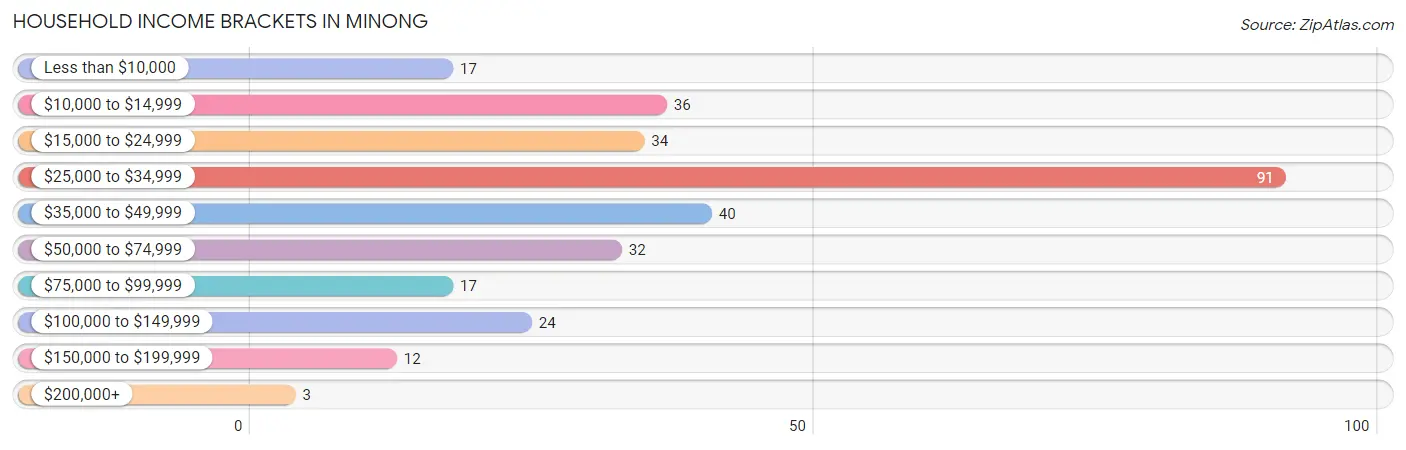
| Income Bracket | # Households | % Households |
| Less than $10,000 | 17 | 5.6% |
| $10,000 to $14,999 | 36 | 11.8% |
| $15,000 to $24,999 | 34 | 11.1% |
| $25,000 to $34,999 | 91 | 29.7% |
| $35,000 to $49,999 | 40 | 13.1% |
| $50,000 to $74,999 | 32 | 10.5% |
| $75,000 to $99,999 | 17 | 5.6% |
| $100,000 to $149,999 | 24 | 7.8% |
| $150,000 to $199,999 | 12 | 3.9% |
| $200,000+ | 3 | 1.0% |
Household Income by Householder Age in Minong
The median household income in Minong is $29,545, with the highest median household income of $45,750 found in the 45 to 64 years age bracket for the primary householder. A total of 81 households (26.5%) fall into this category. Meanwhile, the 15 to 24 years age bracket for the primary householder has the lowest median household income of $0, with 8 households (2.6%) in this group.
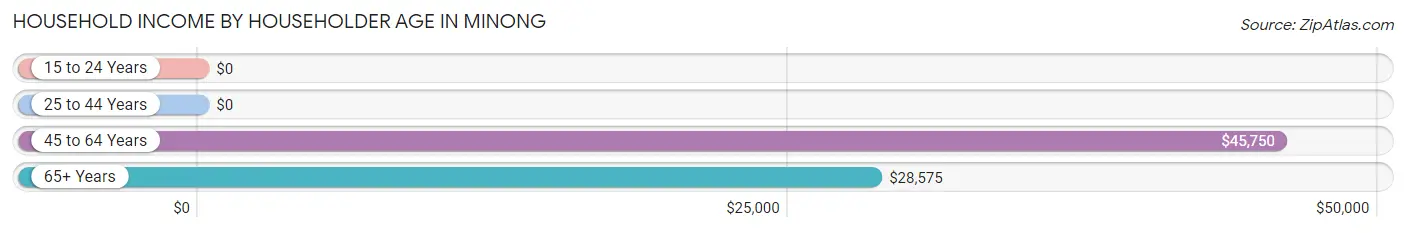
| Income Bracket | # Households | Median Income |
| 15 to 24 Years | 8 (2.6%) | $0 |
| 25 to 44 Years | 82 (26.8%) | $0 |
| 45 to 64 Years | 81 (26.5%) | $45,750 |
| 65+ Years | 135 (44.1%) | $28,575 |
| Total | 306 (100.0%) | $29,545 |
Poverty in Minong
Income Below Poverty by Sex and Age in Minong
With 31.6% poverty level for males and 37.4% for females among the residents of Minong, 15 year old males and 5 year old females are the most vulnerable to poverty, with 5 males (100.0%) and 3 females (100.0%) in their respective age groups living below the poverty level.
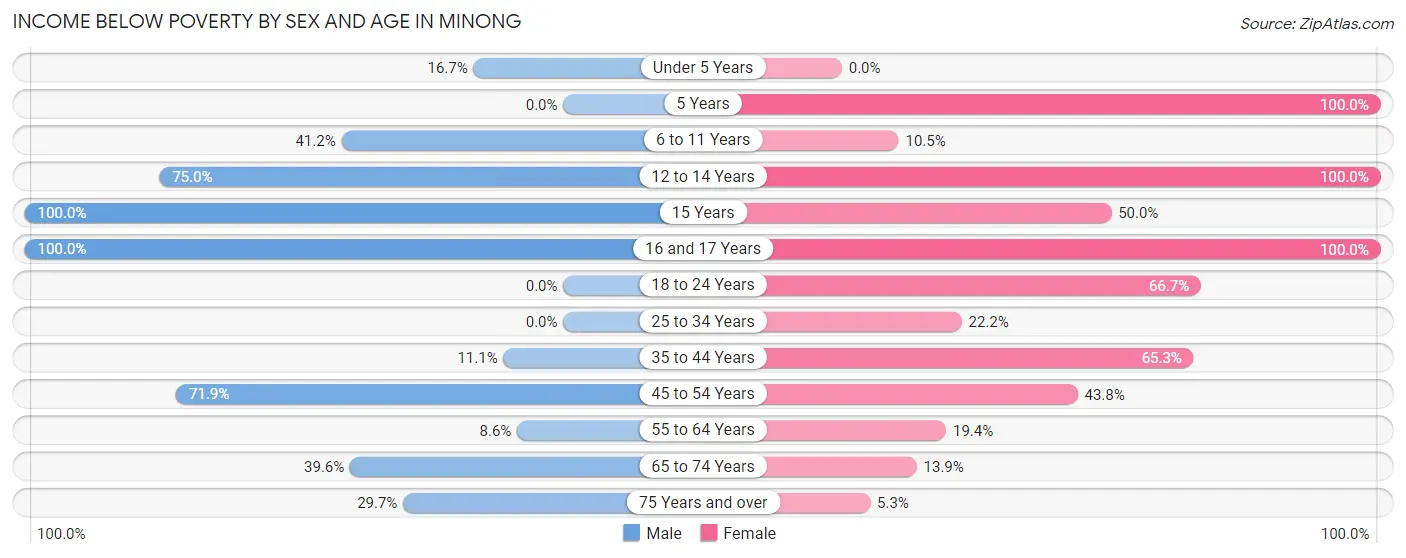
| Age Bracket | Male | Female |
| Under 5 Years | 4 (16.7%) | 0 (0.0%) |
| 5 Years | 0 (0.0%) | 3 (100.0%) |
| 6 to 11 Years | 7 (41.2%) | 2 (10.5%) |
| 12 to 14 Years | 3 (75.0%) | 27 (100.0%) |
| 15 Years | 5 (100.0%) | 3 (50.0%) |
| 16 and 17 Years | 2 (100.0%) | 4 (100.0%) |
| 18 to 24 Years | 0 (0.0%) | 28 (66.7%) |
| 25 to 34 Years | 0 (0.0%) | 6 (22.2%) |
| 35 to 44 Years | 3 (11.1%) | 32 (65.3%) |
| 45 to 54 Years | 23 (71.9%) | 14 (43.8%) |
| 55 to 64 Years | 3 (8.6%) | 6 (19.4%) |
| 65 to 74 Years | 19 (39.6%) | 5 (13.9%) |
| 75 Years and over | 11 (29.7%) | 4 (5.3%) |
| Total | 80 (31.6%) | 134 (37.4%) |
Income Above Poverty by Sex and Age in Minong
According to the poverty statistics in Minong, males aged 18 to 24 years and females aged under 5 years are the age groups that are most secure financially, with 100.0% of males and 100.0% of females in these age groups living above the poverty line.
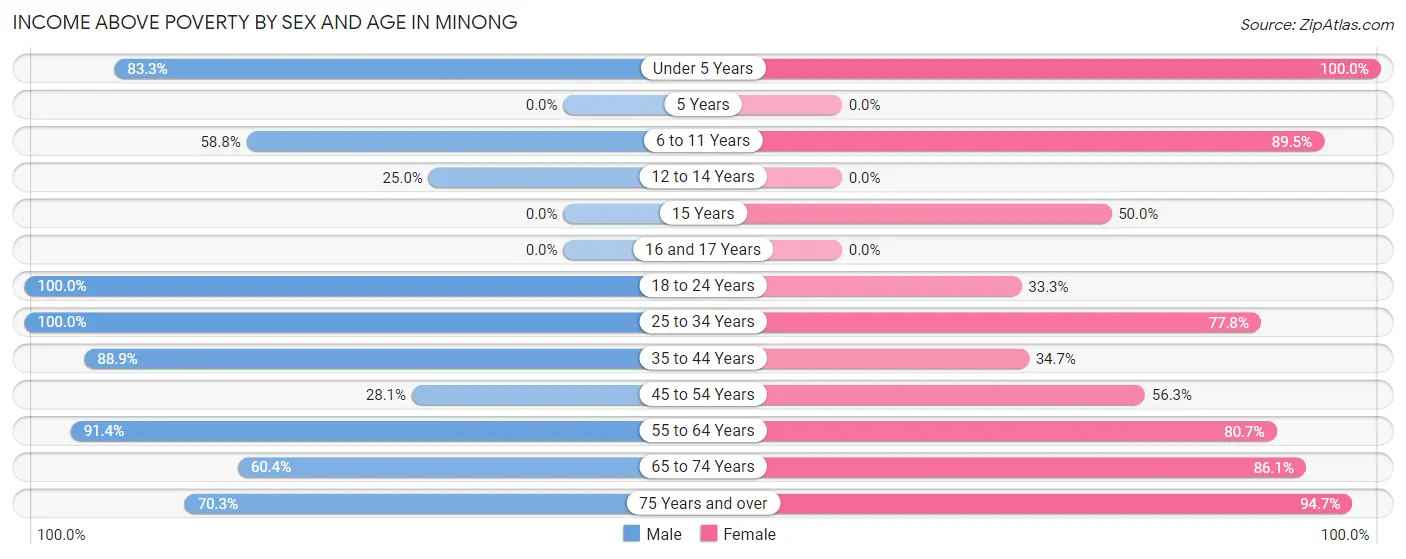
| Age Bracket | Male | Female |
| Under 5 Years | 20 (83.3%) | 6 (100.0%) |
| 5 Years | 0 (0.0%) | 0 (0.0%) |
| 6 to 11 Years | 10 (58.8%) | 17 (89.5%) |
| 12 to 14 Years | 1 (25.0%) | 0 (0.0%) |
| 15 Years | 0 (0.0%) | 3 (50.0%) |
| 16 and 17 Years | 0 (0.0%) | 0 (0.0%) |
| 18 to 24 Years | 3 (100.0%) | 14 (33.3%) |
| 25 to 34 Years | 19 (100.0%) | 21 (77.8%) |
| 35 to 44 Years | 24 (88.9%) | 17 (34.7%) |
| 45 to 54 Years | 9 (28.1%) | 18 (56.2%) |
| 55 to 64 Years | 32 (91.4%) | 25 (80.6%) |
| 65 to 74 Years | 29 (60.4%) | 31 (86.1%) |
| 75 Years and over | 26 (70.3%) | 72 (94.7%) |
| Total | 173 (68.4%) | 224 (62.6%) |
Income Below Poverty Among Married-Couple Families in Minong
The poverty statistics for married-couple families in Minong show that 33.3% or 40 of the total 120 families live below the poverty line. Families with 1 or 2 children have the highest poverty rate of 54.7%, comprising of 35 families. On the other hand, families with no children have the lowest poverty rate of 8.9%, which includes 5 families.
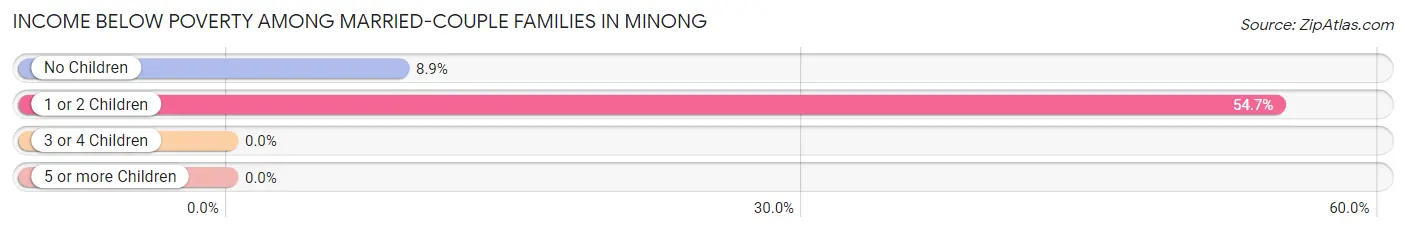
| Children | Above Poverty | Below Poverty |
| No Children | 51 (91.1%) | 5 (8.9%) |
| 1 or 2 Children | 29 (45.3%) | 35 (54.7%) |
| 3 or 4 Children | 0 (0.0%) | 0 (0.0%) |
| 5 or more Children | 0 (0.0%) | 0 (0.0%) |
| Total | 80 (66.7%) | 40 (33.3%) |
Income Below Poverty Among Single-Parent Households in Minong
According to the poverty data in Minong, 20.0% or 1 single-father households and 40.0% or 8 single-mother households are living below the poverty line. Among single-father households, those with 1 or 2 children have the highest poverty rate, with 1 households (25.0%) experiencing poverty. Likewise, among single-mother households, those with 3 or 4 children have the highest poverty rate, with 2 households (100.0%) falling below the poverty line.
| Children | Single Father | Single Mother |
| No Children | 0 (0.0%) | 0 (0.0%) |
| 1 or 2 Children | 1 (25.0%) | 6 (33.3%) |
| 3 or 4 Children | 0 (0.0%) | 2 (100.0%) |
| 5 or more Children | 0 (0.0%) | 0 (0.0%) |
| Total | 1 (20.0%) | 8 (40.0%) |
Income Below Poverty Among Married-Couple vs Single-Parent Households in Minong
The poverty data for Minong shows that 40 of the married-couple family households (33.3%) and 9 of the single-parent households (36.0%) are living below the poverty level. Within the married-couple family households, those with 1 or 2 children have the highest poverty rate, with 35 households (54.7%) falling below the poverty line. Among the single-parent households, those with 3 or 4 children have the highest poverty rate, with 2 household (100.0%) living below poverty.
| Children | Married-Couple Families | Single-Parent Households |
| No Children | 5 (8.9%) | 0 (0.0%) |
| 1 or 2 Children | 35 (54.7%) | 7 (31.8%) |
| 3 or 4 Children | 0 (0.0%) | 2 (100.0%) |
| 5 or more Children | 0 (0.0%) | 0 (0.0%) |
| Total | 40 (33.3%) | 9 (36.0%) |
Race in Minong
The most populous races in Minong are White / Caucasian (534 | 87.4%), Two or more Races (34 | 5.6%), and Asian (16 | 2.6%).
| Race | # Population | % Population |
| Asian | 16 | 2.6% |
| Black / African American | 13 | 2.1% |
| Hawaiian / Pacific | 0 | 0.0% |
| Hispanic or Latino | 10 | 1.6% |
| Native / Alaskan | 5 | 0.8% |
| White / Caucasian | 534 | 87.4% |
| Two or more Races | 34 | 5.6% |
| Some other Race | 9 | 1.5% |
| Total | 611 | 100.0% |
Ancestry in Minong
The most populous ancestries reported in Minong are German (191 | 31.3%), Swedish (79 | 12.9%), Irish (53 | 8.7%), Norwegian (44 | 7.2%), and Polish (33 | 5.4%), together accounting for 65.5% of all Minong residents.
| Ancestry | # Population | % Population |
| American | 11 | 1.8% |
| Bangladeshi | 2 | 0.3% |
| Bhutanese | 6 | 1.0% |
| Chippewa | 8 | 1.3% |
| Czech | 10 | 1.6% |
| Czechoslovakian | 1 | 0.2% |
| Danish | 11 | 1.8% |
| Dutch | 8 | 1.3% |
| English | 23 | 3.8% |
| European | 2 | 0.3% |
| Finnish | 31 | 5.1% |
| French | 5 | 0.8% |
| French Canadian | 11 | 1.8% |
| German | 191 | 31.3% |
| Greek | 2 | 0.3% |
| Hungarian | 12 | 2.0% |
| Irish | 53 | 8.7% |
| Italian | 32 | 5.2% |
| Korean | 16 | 2.6% |
| Liberian | 6 | 1.0% |
| Mexican | 8 | 1.3% |
| Norwegian | 44 | 7.2% |
| Polish | 33 | 5.4% |
| Potawatomi | 15 | 2.5% |
| Romanian | 1 | 0.2% |
| Russian | 13 | 2.1% |
| Scandinavian | 8 | 1.3% |
| Serbian | 2 | 0.3% |
| Slavic | 2 | 0.3% |
| Spaniard | 2 | 0.3% |
| Subsaharan African | 6 | 1.0% |
| Swedish | 79 | 12.9% | View All 32 Rows |
Immigrants in Minong
The most numerous immigrant groups reported in Minong came from Asia (16 | 2.6%), Philippines (16 | 2.6%), South Eastern Asia (16 | 2.6%), Central America (9 | 1.5%), and Europe (9 | 1.5%), together accounting for 10.8% of all Minong residents.
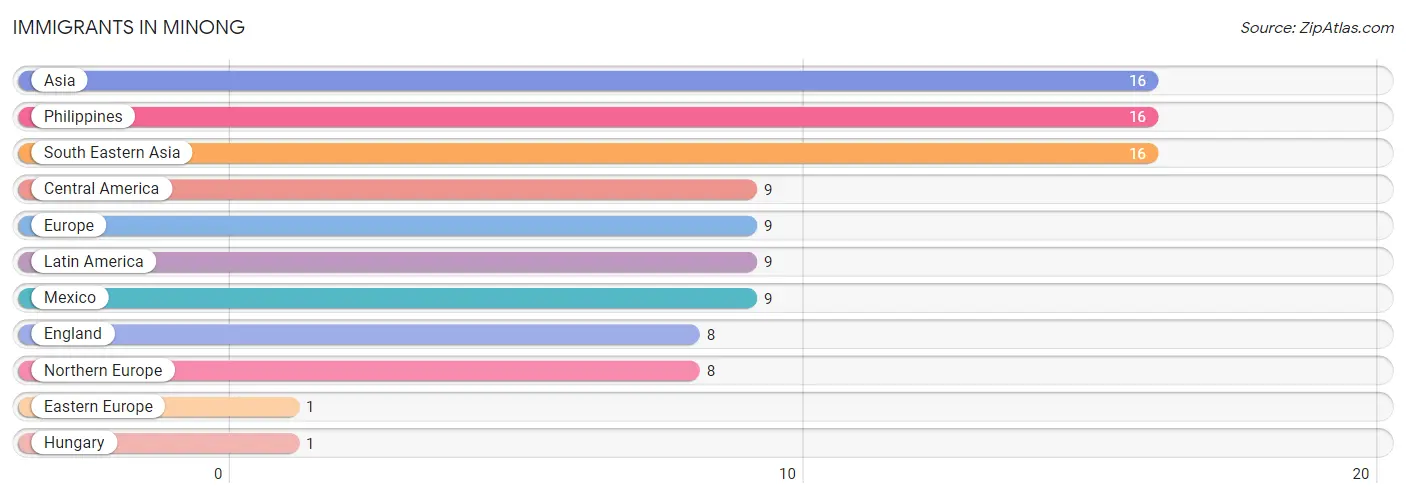
| Immigration Origin | # Population | % Population |
| Asia | 16 | 2.6% |
| Central America | 9 | 1.5% |
| Eastern Europe | 1 | 0.2% |
| England | 8 | 1.3% |
| Europe | 9 | 1.5% |
| Hungary | 1 | 0.2% |
| Latin America | 9 | 1.5% |
| Mexico | 9 | 1.5% |
| Northern Europe | 8 | 1.3% |
| Philippines | 16 | 2.6% |
| South Eastern Asia | 16 | 2.6% | View All 11 Rows |
Sex and Age in Minong
Sex and Age in Minong
The most populous age groups in Minong are 65 to 69 Years (39 | 15.4%) for men and 85 Years and over (54 | 15.1%) for women.
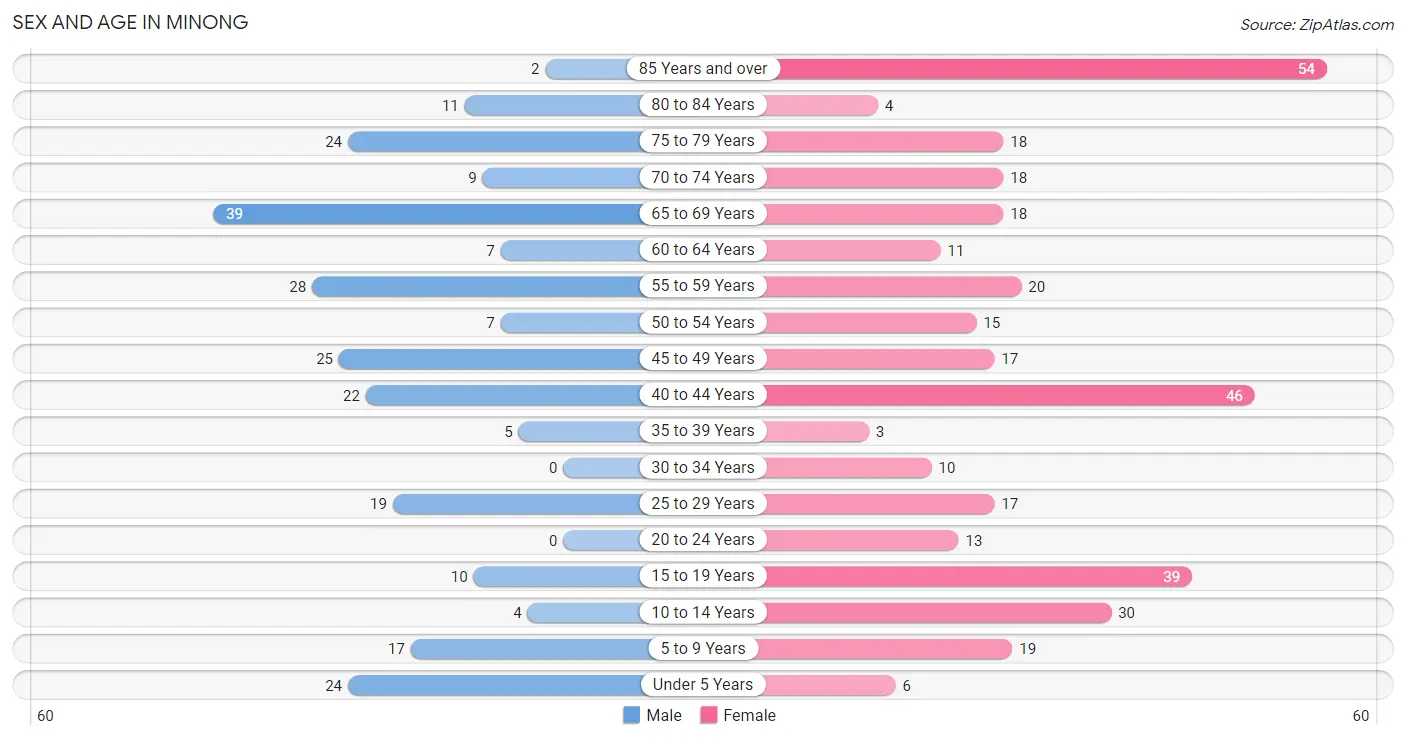
| Age Bracket | Male | Female |
| Under 5 Years | 24 (9.5%) | 6 (1.7%) |
| 5 to 9 Years | 17 (6.7%) | 19 (5.3%) |
| 10 to 14 Years | 4 (1.6%) | 30 (8.4%) |
| 15 to 19 Years | 10 (4.0%) | 39 (10.9%) |
| 20 to 24 Years | 0 (0.0%) | 13 (3.6%) |
| 25 to 29 Years | 19 (7.5%) | 17 (4.8%) |
| 30 to 34 Years | 0 (0.0%) | 10 (2.8%) |
| 35 to 39 Years | 5 (2.0%) | 3 (0.8%) |
| 40 to 44 Years | 22 (8.7%) | 46 (12.9%) |
| 45 to 49 Years | 25 (9.9%) | 17 (4.8%) |
| 50 to 54 Years | 7 (2.8%) | 15 (4.2%) |
| 55 to 59 Years | 28 (11.1%) | 20 (5.6%) |
| 60 to 64 Years | 7 (2.8%) | 11 (3.1%) |
| 65 to 69 Years | 39 (15.4%) | 18 (5.0%) |
| 70 to 74 Years | 9 (3.6%) | 18 (5.0%) |
| 75 to 79 Years | 24 (9.5%) | 18 (5.0%) |
| 80 to 84 Years | 11 (4.3%) | 4 (1.1%) |
| 85 Years and over | 2 (0.8%) | 54 (15.1%) |
| Total | 253 (100.0%) | 358 (100.0%) |
Families and Households in Minong
Median Family Size in Minong
The median family size in Minong is 2.94 persons per family, with single female/mother families (20 | 13.8%) accounting for the largest median family size of 3.35 persons per family. On the other hand, single male/father families (5 | 3.5%) represent the smallest median family size with 2.40 persons per family.
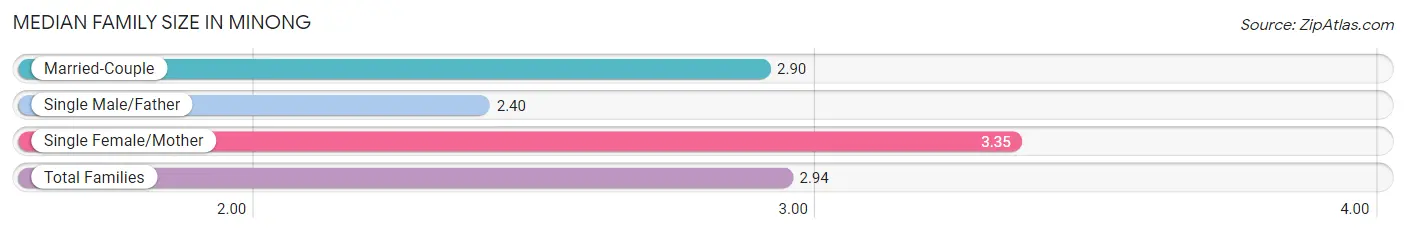
| Family Type | # Families | Family Size |
| Married-Couple | 120 (82.8%) | 2.90 |
| Single Male/Father | 5 (3.5%) | 2.40 |
| Single Female/Mother | 20 (13.8%) | 3.35 |
| Total Families | 145 (100.0%) | 2.94 |
Median Household Size in Minong
The median household size in Minong is 2.00 persons per household, with single female/mother households (20 | 6.5%) accounting for the largest median household size of 3.35 persons per household. non-family households (161 | 52.6%) represent the smallest median household size with 1.14 persons per household.
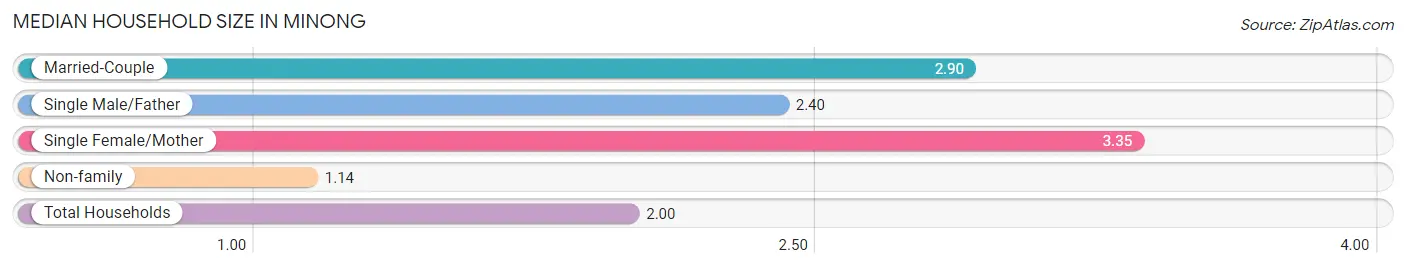
| Household Type | # Households | Household Size |
| Married-Couple | 120 (39.2%) | 2.90 |
| Single Male/Father | 5 (1.6%) | 2.40 |
| Single Female/Mother | 20 (6.5%) | 3.35 |
| Non-family | 161 (52.6%) | 1.14 |
| Total Households | 306 (100.0%) | 2.00 |
Household Size by Marriage Status in Minong
Out of a total of 306 households in Minong, 145 (47.4%) are family households, while 161 (52.6%) are nonfamily households. The most numerous type of family households are 2-person households, comprising 53, and the most common type of nonfamily households are 1-person households, comprising 148.
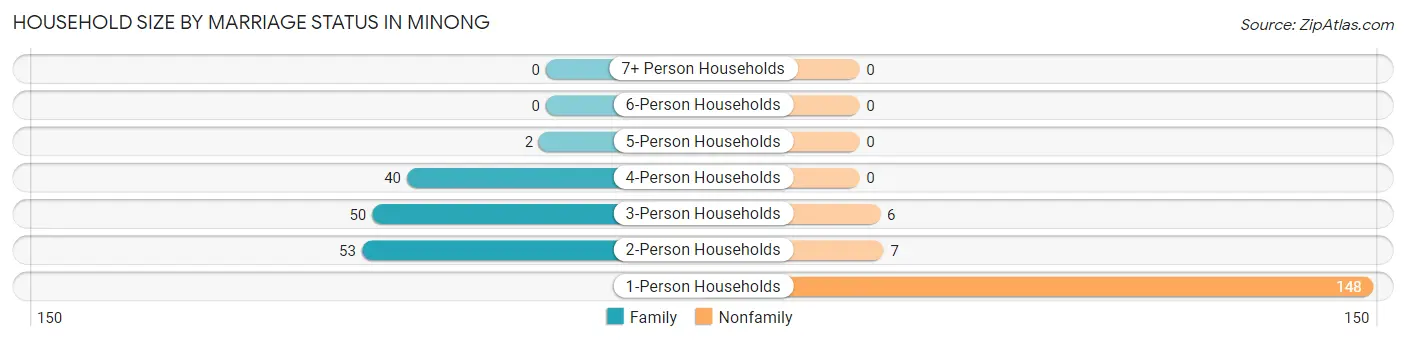
| Household Size | Family Households | Nonfamily Households |
| 1-Person Households | - | 148 (48.4%) |
| 2-Person Households | 53 (17.3%) | 7 (2.3%) |
| 3-Person Households | 50 (16.3%) | 6 (2.0%) |
| 4-Person Households | 40 (13.1%) | 0 (0.0%) |
| 5-Person Households | 2 (0.6%) | 0 (0.0%) |
| 6-Person Households | 0 (0.0%) | 0 (0.0%) |
| 7+ Person Households | 0 (0.0%) | 0 (0.0%) |
| Total | 145 (47.4%) | 161 (52.6%) |
Female Fertility in Minong
Fertility by Age in Minong
Average fertility rate in Minong is 54.0 births per 1,000 women. Women in the age bracket of 20 to 34 years have the highest fertility rate with 200.0 births per 1,000 women. Women in the age bracket of 20 to 34 years acount for 100.0% of all women with births.
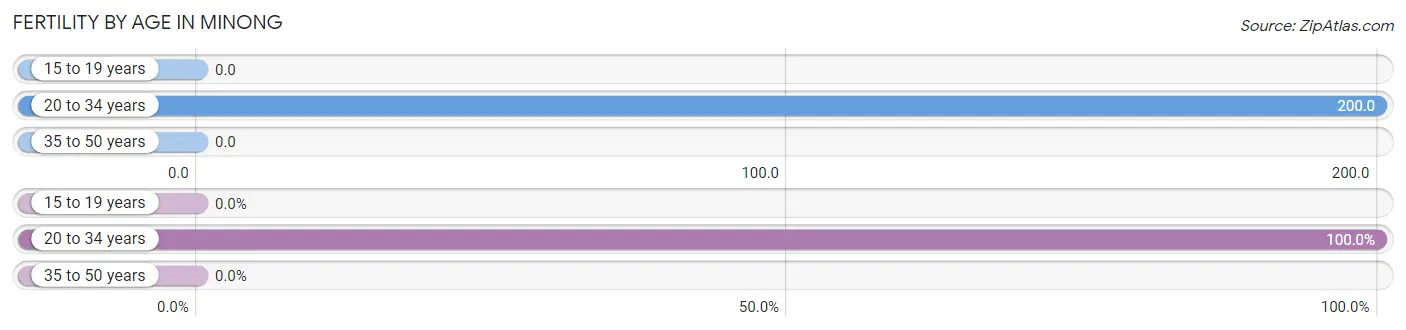
| Age Bracket | Women with Births | Births / 1,000 Women |
| 15 to 19 years | 0 (0.0%) | 0.0 |
| 20 to 34 years | 8 (100.0%) | 200.0 |
| 35 to 50 years | 0 (0.0%) | 0.0 |
| Total | 8 (100.0%) | 54.0 |
Fertility by Age by Marriage Status in Minong
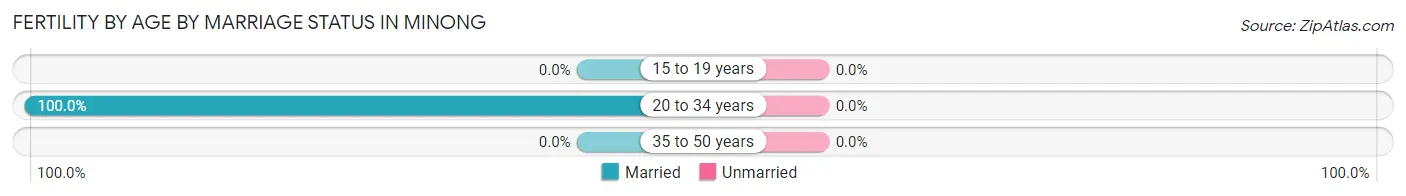
| Age Bracket | Married | Unmarried |
| 15 to 19 years | 0 (0.0%) | 0 (0.0%) |
| 20 to 34 years | 8 (100.0%) | 0 (0.0%) |
| 35 to 50 years | 0 (0.0%) | 0 (0.0%) |
| Total | 8 (100.0%) | 0 (0.0%) |
Fertility by Education in Minong
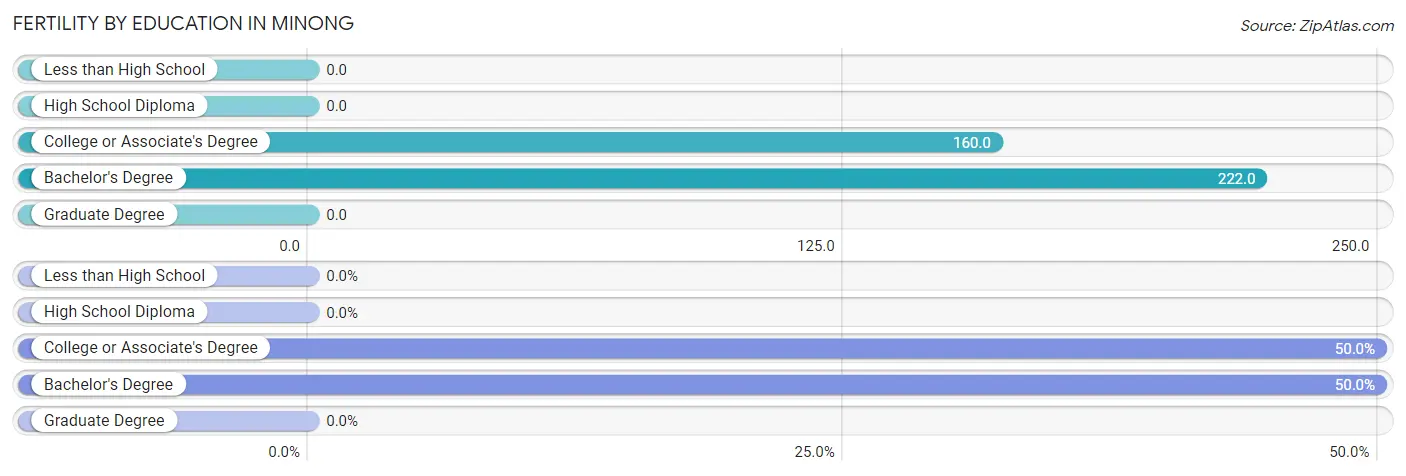
| Educational Attainment | Women with Births | Births / 1,000 Women |
| Less than High School | 0 (0.0%) | 0.0 |
| High School Diploma | 0 (0.0%) | 0.0 |
| College or Associate's Degree | 4 (50.0%) | 160.0 |
| Bachelor's Degree | 4 (50.0%) | 222.0 |
| Graduate Degree | 0 (0.0%) | 0.0 |
| Total | 8 (100.0%) | 54.0 |
Fertility by Education by Marriage Status in Minong
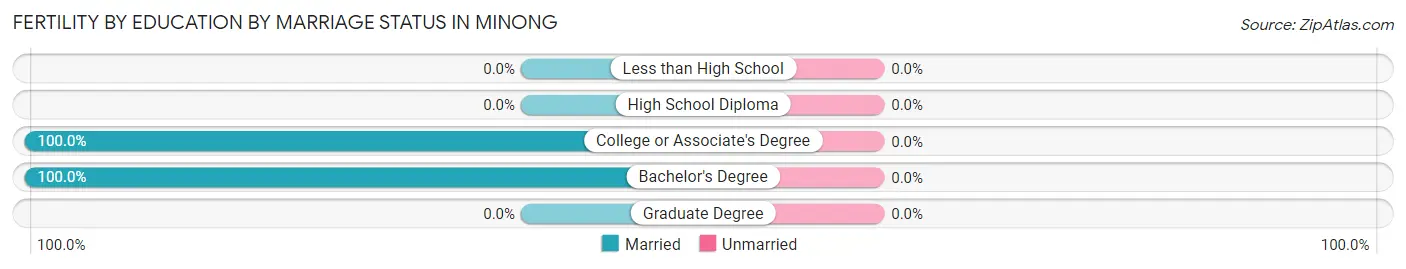
| Educational Attainment | Married | Unmarried |
| Less than High School | 0 (0.0%) | 0 (0.0%) |
| High School Diploma | 0 (0.0%) | 0 (0.0%) |
| College or Associate's Degree | 4 (100.0%) | 0 (0.0%) |
| Bachelor's Degree | 4 (100.0%) | 0 (0.0%) |
| Graduate Degree | 0 (0.0%) | 0 (0.0%) |
| Total | 8 (100.0%) | 0 (0.0%) |
Employment Characteristics in Minong
Employment by Class of Employer in Minong
Among the 221 employed individuals in Minong, private company employees (169 | 76.5%), not-for-profit organizations (22 | 10.0%), and local government employees (14 | 6.3%) make up the most common classes of employment.
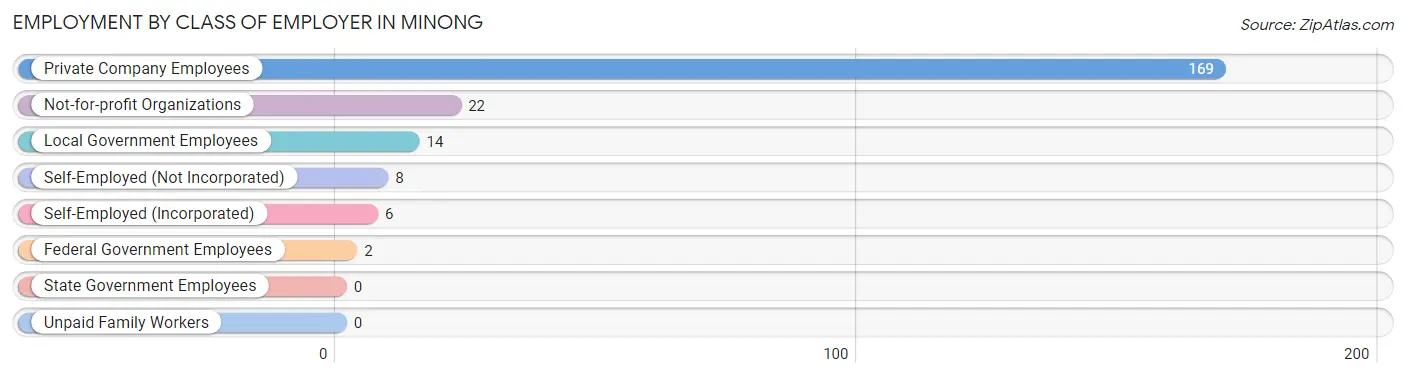
| Employer Class | # Employees | % Employees |
| Private Company Employees | 169 | 76.5% |
| Self-Employed (Incorporated) | 6 | 2.7% |
| Self-Employed (Not Incorporated) | 8 | 3.6% |
| Not-for-profit Organizations | 22 | 10.0% |
| Local Government Employees | 14 | 6.3% |
| State Government Employees | 0 | 0.0% |
| Federal Government Employees | 2 | 0.9% |
| Unpaid Family Workers | 0 | 0.0% |
| Total | 221 | 100.0% |
Employment Status by Age in Minong
According to the labor force statistics for Minong, out of the total population over 16 years of age (500), 46.0% or 230 individuals are in the labor force, with 3.0% or 7 of them unemployed. The age group with the highest labor force participation rate is 30 to 34 years, with 100.0% or 10 individuals in the labor force. Within the labor force, the 16 to 19 years age range has the highest percentage of unemployed individuals, with 19.4% or 7 of them being unemployed.
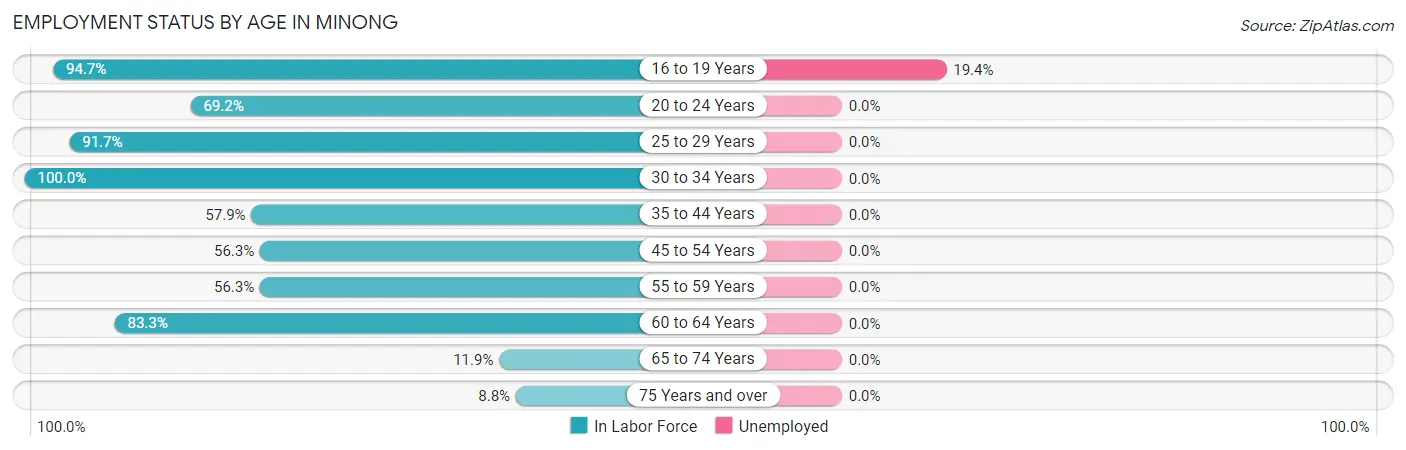
| Age Bracket | In Labor Force | Unemployed |
| 16 to 19 Years | 36 (94.7%) | 7 (19.4%) |
| 20 to 24 Years | 9 (69.2%) | 0 (0.0%) |
| 25 to 29 Years | 33 (91.7%) | 0 (0.0%) |
| 30 to 34 Years | 10 (100.0%) | 0 (0.0%) |
| 35 to 44 Years | 44 (57.9%) | 0 (0.0%) |
| 45 to 54 Years | 36 (56.3%) | 0 (0.0%) |
| 55 to 59 Years | 27 (56.3%) | 0 (0.0%) |
| 60 to 64 Years | 15 (83.3%) | 0 (0.0%) |
| 65 to 74 Years | 10 (11.9%) | 0 (0.0%) |
| 75 Years and over | 10 (8.8%) | 0 (0.0%) |
| Total | 230 (46.0%) | 7 (3.0%) |
Employment Status by Educational Attainment in Minong
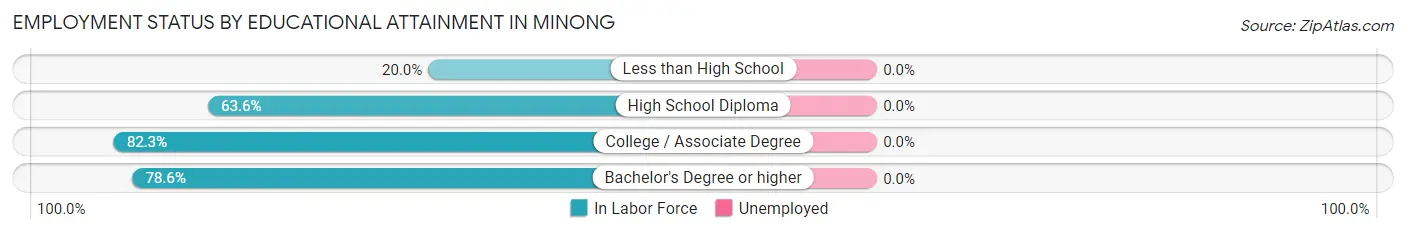
| Educational Attainment | In Labor Force | Unemployed |
| Less than High School | 7 (20.0%) | 0 (0.0%) |
| High School Diploma | 63 (63.6%) | 0 (0.0%) |
| College / Associate Degree | 51 (82.3%) | 0 (0.0%) |
| Bachelor's Degree or higher | 44 (78.6%) | 0 (0.0%) |
| Total | 165 (65.5%) | 0 (0.0%) |
Employment Occupations by Sex in Minong
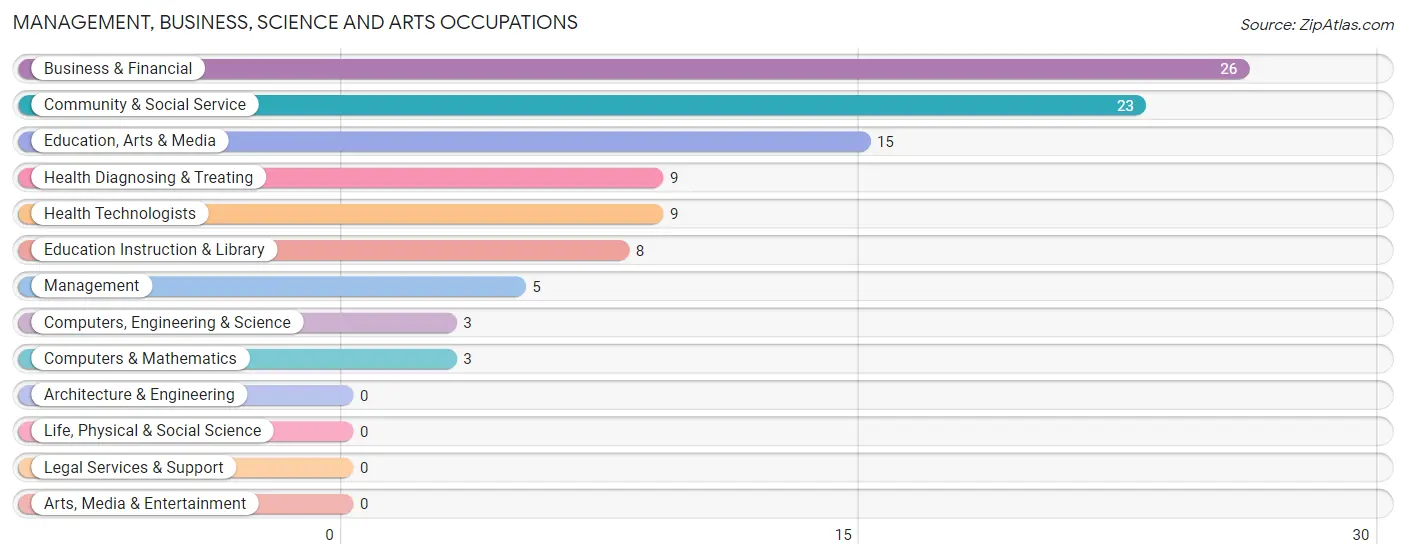
Management, Business, Science and Arts Occupations
The most common Management, Business, Science and Arts occupations in Minong are Business & Financial (26 | 11.7%), Community & Social Service (23 | 10.3%), Education, Arts & Media (15 | 6.7%), Health Diagnosing & Treating (9 | 4.0%), and Health Technologists (9 | 4.0%).
Management, Business, Science and Arts Occupations by Sex
Within the Management, Business, Science and Arts occupations in Minong, the most male-oriented occupations are Computers, Engineering & Science (100.0%), Computers & Mathematics (100.0%), and Education, Arts & Media (53.3%), while the most female-oriented occupations are Management (100.0%), Health Diagnosing & Treating (100.0%), and Health Technologists (100.0%).
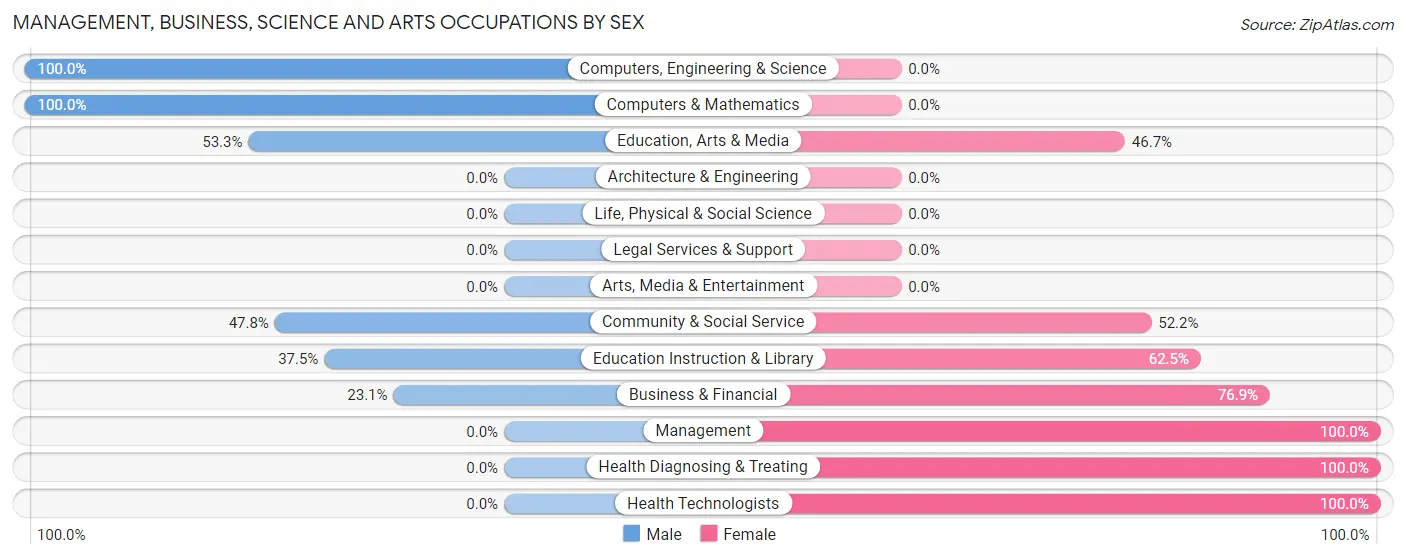
| Occupation | Male | Female |
| Management | 0 (0.0%) | 5 (100.0%) |
| Business & Financial | 6 (23.1%) | 20 (76.9%) |
| Computers, Engineering & Science | 3 (100.0%) | 0 (0.0%) |
| Computers & Mathematics | 3 (100.0%) | 0 (0.0%) |
| Architecture & Engineering | 0 (0.0%) | 0 (0.0%) |
| Life, Physical & Social Science | 0 (0.0%) | 0 (0.0%) |
| Community & Social Service | 11 (47.8%) | 12 (52.2%) |
| Education, Arts & Media | 8 (53.3%) | 7 (46.7%) |
| Legal Services & Support | 0 (0.0%) | 0 (0.0%) |
| Education Instruction & Library | 3 (37.5%) | 5 (62.5%) |
| Arts, Media & Entertainment | 0 (0.0%) | 0 (0.0%) |
| Health Diagnosing & Treating | 0 (0.0%) | 9 (100.0%) |
| Health Technologists | 0 (0.0%) | 9 (100.0%) |
| Total (Category) | 20 (30.3%) | 46 (69.7%) |
| Total (Overall) | 93 (41.7%) | 130 (58.3%) |
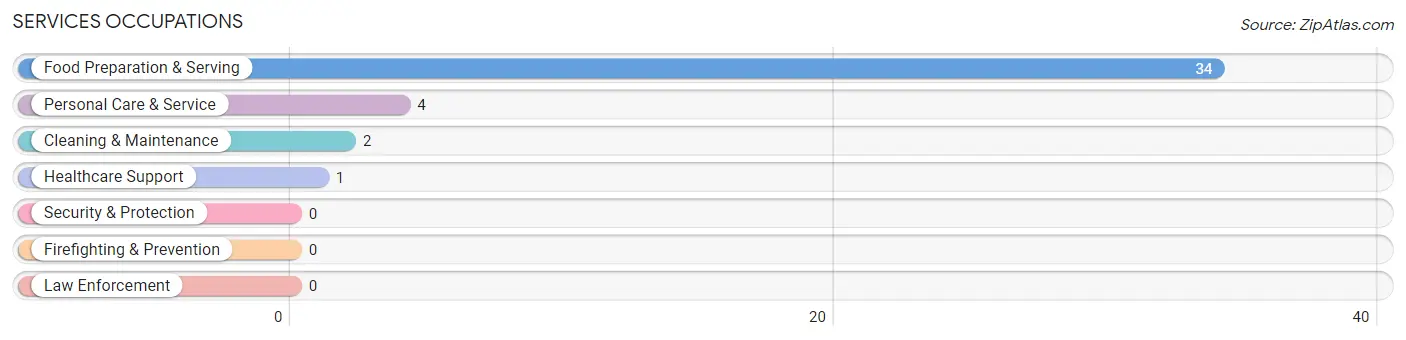
Services Occupations
The most common Services occupations in Minong are Food Preparation & Serving (34 | 15.2%), Personal Care & Service (4 | 1.8%), Cleaning & Maintenance (2 | 0.9%), and Healthcare Support (1 | 0.4%).
Services Occupations by Sex
Within the Services occupations in Minong, the most male-oriented occupations are Healthcare Support (100.0%), and Food Preparation & Serving (8.8%), while the most female-oriented occupations are Cleaning & Maintenance (100.0%), Personal Care & Service (100.0%), and Food Preparation & Serving (91.2%).
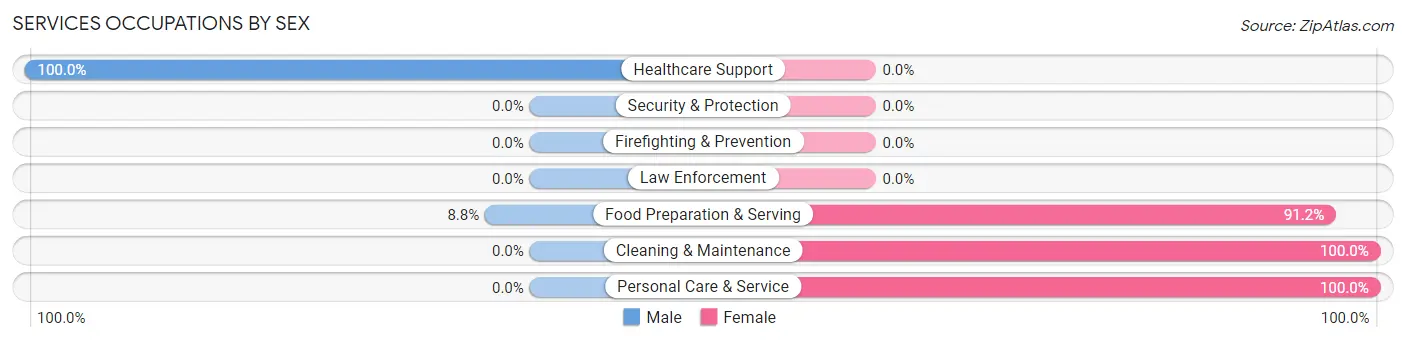
| Occupation | Male | Female |
| Healthcare Support | 1 (100.0%) | 0 (0.0%) |
| Security & Protection | 0 (0.0%) | 0 (0.0%) |
| Firefighting & Prevention | 0 (0.0%) | 0 (0.0%) |
| Law Enforcement | 0 (0.0%) | 0 (0.0%) |
| Food Preparation & Serving | 3 (8.8%) | 31 (91.2%) |
| Cleaning & Maintenance | 0 (0.0%) | 2 (100.0%) |
| Personal Care & Service | 0 (0.0%) | 4 (100.0%) |
| Total (Category) | 4 (9.8%) | 37 (90.2%) |
| Total (Overall) | 93 (41.7%) | 130 (58.3%) |
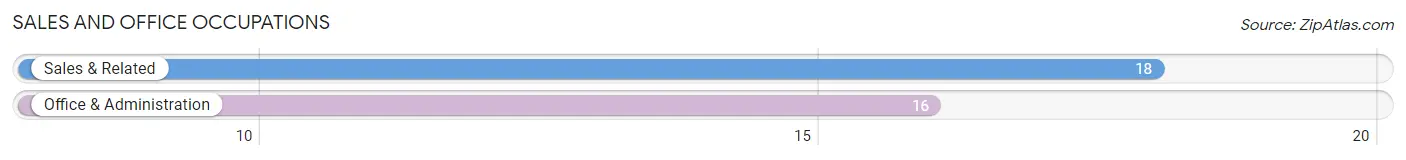
Sales and Office Occupations
The most common Sales and Office occupations in Minong are Sales & Related (18 | 8.1%), and Office & Administration (16 | 7.2%).
Sales and Office Occupations by Sex
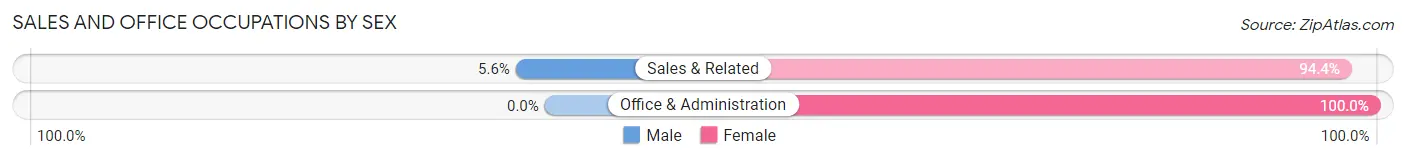
| Occupation | Male | Female |
| Sales & Related | 1 (5.6%) | 17 (94.4%) |
| Office & Administration | 0 (0.0%) | 16 (100.0%) |
| Total (Category) | 1 (2.9%) | 33 (97.1%) |
| Total (Overall) | 93 (41.7%) | 130 (58.3%) |
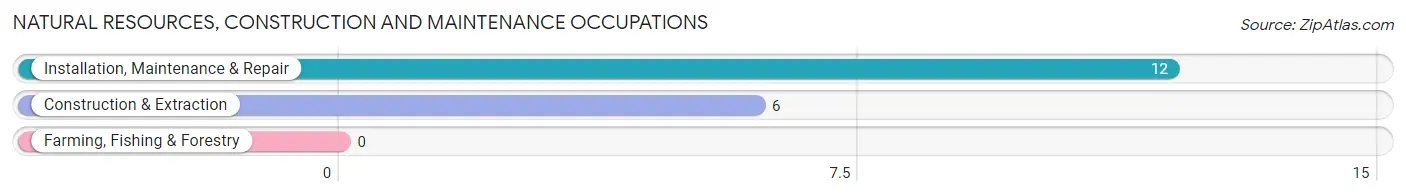
Natural Resources, Construction and Maintenance Occupations
The most common Natural Resources, Construction and Maintenance occupations in Minong are Installation, Maintenance & Repair (12 | 5.4%), and Construction & Extraction (6 | 2.7%).
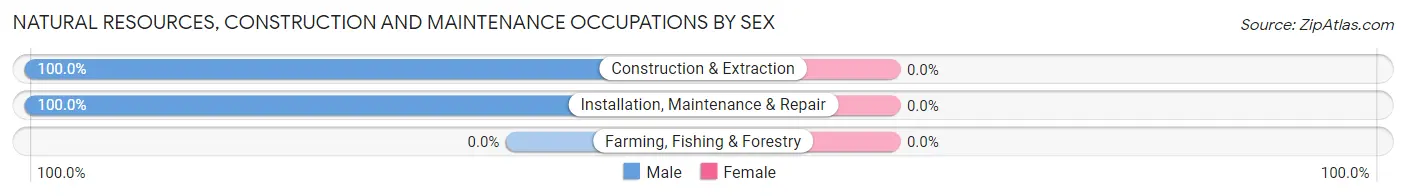
Natural Resources, Construction and Maintenance Occupations by Sex
| Occupation | Male | Female |
| Farming, Fishing & Forestry | 0 (0.0%) | 0 (0.0%) |
| Construction & Extraction | 6 (100.0%) | 0 (0.0%) |
| Installation, Maintenance & Repair | 12 (100.0%) | 0 (0.0%) |
| Total (Category) | 18 (100.0%) | 0 (0.0%) |
| Total (Overall) | 93 (41.7%) | 130 (58.3%) |
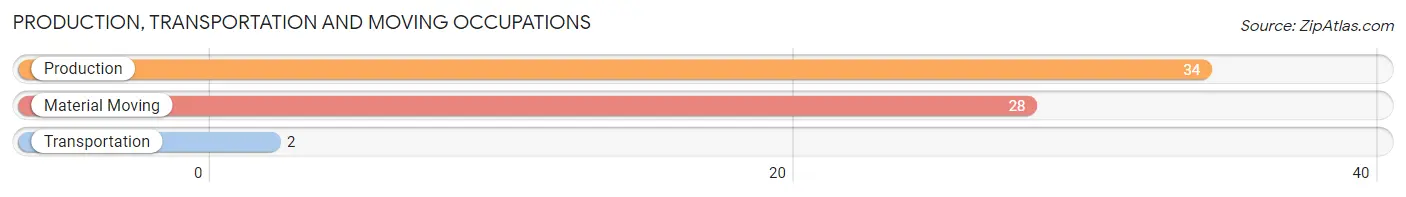
Production, Transportation and Moving Occupations
The most common Production, Transportation and Moving occupations in Minong are Production (34 | 15.2%), Material Moving (28 | 12.6%), and Transportation (2 | 0.9%).
Production, Transportation and Moving Occupations by Sex
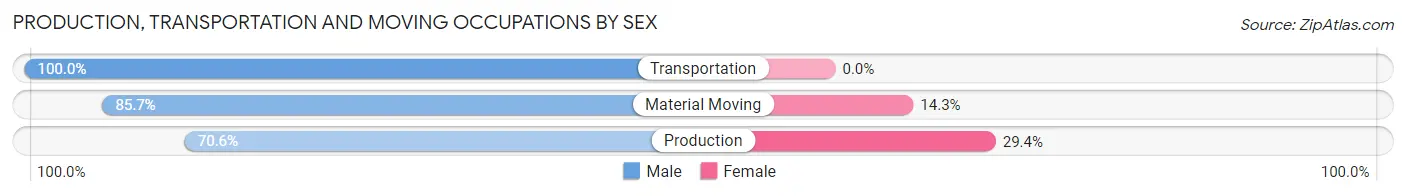
| Occupation | Male | Female |
| Production | 24 (70.6%) | 10 (29.4%) |
| Transportation | 2 (100.0%) | 0 (0.0%) |
| Material Moving | 24 (85.7%) | 4 (14.3%) |
| Total (Category) | 50 (78.1%) | 14 (21.9%) |
| Total (Overall) | 93 (41.7%) | 130 (58.3%) |
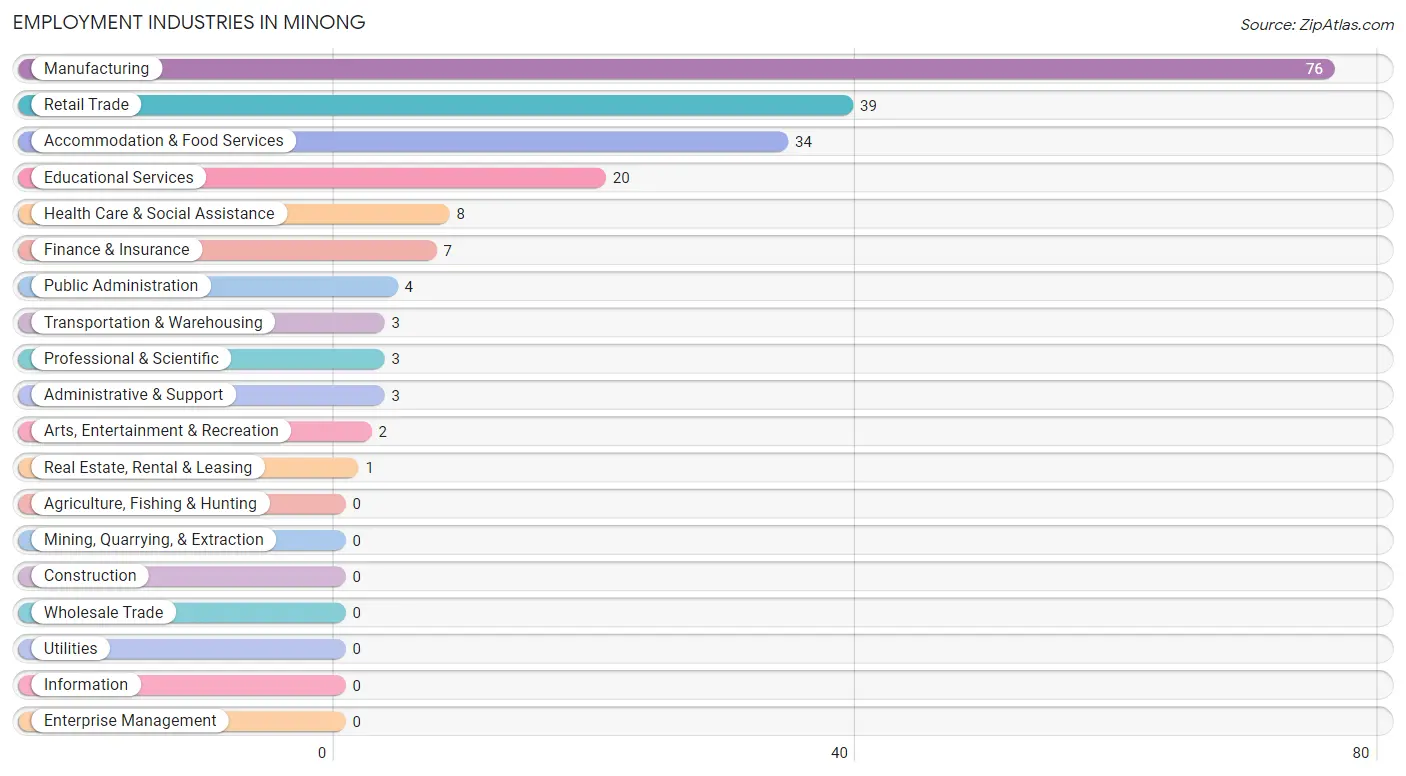
Employment Industries by Sex in Minong
Employment Industries in Minong
The major employment industries in Minong include Manufacturing (76 | 34.1%), Retail Trade (39 | 17.5%), Accommodation & Food Services (34 | 15.2%), Educational Services (20 | 9.0%), and Health Care & Social Assistance (8 | 3.6%).
Employment Industries by Sex in Minong
The Minong industries that see more men than women are Real Estate, Rental & Leasing (100.0%), Transportation & Warehousing (66.7%), and Manufacturing (64.5%), whereas the industries that tend to have a higher number of women are Finance & Insurance (100.0%), Professional & Scientific (100.0%), and Administrative & Support (100.0%).
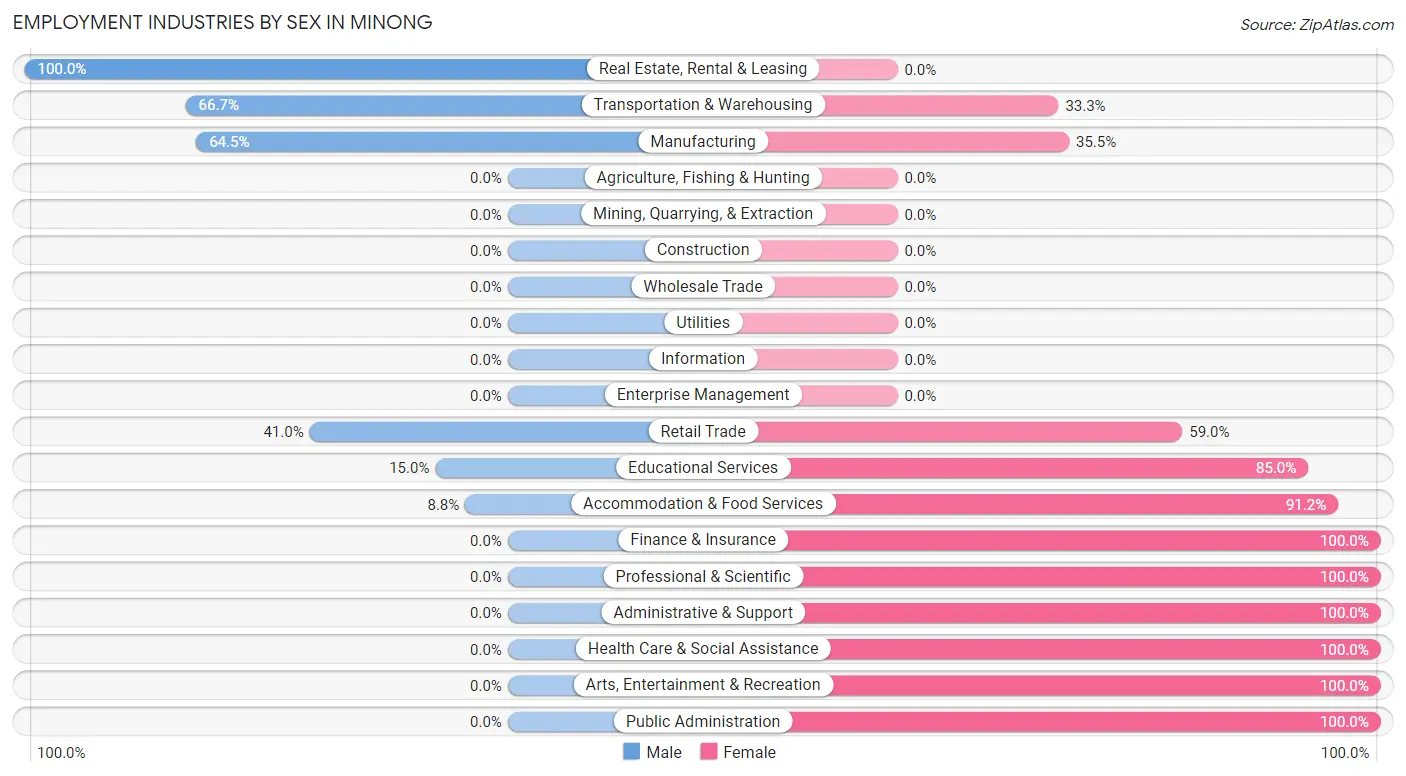
| Industry | Male | Female |
| Agriculture, Fishing & Hunting | 0 (0.0%) | 0 (0.0%) |
| Mining, Quarrying, & Extraction | 0 (0.0%) | 0 (0.0%) |
| Construction | 0 (0.0%) | 0 (0.0%) |
| Manufacturing | 49 (64.5%) | 27 (35.5%) |
| Wholesale Trade | 0 (0.0%) | 0 (0.0%) |
| Retail Trade | 16 (41.0%) | 23 (59.0%) |
| Transportation & Warehousing | 2 (66.7%) | 1 (33.3%) |
| Utilities | 0 (0.0%) | 0 (0.0%) |
| Information | 0 (0.0%) | 0 (0.0%) |
| Finance & Insurance | 0 (0.0%) | 7 (100.0%) |
| Real Estate, Rental & Leasing | 1 (100.0%) | 0 (0.0%) |
| Professional & Scientific | 0 (0.0%) | 3 (100.0%) |
| Enterprise Management | 0 (0.0%) | 0 (0.0%) |
| Administrative & Support | 0 (0.0%) | 3 (100.0%) |
| Educational Services | 3 (15.0%) | 17 (85.0%) |
| Health Care & Social Assistance | 0 (0.0%) | 8 (100.0%) |
| Arts, Entertainment & Recreation | 0 (0.0%) | 2 (100.0%) |
| Accommodation & Food Services | 3 (8.8%) | 31 (91.2%) |
| Public Administration | 0 (0.0%) | 4 (100.0%) |
| Total | 93 (41.7%) | 130 (58.3%) |
Education in Minong
School Enrollment in Minong
The most common levels of schooling among the 152 students in Minong are high school (44 | 28.9%), middle school (31 | 20.4%), and elementary school (29 | 19.1%).
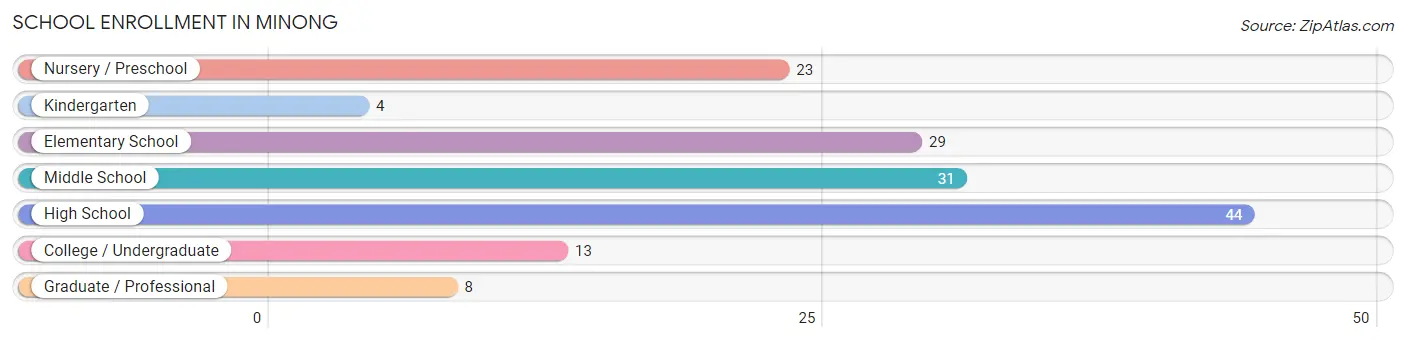
| School Level | # Students | % Students |
| Nursery / Preschool | 23 | 15.1% |
| Kindergarten | 4 | 2.6% |
| Elementary School | 29 | 19.1% |
| Middle School | 31 | 20.4% |
| High School | 44 | 28.9% |
| College / Undergraduate | 13 | 8.6% |
| Graduate / Professional | 8 | 5.3% |
| Total | 152 | 100.0% |
School Enrollment by Age by Funding Source in Minong
Out of a total of 152 students who are enrolled in schools in Minong, 23 (15.1%) attend a private institution, while the remaining 129 (84.9%) are enrolled in public schools. The age group of 25 to 34 year olds has the highest likelihood of being enrolled in private schools, with 12 (100.0% in the age bracket) enrolled. Conversely, the age group of 3 to 4 year olds has the lowest likelihood of being enrolled in a private school, with 20 (100.0% in the age bracket) attending a public institution.
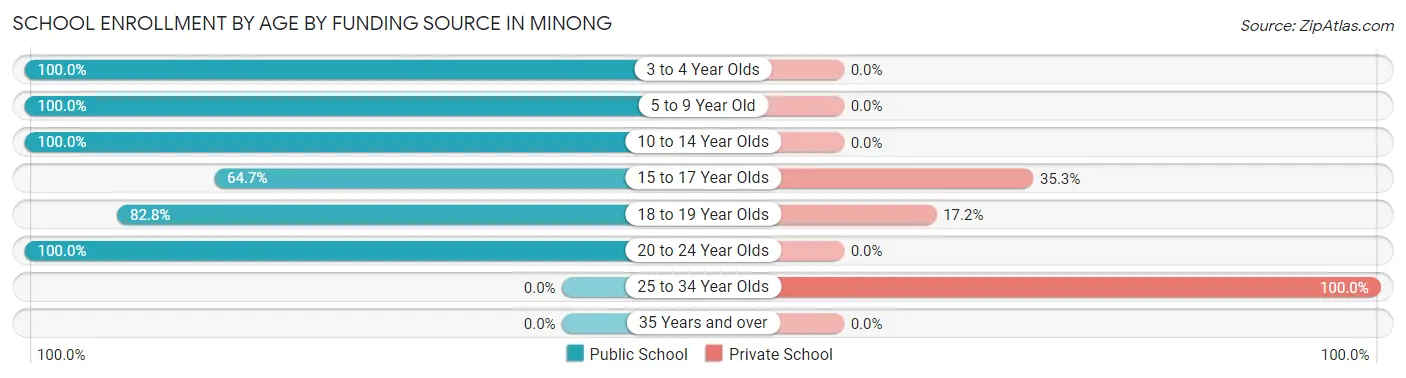
| Age Bracket | Public School | Private School |
| 3 to 4 Year Olds | 20 (100.0%) | 0 (0.0%) |
| 5 to 9 Year Old | 36 (100.0%) | 0 (0.0%) |
| 10 to 14 Year Olds | 34 (100.0%) | 0 (0.0%) |
| 15 to 17 Year Olds | 11 (64.7%) | 6 (35.3%) |
| 18 to 19 Year Olds | 24 (82.8%) | 5 (17.2%) |
| 20 to 24 Year Olds | 4 (100.0%) | 0 (0.0%) |
| 25 to 34 Year Olds | 0 (0.0%) | 12 (100.0%) |
| 35 Years and over | 0 (0.0%) | 0 (0.0%) |
| Total | 129 (84.9%) | 23 (15.1%) |
Educational Attainment by Field of Study in Minong
Business (15 | 23.4%), arts & humanities (15 | 23.4%), liberal arts & history (14 | 21.9%), education (6 | 9.4%), and communications (5 | 7.8%) are the most common fields of study among 64 individuals in Minong who have obtained a bachelor's degree or higher.
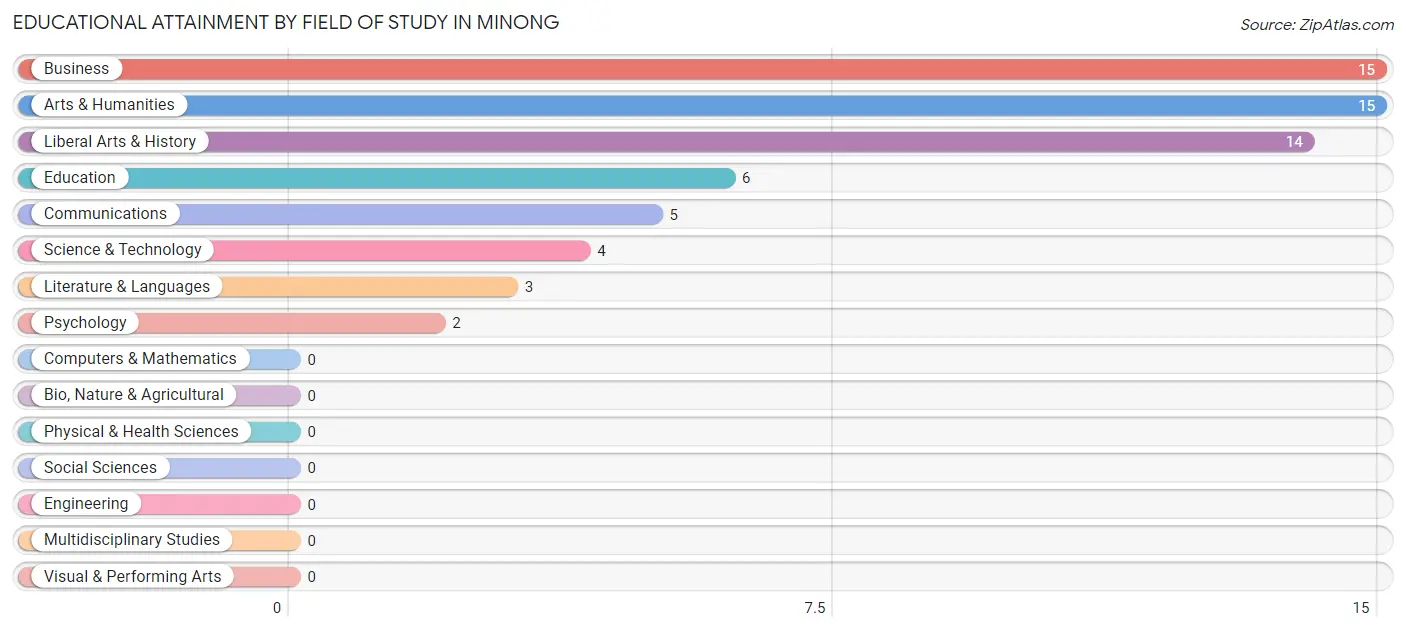
| Field of Study | # Graduates | % Graduates |
| Computers & Mathematics | 0 | 0.0% |
| Bio, Nature & Agricultural | 0 | 0.0% |
| Physical & Health Sciences | 0 | 0.0% |
| Psychology | 2 | 3.1% |
| Social Sciences | 0 | 0.0% |
| Engineering | 0 | 0.0% |
| Multidisciplinary Studies | 0 | 0.0% |
| Science & Technology | 4 | 6.2% |
| Business | 15 | 23.4% |
| Education | 6 | 9.4% |
| Literature & Languages | 3 | 4.7% |
| Liberal Arts & History | 14 | 21.9% |
| Visual & Performing Arts | 0 | 0.0% |
| Communications | 5 | 7.8% |
| Arts & Humanities | 15 | 23.4% |
| Total | 64 | 100.0% |
Transportation & Commute in Minong
Vehicle Availability by Sex in Minong
The most prevalent vehicle ownership categories in Minong are males with 2 vehicles (45, accounting for 48.4%) and females with 2 vehicles (38, making up 35.2%).
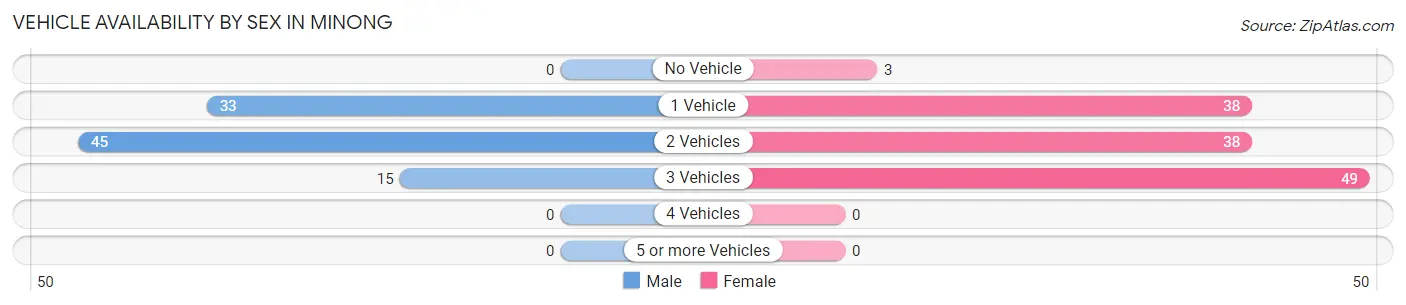
| Vehicles Available | Male | Female |
| No Vehicle | 0 (0.0%) | 3 (2.3%) |
| 1 Vehicle | 33 (35.5%) | 38 (29.7%) |
| 2 Vehicles | 45 (48.4%) | 38 (29.7%) |
| 3 Vehicles | 15 (16.1%) | 49 (38.3%) |
| 4 Vehicles | 0 (0.0%) | 0 (0.0%) |
| 5 or more Vehicles | 0 (0.0%) | 0 (0.0%) |
| Total | 93 (100.0%) | 128 (100.0%) |
Commute Time in Minong
The most frequently occuring commute durations in Minong are less than 5 minutes (71 commuters, 34.5%), 5 to 9 minutes (58 commuters, 28.2%), and 20 to 24 minutes (33 commuters, 16.0%).
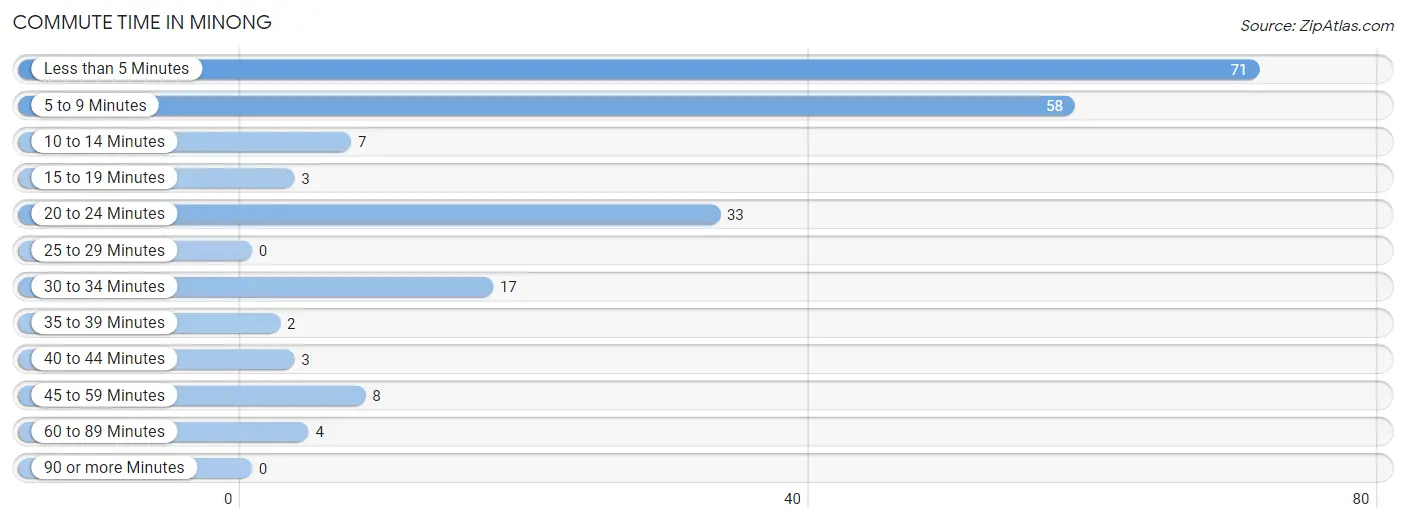
| Commute Time | # Commuters | % Commuters |
| Less than 5 Minutes | 71 | 34.5% |
| 5 to 9 Minutes | 58 | 28.2% |
| 10 to 14 Minutes | 7 | 3.4% |
| 15 to 19 Minutes | 3 | 1.5% |
| 20 to 24 Minutes | 33 | 16.0% |
| 25 to 29 Minutes | 0 | 0.0% |
| 30 to 34 Minutes | 17 | 8.3% |
| 35 to 39 Minutes | 2 | 1.0% |
| 40 to 44 Minutes | 3 | 1.5% |
| 45 to 59 Minutes | 8 | 3.9% |
| 60 to 89 Minutes | 4 | 1.9% |
| 90 or more Minutes | 0 | 0.0% |
Commute Time by Sex in Minong
The most common commute times in Minong are less than 5 minutes (27 commuters, 30.3%) for males and less than 5 minutes (44 commuters, 37.6%) for females.
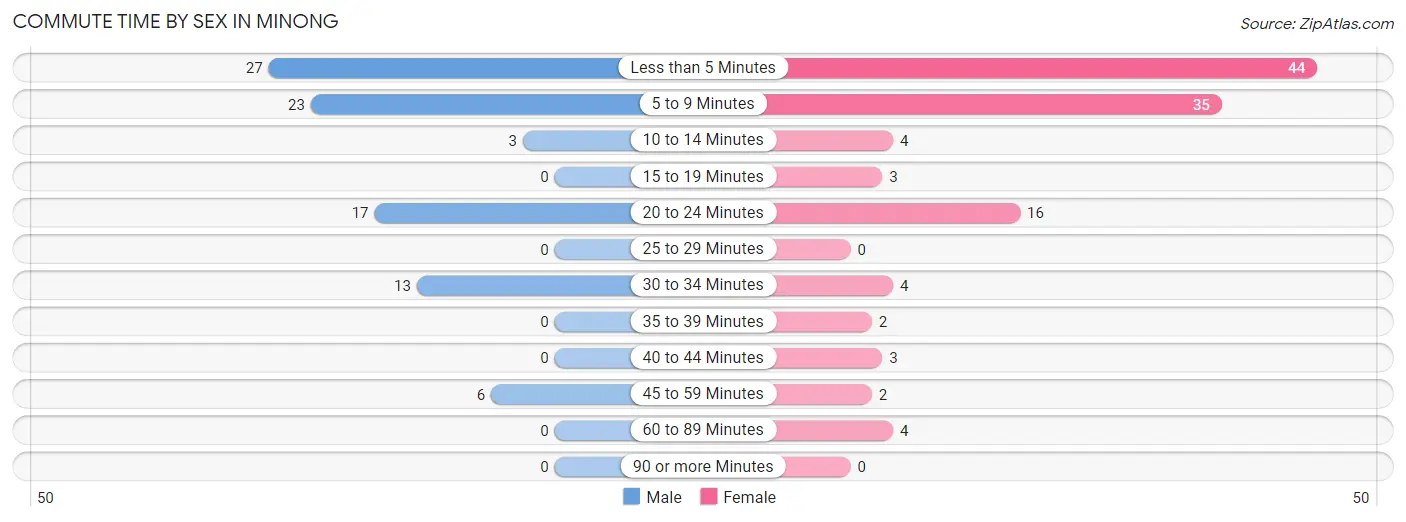
| Commute Time | Male | Female |
| Less than 5 Minutes | 27 (30.3%) | 44 (37.6%) |
| 5 to 9 Minutes | 23 (25.8%) | 35 (29.9%) |
| 10 to 14 Minutes | 3 (3.4%) | 4 (3.4%) |
| 15 to 19 Minutes | 0 (0.0%) | 3 (2.6%) |
| 20 to 24 Minutes | 17 (19.1%) | 16 (13.7%) |
| 25 to 29 Minutes | 0 (0.0%) | 0 (0.0%) |
| 30 to 34 Minutes | 13 (14.6%) | 4 (3.4%) |
| 35 to 39 Minutes | 0 (0.0%) | 2 (1.7%) |
| 40 to 44 Minutes | 0 (0.0%) | 3 (2.6%) |
| 45 to 59 Minutes | 6 (6.7%) | 2 (1.7%) |
| 60 to 89 Minutes | 0 (0.0%) | 4 (3.4%) |
| 90 or more Minutes | 0 (0.0%) | 0 (0.0%) |
Time of Departure to Work by Sex in Minong
The most frequent times of departure to work in Minong are 7:30 AM to 7:59 AM (18, 20.2%) for males and 10:00 AM to 10:59 AM (27, 23.1%) for females.
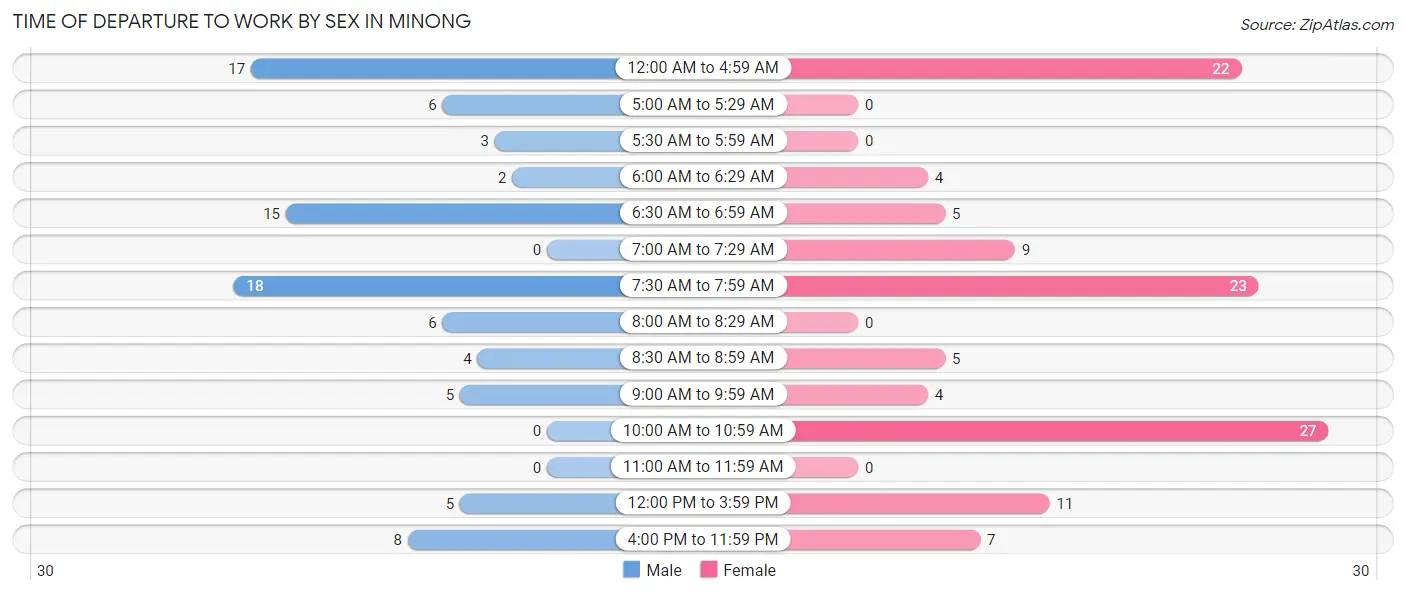
| Time of Departure | Male | Female |
| 12:00 AM to 4:59 AM | 17 (19.1%) | 22 (18.8%) |
| 5:00 AM to 5:29 AM | 6 (6.7%) | 0 (0.0%) |
| 5:30 AM to 5:59 AM | 3 (3.4%) | 0 (0.0%) |
| 6:00 AM to 6:29 AM | 2 (2.2%) | 4 (3.4%) |
| 6:30 AM to 6:59 AM | 15 (16.9%) | 5 (4.3%) |
| 7:00 AM to 7:29 AM | 0 (0.0%) | 9 (7.7%) |
| 7:30 AM to 7:59 AM | 18 (20.2%) | 23 (19.7%) |
| 8:00 AM to 8:29 AM | 6 (6.7%) | 0 (0.0%) |
| 8:30 AM to 8:59 AM | 4 (4.5%) | 5 (4.3%) |
| 9:00 AM to 9:59 AM | 5 (5.6%) | 4 (3.4%) |
| 10:00 AM to 10:59 AM | 0 (0.0%) | 27 (23.1%) |
| 11:00 AM to 11:59 AM | 0 (0.0%) | 0 (0.0%) |
| 12:00 PM to 3:59 PM | 5 (5.6%) | 11 (9.4%) |
| 4:00 PM to 11:59 PM | 8 (9.0%) | 7 (6.0%) |
| Total | 89 (100.0%) | 117 (100.0%) |
Housing Occupancy in Minong
Occupancy by Ownership in Minong
Of the total 306 dwellings in Minong, owner-occupied units account for 165 (53.9%), while renter-occupied units make up 141 (46.1%).
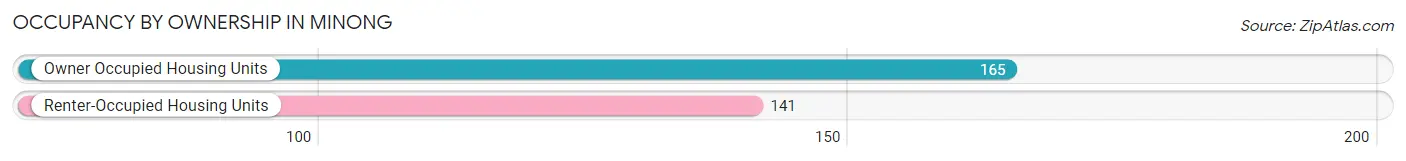
| Occupancy | # Housing Units | % Housing Units |
| Owner Occupied Housing Units | 165 | 53.9% |
| Renter-Occupied Housing Units | 141 | 46.1% |
| Total Occupied Housing Units | 306 | 100.0% |
Occupancy by Household Size in Minong
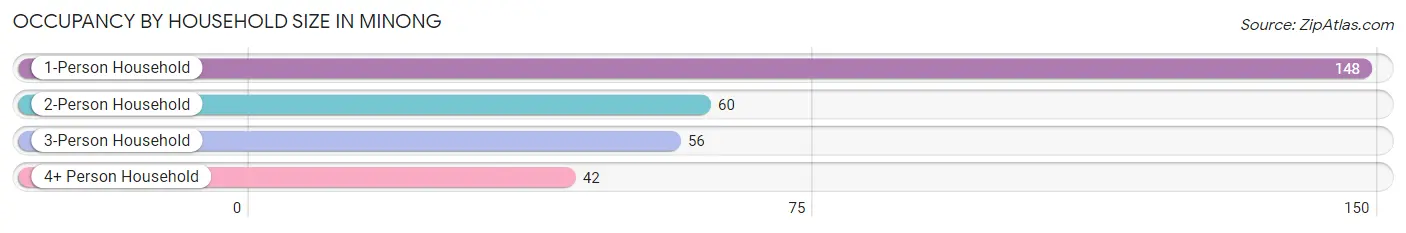
| Household Size | # Housing Units | % Housing Units |
| 1-Person Household | 148 | 48.4% |
| 2-Person Household | 60 | 19.6% |
| 3-Person Household | 56 | 18.3% |
| 4+ Person Household | 42 | 13.7% |
| Total Housing Units | 306 | 100.0% |
Occupancy by Ownership by Household Size in Minong
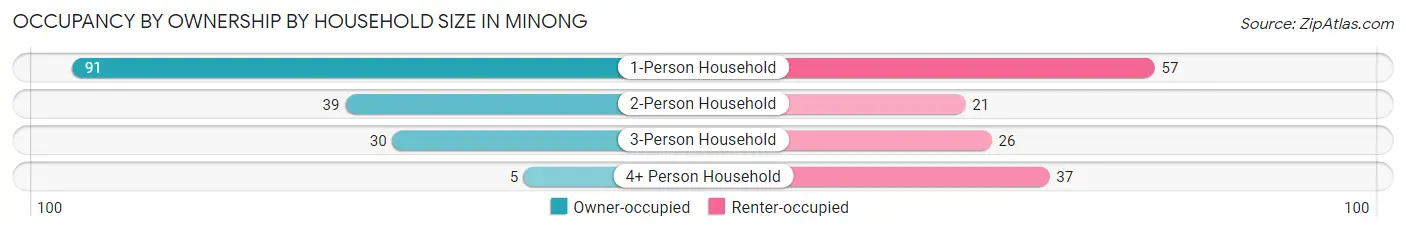
| Household Size | Owner-occupied | Renter-occupied |
| 1-Person Household | 91 (61.5%) | 57 (38.5%) |
| 2-Person Household | 39 (65.0%) | 21 (35.0%) |
| 3-Person Household | 30 (53.6%) | 26 (46.4%) |
| 4+ Person Household | 5 (11.9%) | 37 (88.1%) |
| Total Housing Units | 165 (53.9%) | 141 (46.1%) |
Occupancy by Educational Attainment in Minong
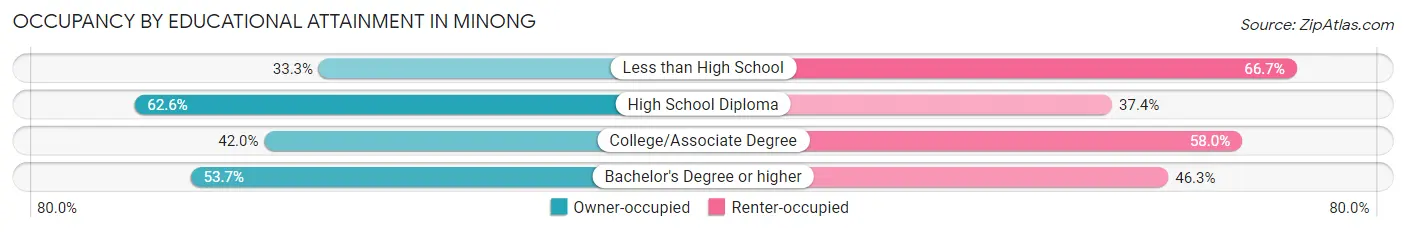
| Household Size | Owner-occupied | Renter-occupied |
| Less than High School | 7 (33.3%) | 14 (66.7%) |
| High School Diploma | 102 (62.6%) | 61 (37.4%) |
| College/Associate Degree | 34 (42.0%) | 47 (58.0%) |
| Bachelor's Degree or higher | 22 (53.7%) | 19 (46.3%) |
Occupancy by Age of Householder in Minong
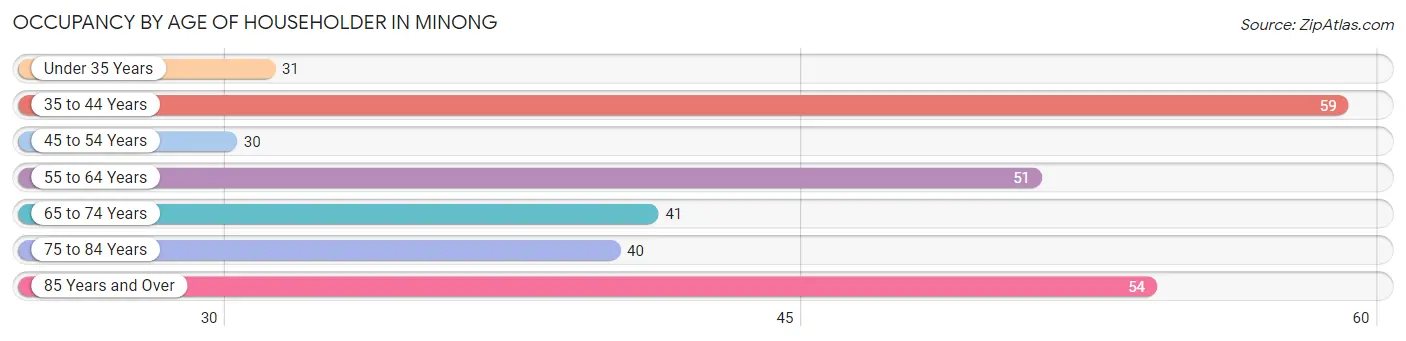
| Age Bracket | # Households | % Households |
| Under 35 Years | 31 | 10.1% |
| 35 to 44 Years | 59 | 19.3% |
| 45 to 54 Years | 30 | 9.8% |
| 55 to 64 Years | 51 | 16.7% |
| 65 to 74 Years | 41 | 13.4% |
| 75 to 84 Years | 40 | 13.1% |
| 85 Years and Over | 54 | 17.6% |
| Total | 306 | 100.0% |
Housing Finances in Minong
Median Income by Occupancy in Minong
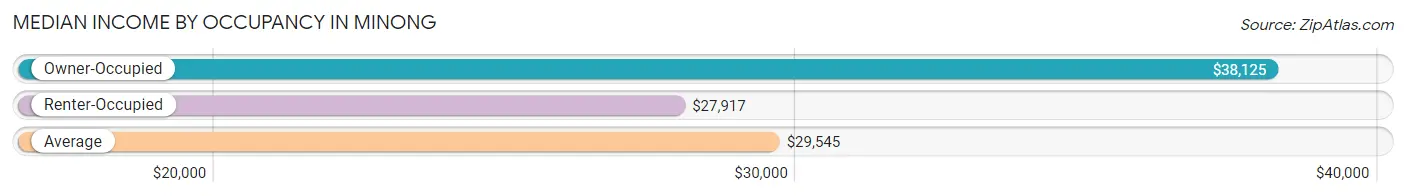
| Occupancy Type | # Households | Median Income |
| Owner-Occupied | 165 (53.9%) | $38,125 |
| Renter-Occupied | 141 (46.1%) | $27,917 |
| Average | 306 (100.0%) | $29,545 |
Occupancy by Householder Income Bracket in Minong
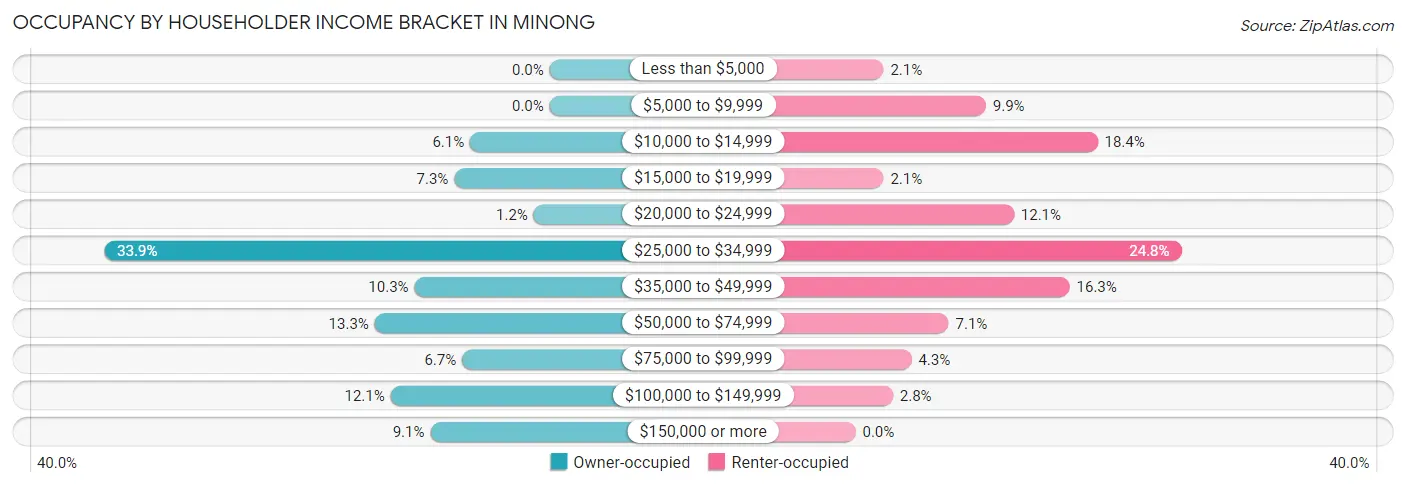
| Income Bracket | Owner-occupied | Renter-occupied |
| Less than $5,000 | 0 (0.0%) | 3 (2.1%) |
| $5,000 to $9,999 | 0 (0.0%) | 14 (9.9%) |
| $10,000 to $14,999 | 10 (6.1%) | 26 (18.4%) |
| $15,000 to $19,999 | 12 (7.3%) | 3 (2.1%) |
| $20,000 to $24,999 | 2 (1.2%) | 17 (12.1%) |
| $25,000 to $34,999 | 56 (33.9%) | 35 (24.8%) |
| $35,000 to $49,999 | 17 (10.3%) | 23 (16.3%) |
| $50,000 to $74,999 | 22 (13.3%) | 10 (7.1%) |
| $75,000 to $99,999 | 11 (6.7%) | 6 (4.3%) |
| $100,000 to $149,999 | 20 (12.1%) | 4 (2.8%) |
| $150,000 or more | 15 (9.1%) | 0 (0.0%) |
| Total | 165 (100.0%) | 141 (100.0%) |
Monthly Housing Cost Tiers in Minong
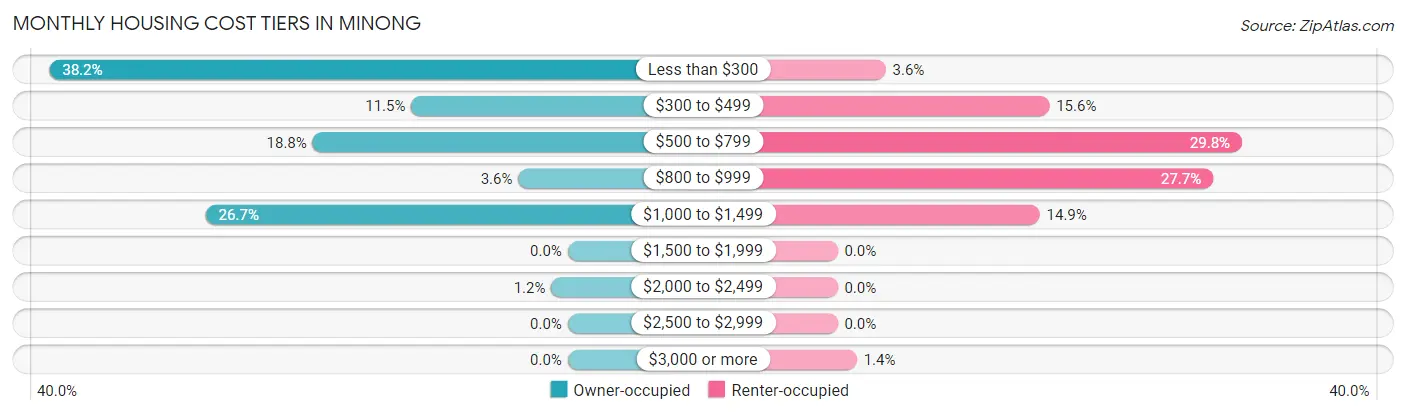
| Monthly Cost | Owner-occupied | Renter-occupied |
| Less than $300 | 63 (38.2%) | 5 (3.5%) |
| $300 to $499 | 19 (11.5%) | 22 (15.6%) |
| $500 to $799 | 31 (18.8%) | 42 (29.8%) |
| $800 to $999 | 6 (3.6%) | 39 (27.7%) |
| $1,000 to $1,499 | 44 (26.7%) | 21 (14.9%) |
| $1,500 to $1,999 | 0 (0.0%) | 0 (0.0%) |
| $2,000 to $2,499 | 2 (1.2%) | 0 (0.0%) |
| $2,500 to $2,999 | 0 (0.0%) | 0 (0.0%) |
| $3,000 or more | 0 (0.0%) | 2 (1.4%) |
| Total | 165 (100.0%) | 141 (100.0%) |
Physical Housing Characteristics in Minong
Housing Structures in Minong
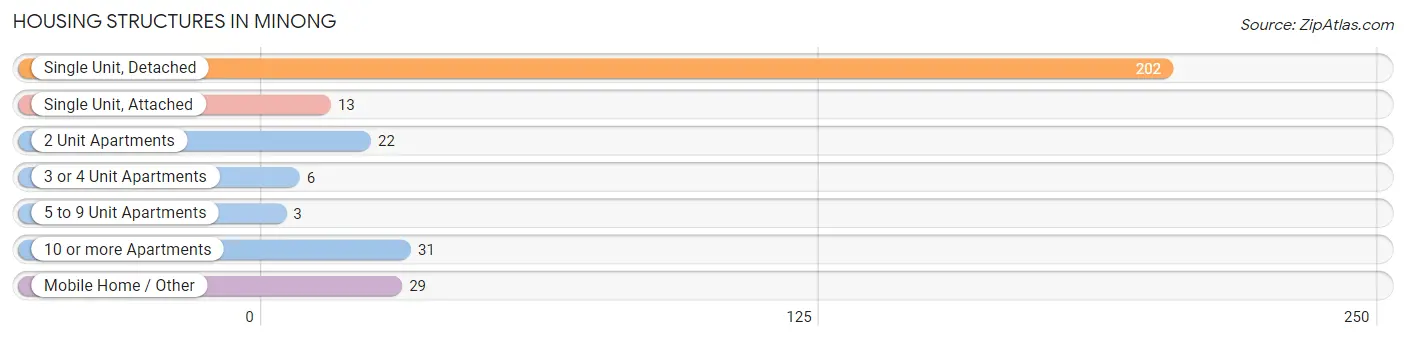
| Structure Type | # Housing Units | % Housing Units |
| Single Unit, Detached | 202 | 66.0% |
| Single Unit, Attached | 13 | 4.3% |
| 2 Unit Apartments | 22 | 7.2% |
| 3 or 4 Unit Apartments | 6 | 2.0% |
| 5 to 9 Unit Apartments | 3 | 1.0% |
| 10 or more Apartments | 31 | 10.1% |
| Mobile Home / Other | 29 | 9.5% |
| Total | 306 | 100.0% |
Housing Structures by Occupancy in Minong
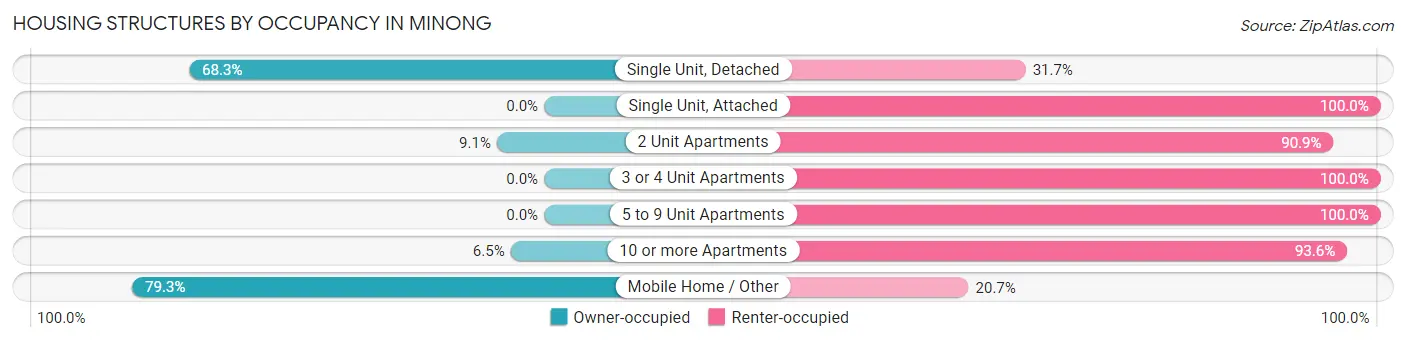
| Structure Type | Owner-occupied | Renter-occupied |
| Single Unit, Detached | 138 (68.3%) | 64 (31.7%) |
| Single Unit, Attached | 0 (0.0%) | 13 (100.0%) |
| 2 Unit Apartments | 2 (9.1%) | 20 (90.9%) |
| 3 or 4 Unit Apartments | 0 (0.0%) | 6 (100.0%) |
| 5 to 9 Unit Apartments | 0 (0.0%) | 3 (100.0%) |
| 10 or more Apartments | 2 (6.5%) | 29 (93.5%) |
| Mobile Home / Other | 23 (79.3%) | 6 (20.7%) |
| Total | 165 (53.9%) | 141 (46.1%) |
Housing Structures by Number of Rooms in Minong
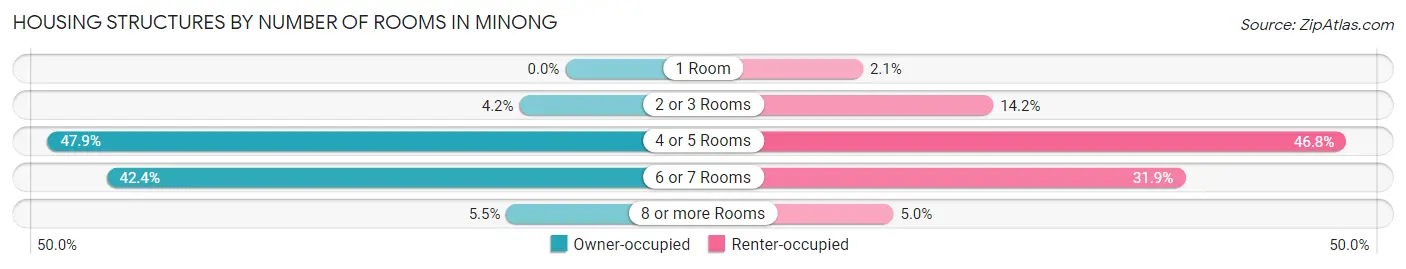
| Number of Rooms | Owner-occupied | Renter-occupied |
| 1 Room | 0 (0.0%) | 3 (2.1%) |
| 2 or 3 Rooms | 7 (4.2%) | 20 (14.2%) |
| 4 or 5 Rooms | 79 (47.9%) | 66 (46.8%) |
| 6 or 7 Rooms | 70 (42.4%) | 45 (31.9%) |
| 8 or more Rooms | 9 (5.4%) | 7 (5.0%) |
| Total | 165 (100.0%) | 141 (100.0%) |
Housing Structure by Heating Type in Minong
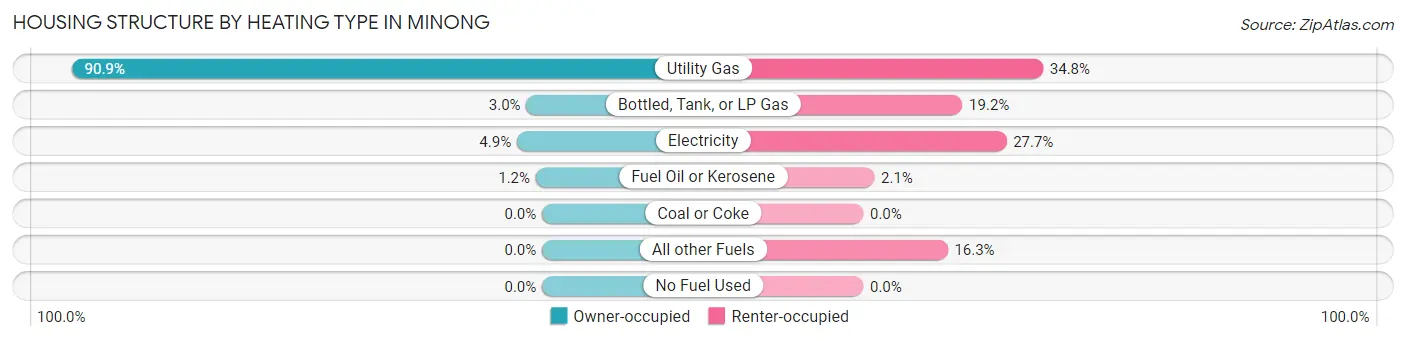
| Heating Type | Owner-occupied | Renter-occupied |
| Utility Gas | 150 (90.9%) | 49 (34.7%) |
| Bottled, Tank, or LP Gas | 5 (3.0%) | 27 (19.2%) |
| Electricity | 8 (4.9%) | 39 (27.7%) |
| Fuel Oil or Kerosene | 2 (1.2%) | 3 (2.1%) |
| Coal or Coke | 0 (0.0%) | 0 (0.0%) |
| All other Fuels | 0 (0.0%) | 23 (16.3%) |
| No Fuel Used | 0 (0.0%) | 0 (0.0%) |
| Total | 165 (100.0%) | 141 (100.0%) |
Household Vehicle Usage in Minong
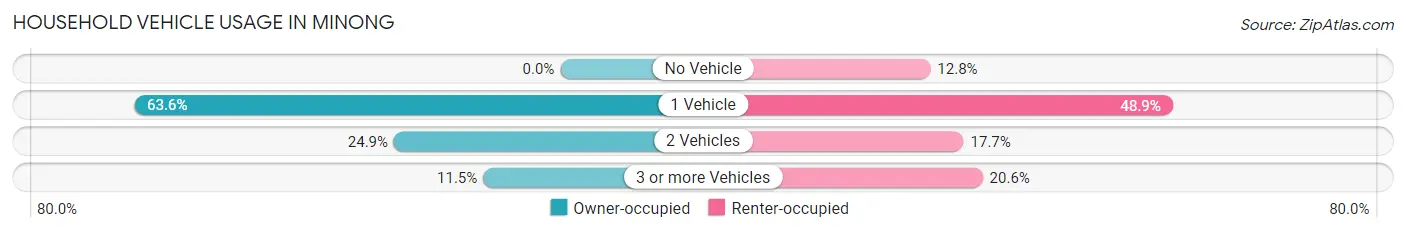
| Vehicles per Household | Owner-occupied | Renter-occupied |
| No Vehicle | 0 (0.0%) | 18 (12.8%) |
| 1 Vehicle | 105 (63.6%) | 69 (48.9%) |
| 2 Vehicles | 41 (24.8%) | 25 (17.7%) |
| 3 or more Vehicles | 19 (11.5%) | 29 (20.6%) |
| Total | 165 (100.0%) | 141 (100.0%) |
Real Estate & Mortgages in Minong
Real Estate and Mortgage Overview in Minong
| Characteristic | Without Mortgage | With Mortgage |
| Housing Units | 53 | 112 |
| Median Property Value | $132,500 | $0 |
| Median Household Income | $49,375 | $9 |
| Monthly Housing Costs | $454 | $0 |
| Real Estate Taxes | $1,350 | $0 |
Property Value by Mortgage Status in Minong
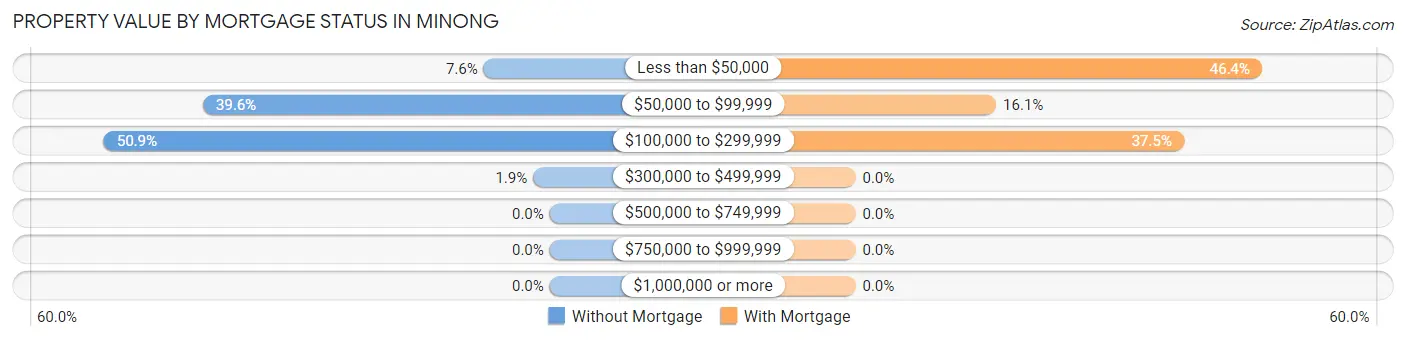
| Property Value | Without Mortgage | With Mortgage |
| Less than $50,000 | 4 (7.5%) | 52 (46.4%) |
| $50,000 to $99,999 | 21 (39.6%) | 18 (16.1%) |
| $100,000 to $299,999 | 27 (50.9%) | 42 (37.5%) |
| $300,000 to $499,999 | 1 (1.9%) | 0 (0.0%) |
| $500,000 to $749,999 | 0 (0.0%) | 0 (0.0%) |
| $750,000 to $999,999 | 0 (0.0%) | 0 (0.0%) |
| $1,000,000 or more | 0 (0.0%) | 0 (0.0%) |
| Total | 53 (100.0%) | 112 (100.0%) |
Household Income by Mortgage Status in Minong
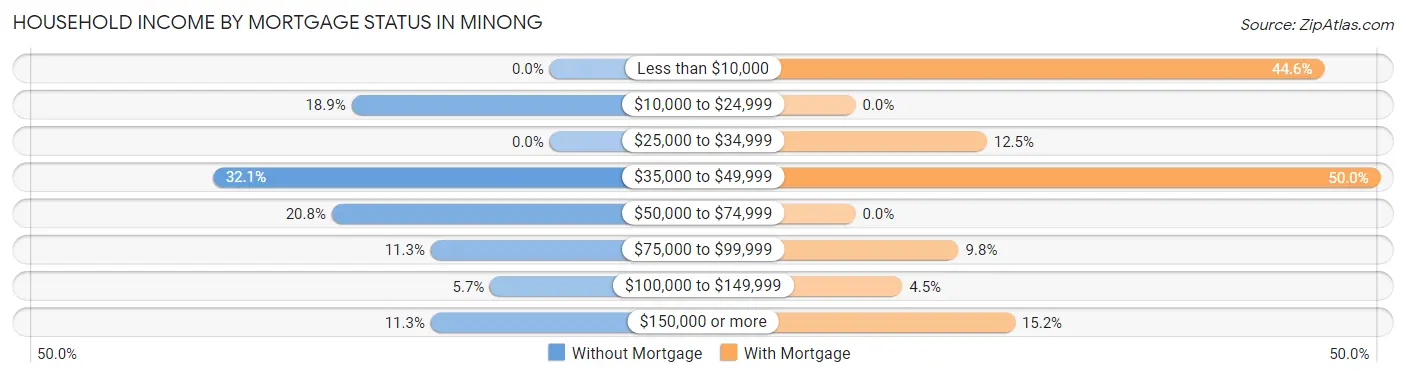
| Household Income | Without Mortgage | With Mortgage |
| Less than $10,000 | 0 (0.0%) | 50 (44.6%) |
| $10,000 to $24,999 | 10 (18.9%) | 0 (0.0%) |
| $25,000 to $34,999 | 0 (0.0%) | 14 (12.5%) |
| $35,000 to $49,999 | 17 (32.1%) | 56 (50.0%) |
| $50,000 to $74,999 | 11 (20.7%) | 0 (0.0%) |
| $75,000 to $99,999 | 6 (11.3%) | 11 (9.8%) |
| $100,000 to $149,999 | 3 (5.7%) | 5 (4.5%) |
| $150,000 or more | 6 (11.3%) | 17 (15.2%) |
| Total | 53 (100.0%) | 112 (100.0%) |
Property Value to Household Income Ratio in Minong
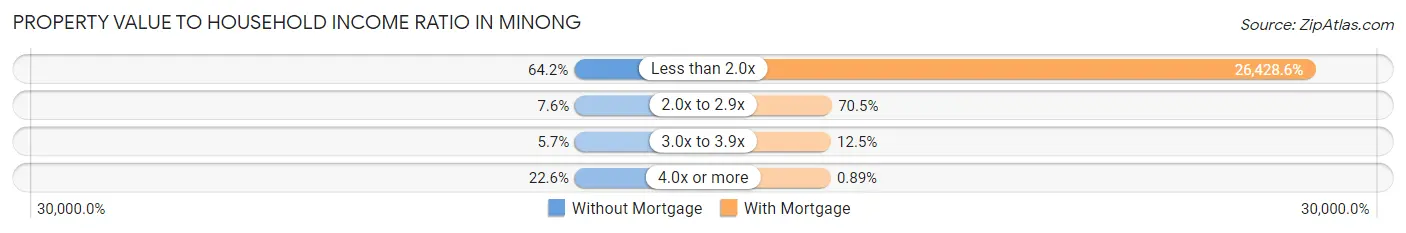
| Value-to-Income Ratio | Without Mortgage | With Mortgage |
| Less than 2.0x | 34 (64.1%) | 29,600 (26,428.6%) |
| 2.0x to 2.9x | 4 (7.5%) | 79 (70.5%) |
| 3.0x to 3.9x | 3 (5.7%) | 14 (12.5%) |
| 4.0x or more | 12 (22.6%) | 1 (0.9%) |
| Total | 53 (100.0%) | 112 (100.0%) |
Real Estate Taxes by Mortgage Status in Minong
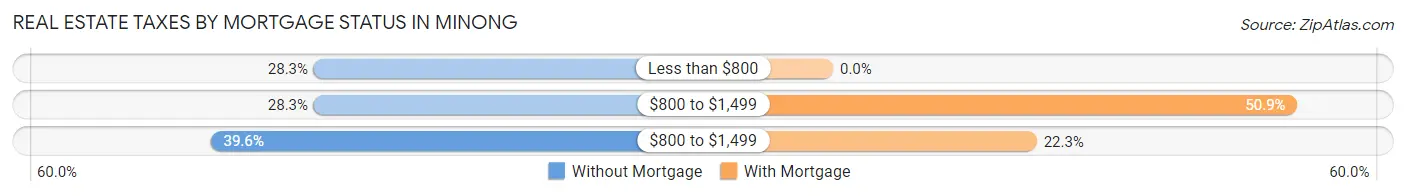
| Property Taxes | Without Mortgage | With Mortgage |
| Less than $800 | 15 (28.3%) | 0 (0.0%) |
| $800 to $1,499 | 15 (28.3%) | 57 (50.9%) |
| $800 to $1,499 | 21 (39.6%) | 25 (22.3%) |
| Total | 53 (100.0%) | 112 (100.0%) |
Health & Disability in Minong
Health Insurance Coverage by Age in Minong
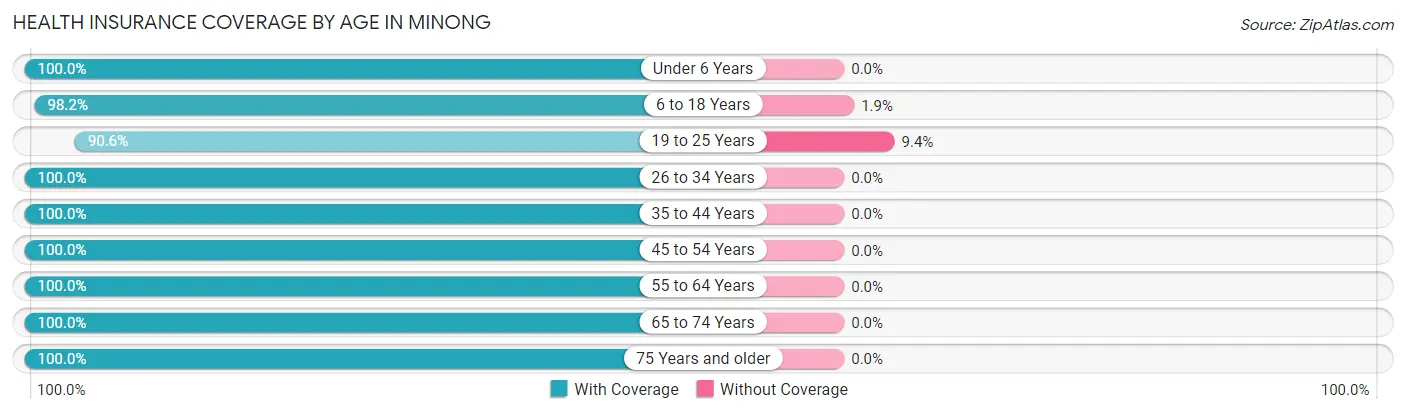
| Age Bracket | With Coverage | Without Coverage |
| Under 6 Years | 33 (100.0%) | 0 (0.0%) |
| 6 to 18 Years | 106 (98.2%) | 2 (1.8%) |
| 19 to 25 Years | 29 (90.6%) | 3 (9.4%) |
| 26 to 34 Years | 35 (100.0%) | 0 (0.0%) |
| 35 to 44 Years | 76 (100.0%) | 0 (0.0%) |
| 45 to 54 Years | 64 (100.0%) | 0 (0.0%) |
| 55 to 64 Years | 66 (100.0%) | 0 (0.0%) |
| 65 to 74 Years | 84 (100.0%) | 0 (0.0%) |
| 75 Years and older | 113 (100.0%) | 0 (0.0%) |
| Total | 606 (99.2%) | 5 (0.8%) |
Health Insurance Coverage by Citizenship Status in Minong
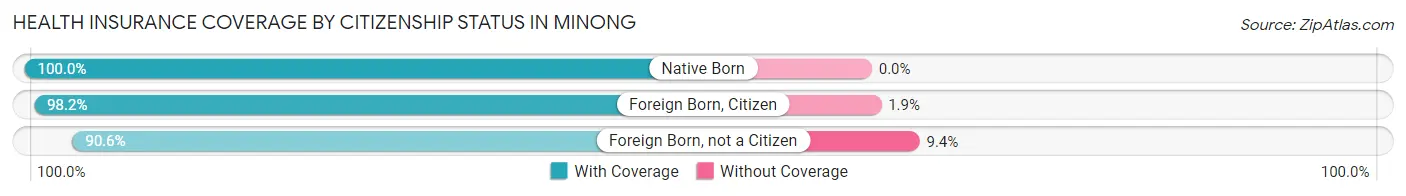
| Citizenship Status | With Coverage | Without Coverage |
| Native Born | 33 (100.0%) | 0 (0.0%) |
| Foreign Born, Citizen | 106 (98.2%) | 2 (1.8%) |
| Foreign Born, not a Citizen | 29 (90.6%) | 3 (9.4%) |
Health Insurance Coverage by Household Income in Minong
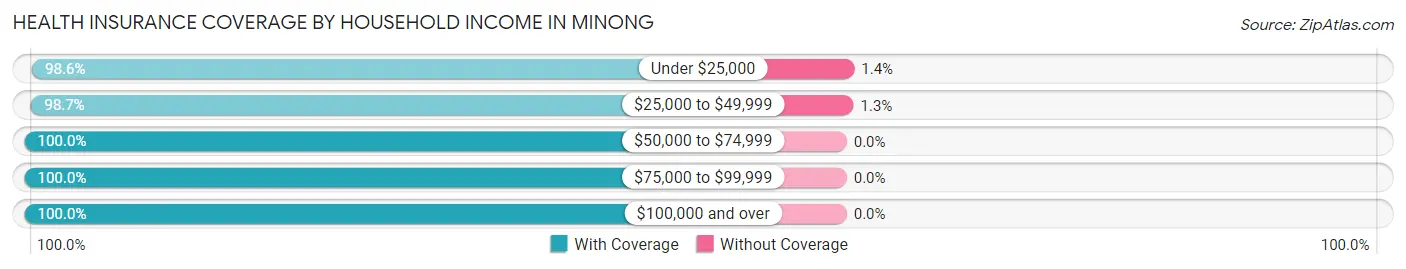
| Household Income | With Coverage | Without Coverage |
| Under $25,000 | 140 (98.6%) | 2 (1.4%) |
| $25,000 to $49,999 | 231 (98.7%) | 3 (1.3%) |
| $50,000 to $74,999 | 85 (100.0%) | 0 (0.0%) |
| $75,000 to $99,999 | 39 (100.0%) | 0 (0.0%) |
| $100,000 and over | 111 (100.0%) | 0 (0.0%) |
Public vs Private Health Insurance Coverage by Age in Minong
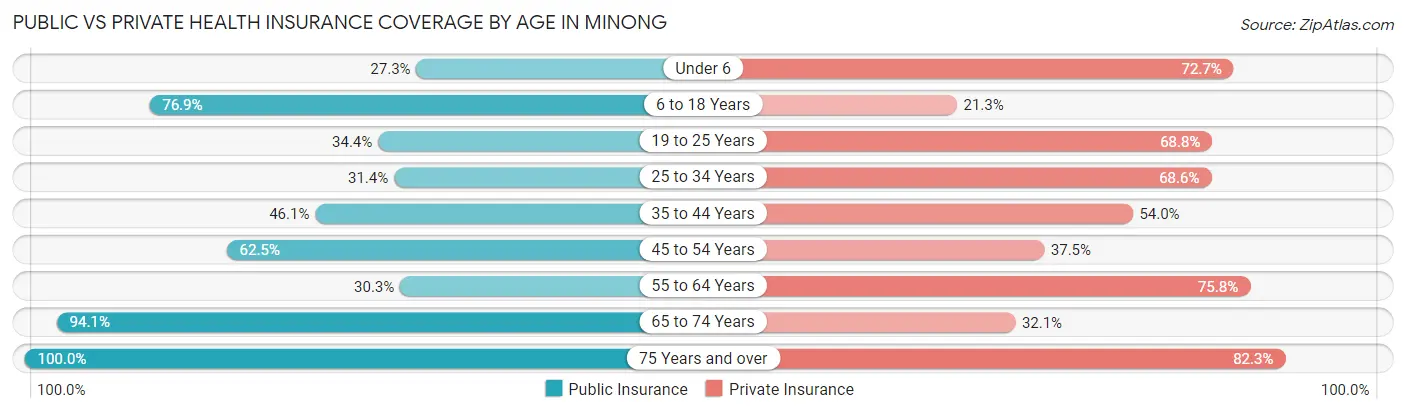
| Age Bracket | Public Insurance | Private Insurance |
| Under 6 | 9 (27.3%) | 24 (72.7%) |
| 6 to 18 Years | 83 (76.8%) | 23 (21.3%) |
| 19 to 25 Years | 11 (34.4%) | 22 (68.8%) |
| 25 to 34 Years | 11 (31.4%) | 24 (68.6%) |
| 35 to 44 Years | 35 (46.1%) | 41 (53.9%) |
| 45 to 54 Years | 40 (62.5%) | 24 (37.5%) |
| 55 to 64 Years | 20 (30.3%) | 50 (75.8%) |
| 65 to 74 Years | 79 (94.1%) | 27 (32.1%) |
| 75 Years and over | 113 (100.0%) | 93 (82.3%) |
| Total | 401 (65.6%) | 328 (53.7%) |
Disability Status by Sex by Age in Minong
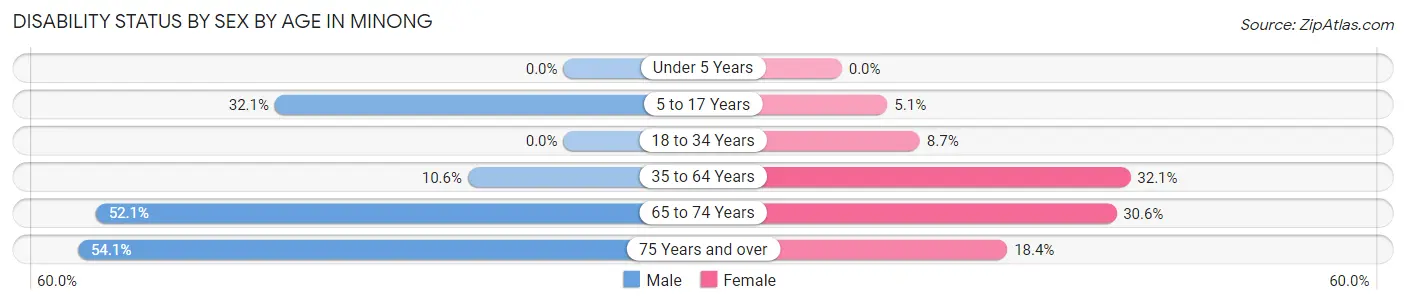
| Age Bracket | Male | Female |
| Under 5 Years | 0 (0.0%) | 0 (0.0%) |
| 5 to 17 Years | 9 (32.1%) | 3 (5.1%) |
| 18 to 34 Years | 0 (0.0%) | 6 (8.7%) |
| 35 to 64 Years | 10 (10.6%) | 36 (32.1%) |
| 65 to 74 Years | 25 (52.1%) | 11 (30.6%) |
| 75 Years and over | 20 (54.0%) | 14 (18.4%) |
Disability Class by Sex by Age in Minong
Disability Class: Hearing Difficulty
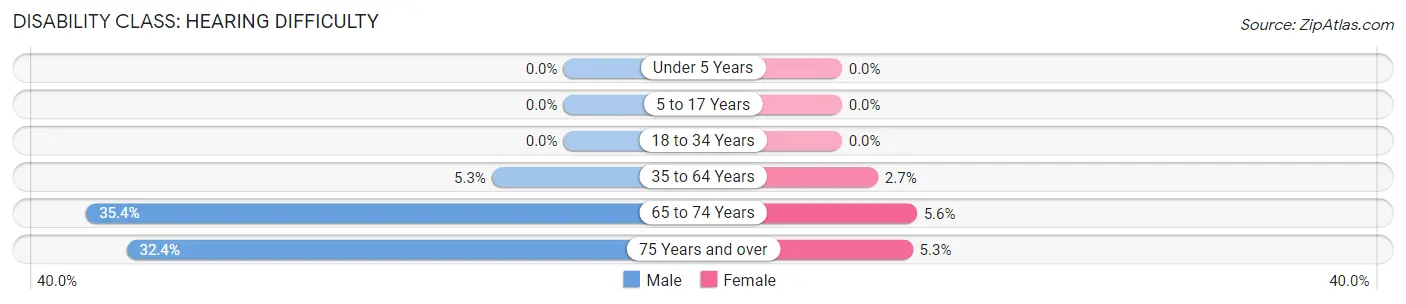
| Age Bracket | Male | Female |
| Under 5 Years | 0 (0.0%) | 0 (0.0%) |
| 5 to 17 Years | 0 (0.0%) | 0 (0.0%) |
| 18 to 34 Years | 0 (0.0%) | 0 (0.0%) |
| 35 to 64 Years | 5 (5.3%) | 3 (2.7%) |
| 65 to 74 Years | 17 (35.4%) | 2 (5.6%) |
| 75 Years and over | 12 (32.4%) | 4 (5.3%) |
Disability Class: Vision Difficulty
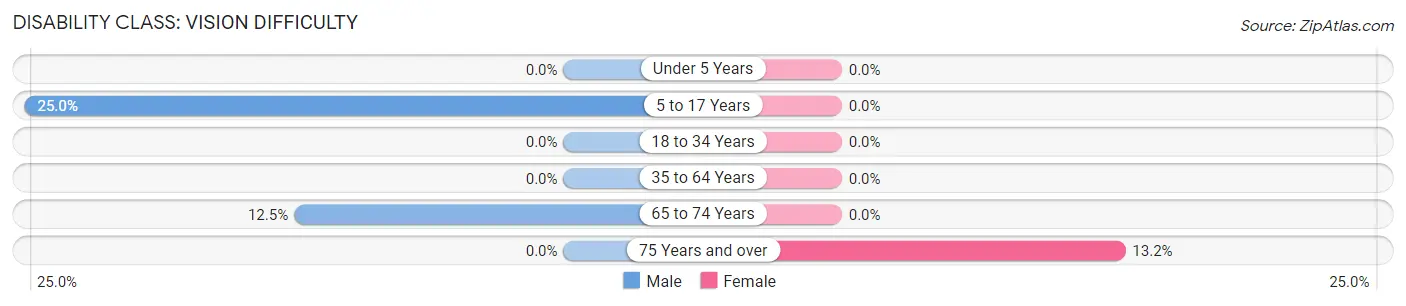
| Age Bracket | Male | Female |
| Under 5 Years | 0 (0.0%) | 0 (0.0%) |
| 5 to 17 Years | 7 (25.0%) | 0 (0.0%) |
| 18 to 34 Years | 0 (0.0%) | 0 (0.0%) |
| 35 to 64 Years | 0 (0.0%) | 0 (0.0%) |
| 65 to 74 Years | 6 (12.5%) | 0 (0.0%) |
| 75 Years and over | 0 (0.0%) | 10 (13.2%) |
Disability Class: Cognitive Difficulty
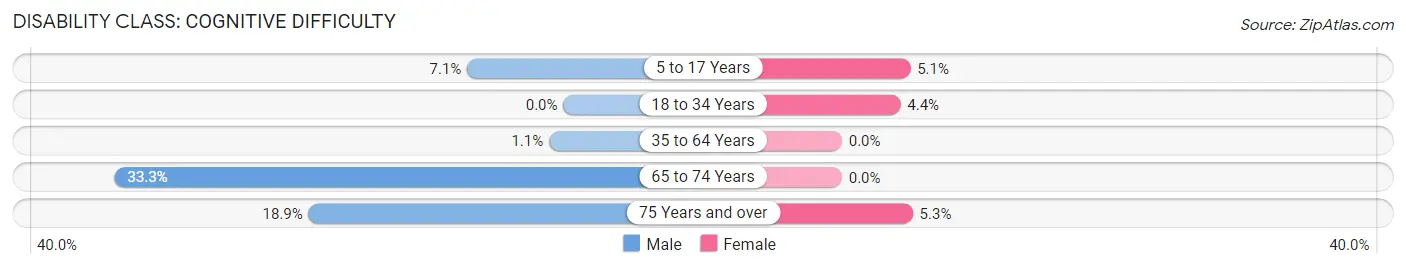
| Age Bracket | Male | Female |
| 5 to 17 Years | 2 (7.1%) | 3 (5.1%) |
| 18 to 34 Years | 0 (0.0%) | 3 (4.3%) |
| 35 to 64 Years | 1 (1.1%) | 0 (0.0%) |
| 65 to 74 Years | 16 (33.3%) | 0 (0.0%) |
| 75 Years and over | 7 (18.9%) | 4 (5.3%) |
Disability Class: Ambulatory Difficulty
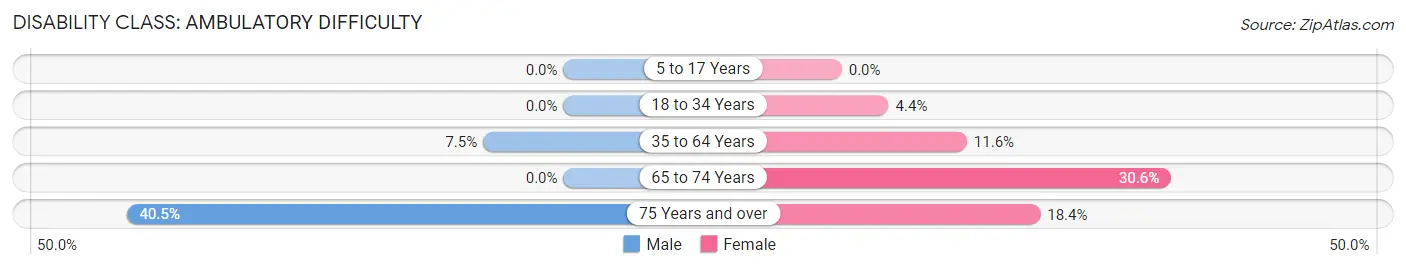
| Age Bracket | Male | Female |
| 5 to 17 Years | 0 (0.0%) | 0 (0.0%) |
| 18 to 34 Years | 0 (0.0%) | 3 (4.3%) |
| 35 to 64 Years | 7 (7.4%) | 13 (11.6%) |
| 65 to 74 Years | 0 (0.0%) | 11 (30.6%) |
| 75 Years and over | 15 (40.5%) | 14 (18.4%) |
Disability Class: Self-Care Difficulty
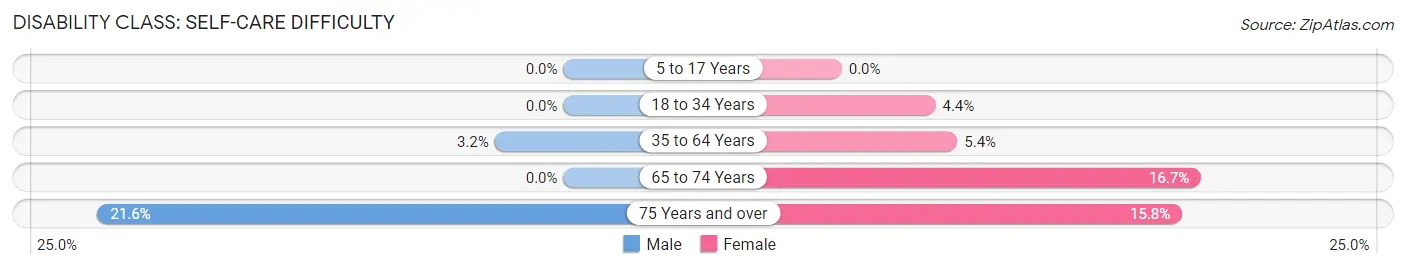
| Age Bracket | Male | Female |
| 5 to 17 Years | 0 (0.0%) | 0 (0.0%) |
| 18 to 34 Years | 0 (0.0%) | 3 (4.3%) |
| 35 to 64 Years | 3 (3.2%) | 6 (5.4%) |
| 65 to 74 Years | 0 (0.0%) | 6 (16.7%) |
| 75 Years and over | 8 (21.6%) | 12 (15.8%) |
Technology Access in Minong
Computing Device Access in Minong
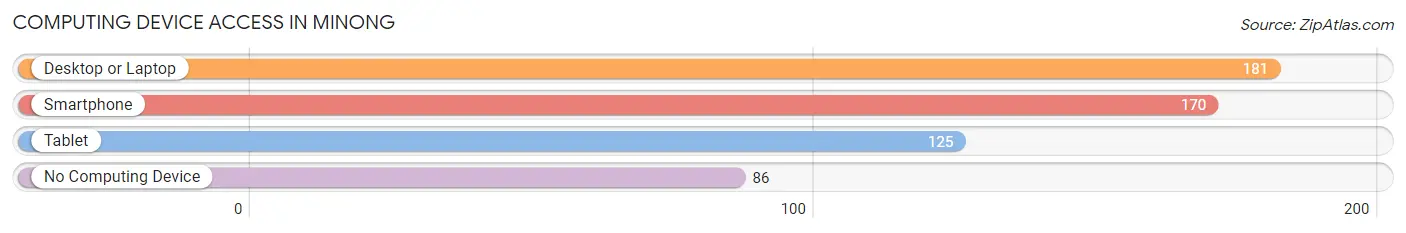
| Device Type | # Households | % Households |
| Desktop or Laptop | 181 | 59.2% |
| Smartphone | 170 | 55.6% |
| Tablet | 125 | 40.8% |
| No Computing Device | 86 | 28.1% |
| Total | 306 | 100.0% |
Internet Access in Minong
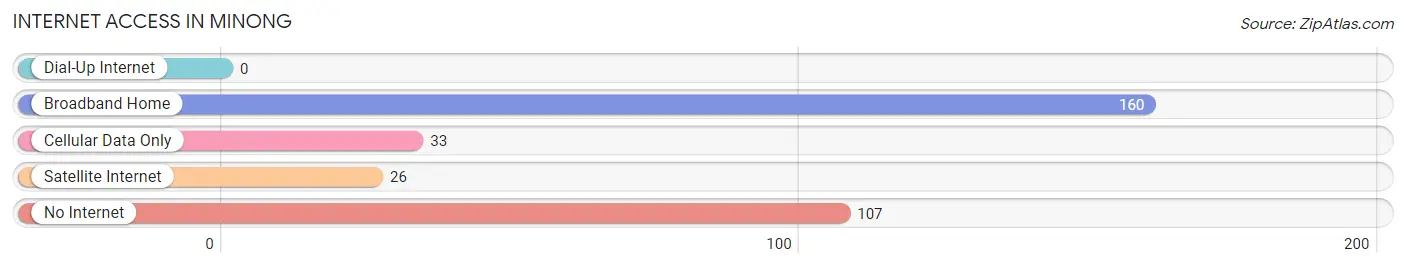
| Internet Type | # Households | % Households |
| Dial-Up Internet | 0 | 0.0% |
| Broadband Home | 160 | 52.3% |
| Cellular Data Only | 33 | 10.8% |
| Satellite Internet | 26 | 8.5% |
| No Internet | 107 | 35.0% |
| Total | 306 | 100.0% |
Minong Summary
Minong, Wisconsin is a small town located in Washburn County in the northwest corner of the state. It is situated on the shores of Lake Minong, a popular recreational lake. The town has a population of approximately 1,000 people and is part of the Minong School District.
History
The area that is now Minong was first settled in the late 1800s by a group of Norwegian immigrants. The town was originally called “Minong” after the lake, which was named after a Chippewa chief. The town was officially incorporated in 1891.
In the early 1900s, Minong was a thriving logging town. The town was home to several sawmills and lumber companies, and the surrounding area was heavily logged. The logging industry declined in the mid-1900s, and the town shifted its focus to tourism.
Geography
Minong is located in the northwest corner of Wisconsin, on the shores of Lake Minong. The town is situated in a rural area, surrounded by forests and lakes. The town is located about 30 miles from the city of Superior, Wisconsin.
The town has a total area of 1.2 square miles, all of which is land. The town is located at an elevation of 1,072 feet above sea level.
Economy
The economy of Minong is largely based on tourism. The town is home to several resorts and campgrounds, which attract visitors from all over the Midwest. The town is also home to several small businesses, including restaurants, shops, and a grocery store.
The town is also home to several manufacturing companies, including a paper mill and a furniture factory. The town is also home to a small airport, which serves the surrounding area.
Demographics
As of the 2010 census, the population of Minong was 1,000 people. The racial makeup of the town was 97.2% White, 0.7% African American, 0.3% Native American, 0.2% Asian, 0.1% Pacific Islander, and 1.5% from other races.
The median household income in Minong was $37,500, and the median family income was $45,000. The per capita income was $19,000. About 10.3% of the population was below the poverty line.
Conclusion
Minong, Wisconsin is a small town located in Washburn County in the northwest corner of the state. It is situated on the shores of Lake Minong, a popular recreational lake. The town has a population of approximately 1,000 people and is part of the Minong School District. The economy of Minong is largely based on tourism, and the town is home to several resorts and campgrounds. The town is also home to several small businesses, manufacturing companies, and a small airport. The racial makeup of the town is predominantly White, with a small percentage of African American, Native American, Asian, and Pacific Islander residents. The median household income in Minong is $37,500, and the median family income is $45,000.
Common Questions
What is Per Capita Income in Minong?
Per Capita income in Minong is $25,692.
What is the Median Family Income in Minong?
Median Family Income in Minong is $66,250.
What is the Median Household income in Minong?
Median Household Income in Minong is $29,545.
What is Income or Wage Gap in Minong?
Income or Wage Gap in Minong is 40.3%.
Women in Minong earn 59.7 cents for every dollar earned by a man.
What is Inequality or Gini Index in Minong?
Inequality or Gini Index in Minong is 0.46.
What is the Total Population of Minong?
Total Population of Minong is 611.
What is the Total Male Population of Minong?
Total Male Population of Minong is 253.
What is the Total Female Population of Minong?
Total Female Population of Minong is 358.
What is the Ratio of Males per 100 Females in Minong?
There are 70.67 Males per 100 Females in Minong.
What is the Ratio of Females per 100 Males in Minong?
There are 141.50 Females per 100 Males in Minong.
What is the Median Population Age in Minong?
Median Population Age in Minong is 47.5 Years.
What is the Average Family Size in Minong
Average Family Size in Minong is 2.9 People.
What is the Average Household Size in Minong
Average Household Size in Minong is 2.0 People.
How Large is the Labor Force in Minong?
There are 230 People in the Labor Forcein in Minong.
What is the Percentage of People in the Labor Force in Minong?
46.0% of People are in the Labor Force in Minong.
What is the Unemployment Rate in Minong?
Unemployment Rate in Minong is 3.0%.