Pine River, WI Map & Demographics
Pine River Map
Pine River Overview
$26,021
PER CAPITA INCOME
$44,219
AVG FAMILY INCOME
$41,250
AVG HOUSEHOLD INCOME
0.49
INEQUALITY / GINI INDEX
130
TOTAL POPULATION
57
MALE POPULATION
73
FEMALE POPULATION
78.08
MALES / 100 FEMALES
128.07
FEMALES / 100 MALES
50.6
MEDIAN AGE
2.6
AVG FAMILY SIZE
2.1
AVG HOUSEHOLD SIZE
69
LABOR FORCE [ PEOPLE ]
60.5%
PERCENT IN LABOR FORCE
Pine River Zip Codes
Income in Pine River
Income Overview in Pine River
Per Capita Income in Pine River is $26,021, while median incomes of families and households are $44,219 and $41,250 respectively.
| Characteristic | Number | Measure |
| Per Capita Income | 130 | $26,021 |
| Median Family Income | 43 | $44,219 |
| Mean Family Income | 43 | $69,484 |
| Median Household Income | 61 | $41,250 |
| Mean Household Income | 61 | $54,344 |
| Income Deficit | 43 | $0 |
| Wage / Income Gap (%) | 130 | 0.00% |
| Wage / Income Gap ($) | 130 | 100.00¢ per $1 |
| Gini / Inequality Index | 130 | 0.49 |
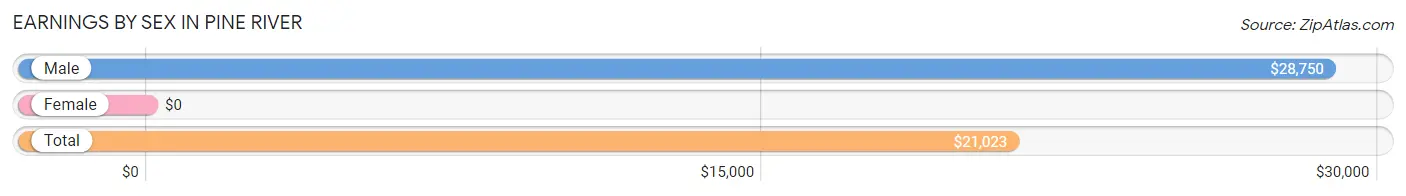
Earnings by Sex in Pine River
| Sex | Number | Average Earnings |
| Male | 32 (46.4%) | $28,750 |
| Female | 37 (53.6%) | $0 |
| Total | 69 (100.0%) | $21,023 |
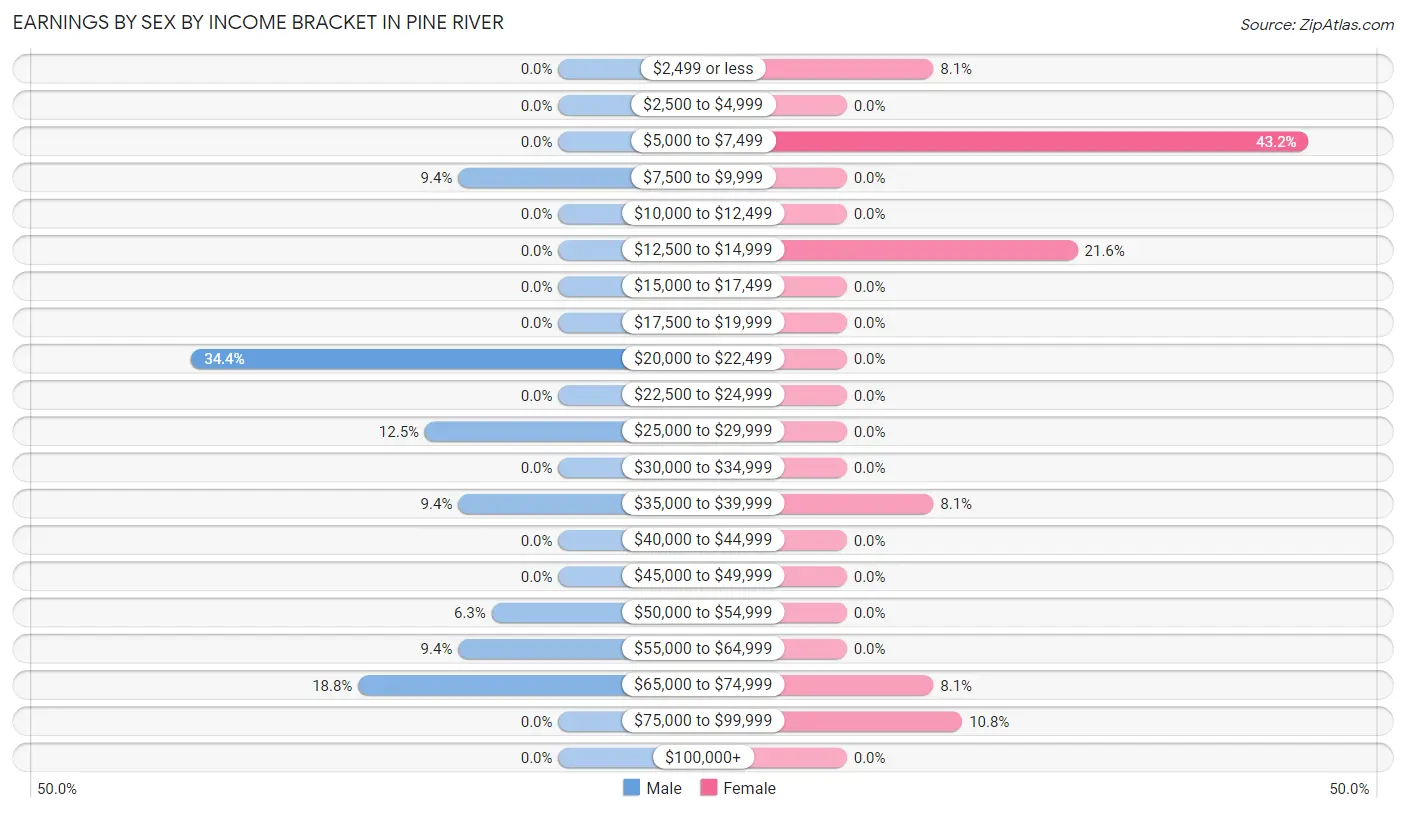
Earnings by Sex by Income Bracket in Pine River
The most common earnings brackets in Pine River are $20,000 to $22,499 for men (11 | 34.4%) and $5,000 to $7,499 for women (16 | 43.2%).
| Income | Male | Female |
| $2,499 or less | 0 (0.0%) | 3 (8.1%) |
| $2,500 to $4,999 | 0 (0.0%) | 0 (0.0%) |
| $5,000 to $7,499 | 0 (0.0%) | 16 (43.2%) |
| $7,500 to $9,999 | 3 (9.4%) | 0 (0.0%) |
| $10,000 to $12,499 | 0 (0.0%) | 0 (0.0%) |
| $12,500 to $14,999 | 0 (0.0%) | 8 (21.6%) |
| $15,000 to $17,499 | 0 (0.0%) | 0 (0.0%) |
| $17,500 to $19,999 | 0 (0.0%) | 0 (0.0%) |
| $20,000 to $22,499 | 11 (34.4%) | 0 (0.0%) |
| $22,500 to $24,999 | 0 (0.0%) | 0 (0.0%) |
| $25,000 to $29,999 | 4 (12.5%) | 0 (0.0%) |
| $30,000 to $34,999 | 0 (0.0%) | 0 (0.0%) |
| $35,000 to $39,999 | 3 (9.4%) | 3 (8.1%) |
| $40,000 to $44,999 | 0 (0.0%) | 0 (0.0%) |
| $45,000 to $49,999 | 0 (0.0%) | 0 (0.0%) |
| $50,000 to $54,999 | 2 (6.2%) | 0 (0.0%) |
| $55,000 to $64,999 | 3 (9.4%) | 0 (0.0%) |
| $65,000 to $74,999 | 6 (18.8%) | 3 (8.1%) |
| $75,000 to $99,999 | 0 (0.0%) | 4 (10.8%) |
| $100,000+ | 0 (0.0%) | 0 (0.0%) |
| Total | 32 (100.0%) | 37 (100.0%) |
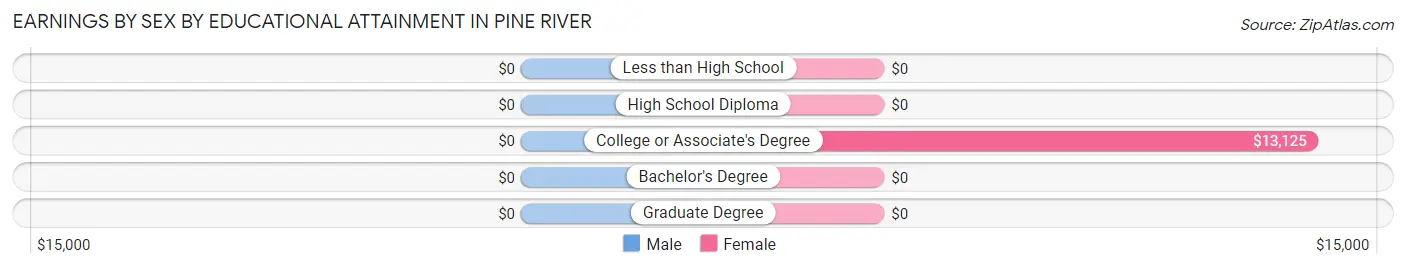
Earnings by Sex by Educational Attainment in Pine River
| Educational Attainment | Male Income | Female Income |
| Less than High School | - | - |
| High School Diploma | - | - |
| College or Associate's Degree | - | - |
| Bachelor's Degree | - | - |
| Graduate Degree | - | - |
| Total | - | - |
Family Income in Pine River
Family Income Brackets in Pine River
According to the Pine River family income data, there are 13 families falling into the $35,000 to $49,999 income range, which is the most common income bracket and makes up 30.2% of all families.
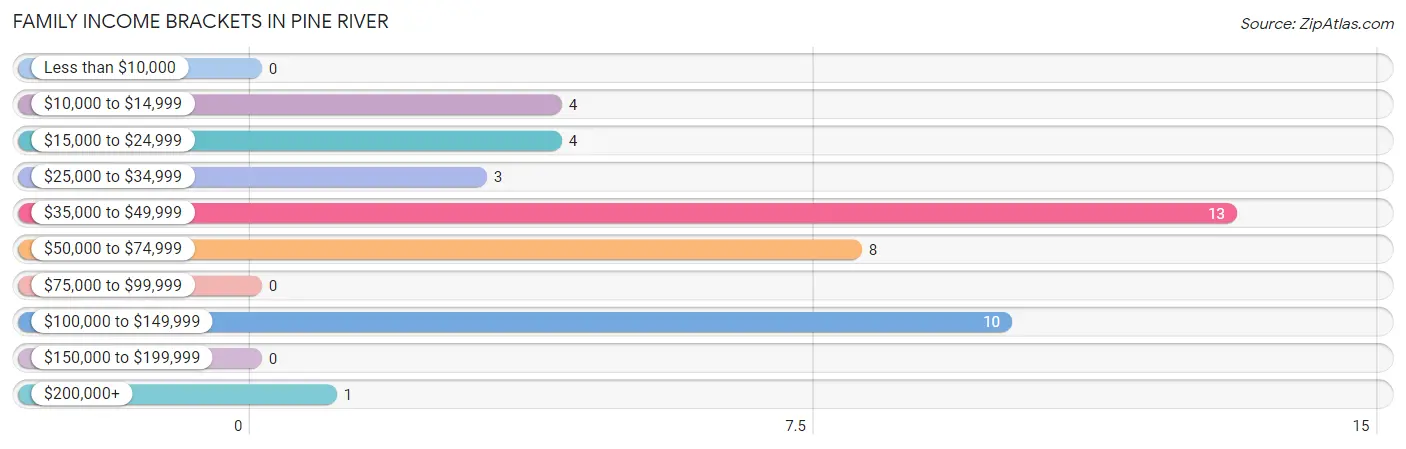
| Income Bracket | # Families | % Families |
| Less than $10,000 | 0 | 0.0% |
| $10,000 to $14,999 | 4 | 9.3% |
| $15,000 to $24,999 | 4 | 9.3% |
| $25,000 to $34,999 | 3 | 7.0% |
| $35,000 to $49,999 | 13 | 30.2% |
| $50,000 to $74,999 | 8 | 18.6% |
| $75,000 to $99,999 | 0 | 0.0% |
| $100,000 to $149,999 | 10 | 23.3% |
| $150,000 to $199,999 | 0 | 0.0% |
| $200,000+ | 1 | 2.3% |
Family Income by Famaliy Size in Pine River
2-person families (25 | 58.1%) account for the highest median family income in Pine River with $60,625 per family, while 2-person families (25 | 58.1%) have the highest median income of $30,312 per family member.
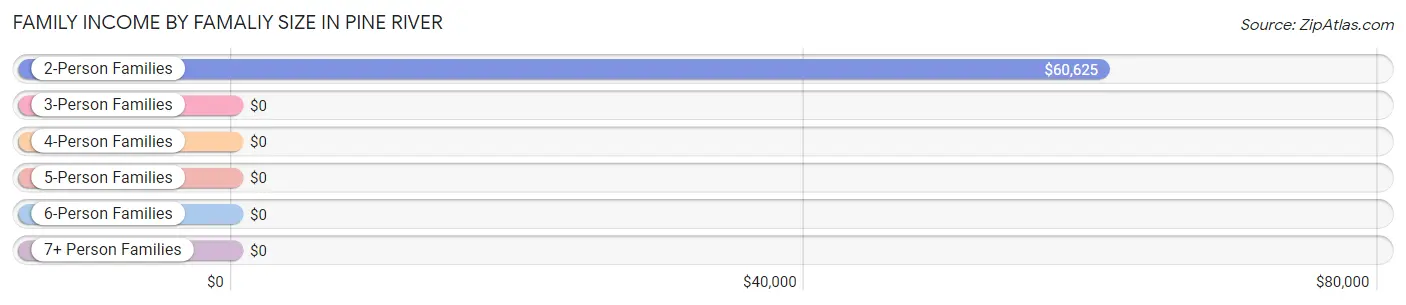
| Income Bracket | # Families | Median Income |
| 2-Person Families | 25 (58.1%) | $60,625 |
| 3-Person Families | 14 (32.6%) | $0 |
| 4-Person Families | 4 (9.3%) | $0 |
| 5-Person Families | 0 (0.0%) | $0 |
| 6-Person Families | 0 (0.0%) | $0 |
| 7+ Person Families | 0 (0.0%) | $0 |
| Total | 43 (100.0%) | $44,219 |
Family Income by Number of Earners in Pine River
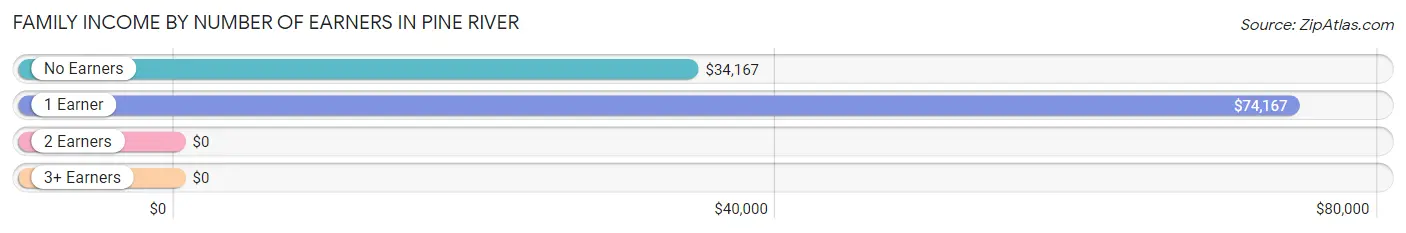
| Number of Earners | # Families | Median Income |
| No Earners | 12 (27.9%) | $34,167 |
| 1 Earner | 10 (23.3%) | $74,167 |
| 2 Earners | 13 (30.2%) | $0 |
| 3+ Earners | 8 (18.6%) | $0 |
| Total | 43 (100.0%) | $44,219 |
Household Income in Pine River
Household Income Brackets in Pine River
With 16 households falling in the category, the $35,000 to $49,999 income range is the most frequent in Pine River, accounting for 26.2% of all households.
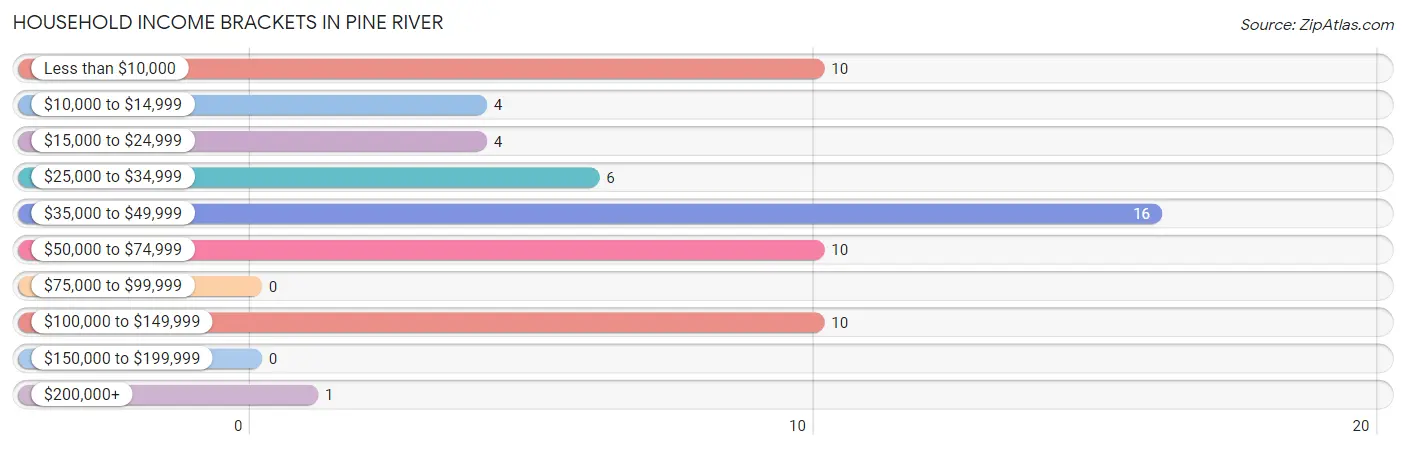
| Income Bracket | # Households | % Households |
| Less than $10,000 | 10 | 16.4% |
| $10,000 to $14,999 | 4 | 6.6% |
| $15,000 to $24,999 | 4 | 6.6% |
| $25,000 to $34,999 | 6 | 9.8% |
| $35,000 to $49,999 | 16 | 26.2% |
| $50,000 to $74,999 | 10 | 16.4% |
| $75,000 to $99,999 | 0 | 0.0% |
| $100,000 to $149,999 | 10 | 16.4% |
| $150,000 to $199,999 | 0 | 0.0% |
| $200,000+ | 1 | 1.6% |
Household Income by Householder Age in Pine River
The median household income in Pine River is $41,250, with the highest median household income of $110,625 found in the 25 to 44 years age bracket for the primary householder. A total of 10 households (16.4%) fall into this category.
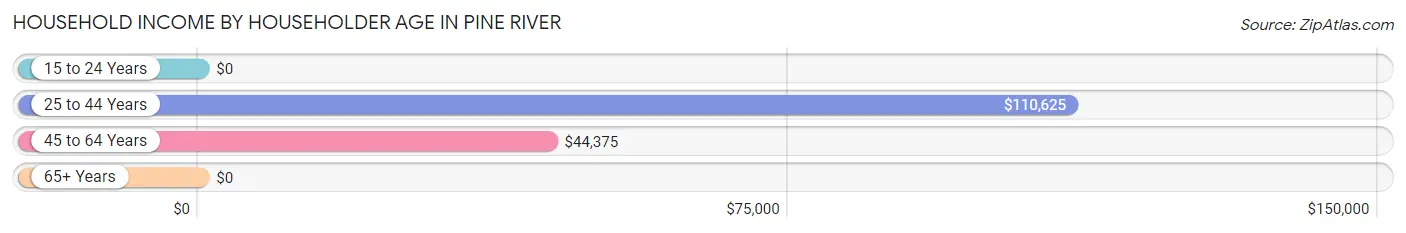
| Income Bracket | # Households | Median Income |
| 15 to 24 Years | 0 (0.0%) | $0 |
| 25 to 44 Years | 10 (16.4%) | $110,625 |
| 45 to 64 Years | 28 (45.9%) | $44,375 |
| 65+ Years | 23 (37.7%) | $0 |
| Total | 61 (100.0%) | $41,250 |
Poverty in Pine River
Income Below Poverty by Sex and Age in Pine River
With 22.8% poverty level for males and 16.4% for females among the residents of Pine River, 16 and 17 year old males and 6 to 11 year old females are the most vulnerable to poverty, with 3 males (100.0%) and 4 females (100.0%) in their respective age groups living below the poverty level.
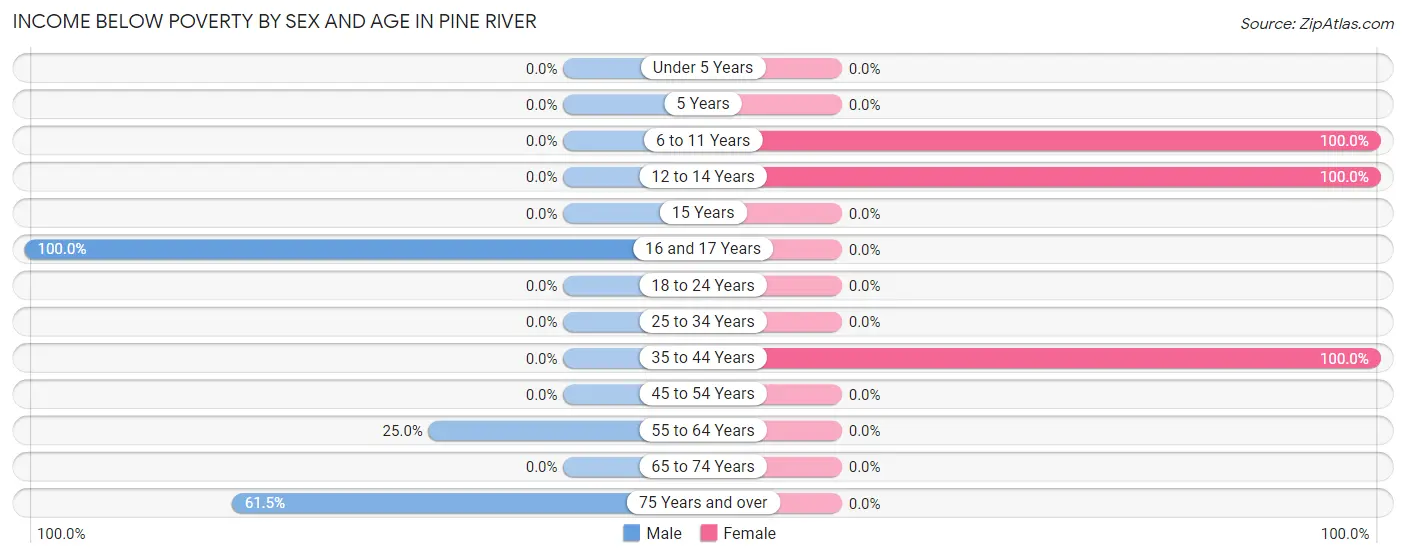
| Age Bracket | Male | Female |
| Under 5 Years | 0 (0.0%) | 0 (0.0%) |
| 5 Years | 0 (0.0%) | 0 (0.0%) |
| 6 to 11 Years | 0 (0.0%) | 4 (100.0%) |
| 12 to 14 Years | 0 (0.0%) | 4 (100.0%) |
| 15 Years | 0 (0.0%) | 0 (0.0%) |
| 16 and 17 Years | 3 (100.0%) | 0 (0.0%) |
| 18 to 24 Years | 0 (0.0%) | 0 (0.0%) |
| 25 to 34 Years | 0 (0.0%) | 0 (0.0%) |
| 35 to 44 Years | 0 (0.0%) | 4 (100.0%) |
| 45 to 54 Years | 0 (0.0%) | 0 (0.0%) |
| 55 to 64 Years | 2 (25.0%) | 0 (0.0%) |
| 65 to 74 Years | 0 (0.0%) | 0 (0.0%) |
| 75 Years and over | 8 (61.5%) | 0 (0.0%) |
| Total | 13 (22.8%) | 12 (16.4%) |
Income Above Poverty by Sex and Age in Pine River
According to the poverty statistics in Pine River, males aged 18 to 24 years and females aged under 5 years are the age groups that are most secure financially, with 100.0% of males and 100.0% of females in these age groups living above the poverty line.
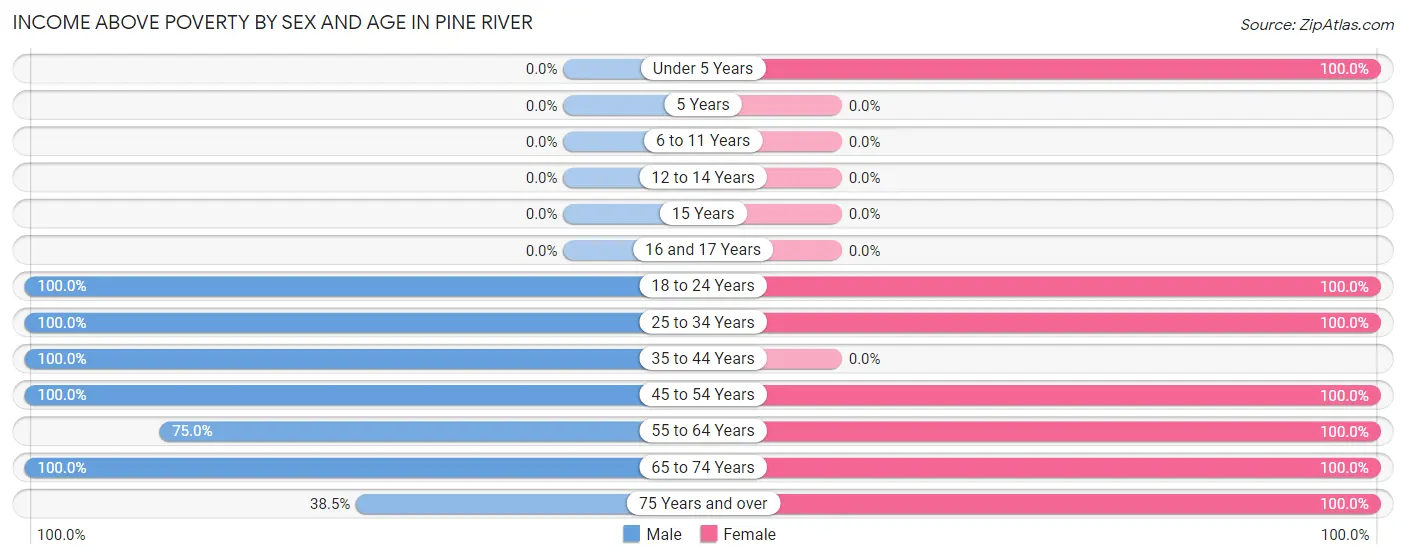
| Age Bracket | Male | Female |
| Under 5 Years | 0 (0.0%) | 8 (100.0%) |
| 5 Years | 0 (0.0%) | 0 (0.0%) |
| 6 to 11 Years | 0 (0.0%) | 0 (0.0%) |
| 12 to 14 Years | 0 (0.0%) | 0 (0.0%) |
| 15 Years | 0 (0.0%) | 0 (0.0%) |
| 16 and 17 Years | 0 (0.0%) | 0 (0.0%) |
| 18 to 24 Years | 3 (100.0%) | 12 (100.0%) |
| 25 to 34 Years | 2 (100.0%) | 6 (100.0%) |
| 35 to 44 Years | 4 (100.0%) | 0 (0.0%) |
| 45 to 54 Years | 17 (100.0%) | 15 (100.0%) |
| 55 to 64 Years | 6 (75.0%) | 3 (100.0%) |
| 65 to 74 Years | 7 (100.0%) | 10 (100.0%) |
| 75 Years and over | 5 (38.5%) | 7 (100.0%) |
| Total | 44 (77.2%) | 61 (83.6%) |
Income Below Poverty Among Married-Couple Families in Pine River
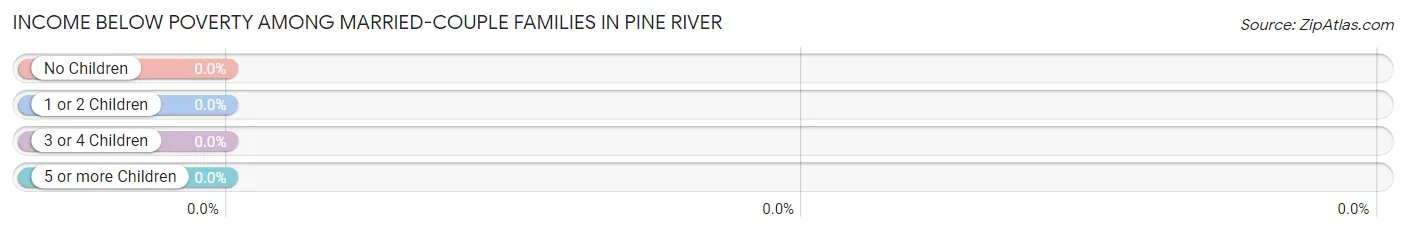
| Children | Above Poverty | Below Poverty |
| No Children | 30 (100.0%) | 0 (0.0%) |
| 1 or 2 Children | 6 (100.0%) | 0 (0.0%) |
| 3 or 4 Children | 0 (0.0%) | 0 (0.0%) |
| 5 or more Children | 0 (0.0%) | 0 (0.0%) |
| Total | 36 (100.0%) | 0 (0.0%) |
Income Below Poverty Among Single-Parent Households in Pine River
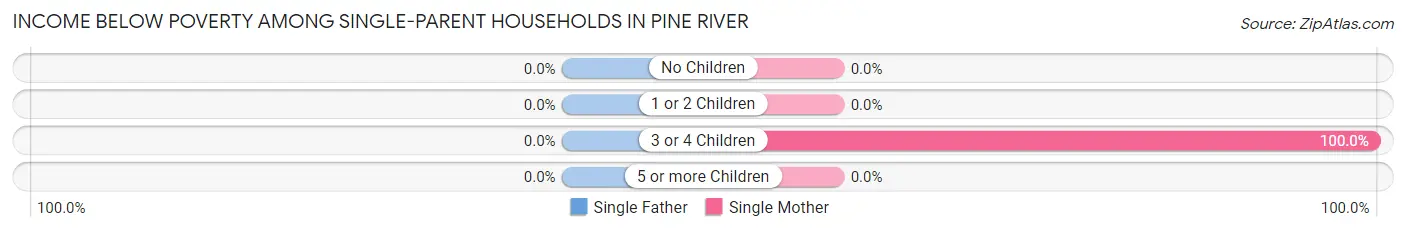
| Children | Single Father | Single Mother |
| No Children | 0 (0.0%) | 0 (0.0%) |
| 1 or 2 Children | 0 (0.0%) | 0 (0.0%) |
| 3 or 4 Children | 0 (0.0%) | 4 (100.0%) |
| 5 or more Children | 0 (0.0%) | 0 (0.0%) |
| Total | 0 (0.0%) | 4 (100.0%) |
Income Below Poverty Among Married-Couple vs Single-Parent Households in Pine River
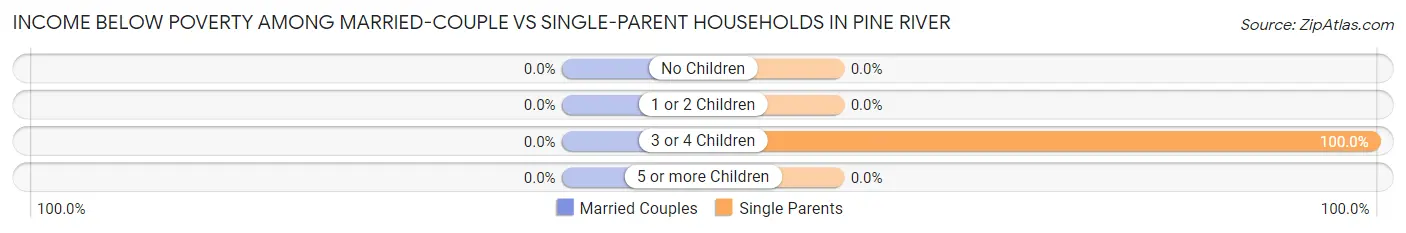
| Children | Married-Couple Families | Single-Parent Households |
| No Children | 0 (0.0%) | 0 (0.0%) |
| 1 or 2 Children | 0 (0.0%) | 0 (0.0%) |
| 3 or 4 Children | 0 (0.0%) | 4 (100.0%) |
| 5 or more Children | 0 (0.0%) | 0 (0.0%) |
| Total | 0 (0.0%) | 4 (57.1%) |
Race in Pine River
The most populous races in Pine River are White / Caucasian (126 | 96.9%), and Black / African American (4 | 3.1%).
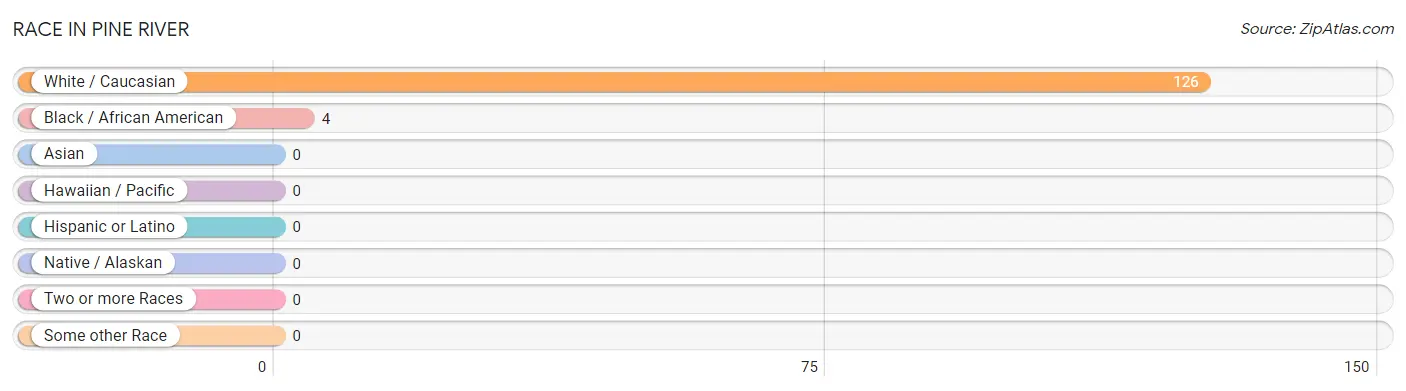
| Race | # Population | % Population |
| Asian | 0 | 0.0% |
| Black / African American | 4 | 3.1% |
| Hawaiian / Pacific | 0 | 0.0% |
| Hispanic or Latino | 0 | 0.0% |
| Native / Alaskan | 0 | 0.0% |
| White / Caucasian | 126 | 96.9% |
| Two or more Races | 0 | 0.0% |
| Some other Race | 0 | 0.0% |
| Total | 130 | 100.0% |
Ancestry in Pine River
The most populous ancestries reported in Pine River are German (43 | 33.1%), French (14 | 10.8%), American (12 | 9.2%), English (9 | 6.9%), and Australian (8 | 6.1%), together accounting for 66.1% of all Pine River residents.
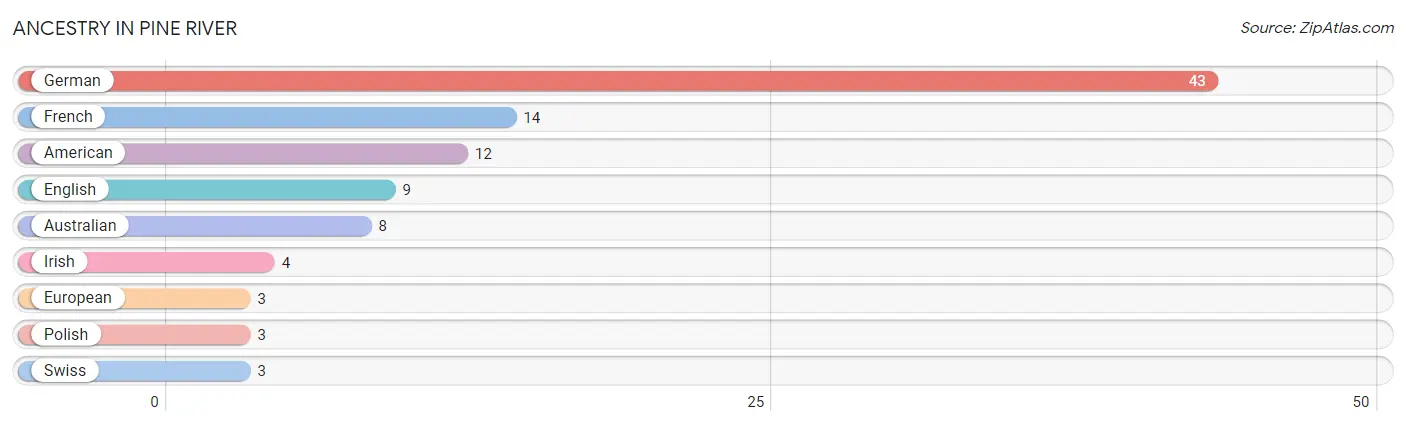
| Ancestry | # Population | % Population |
| American | 12 | 9.2% |
| Australian | 8 | 6.1% |
| English | 9 | 6.9% |
| European | 3 | 2.3% |
| French | 14 | 10.8% |
| German | 43 | 33.1% |
| Irish | 4 | 3.1% |
| Polish | 3 | 2.3% |
| Swiss | 3 | 2.3% | View All 9 Rows |
Immigrants in Pine River
The most numerous immigrant groups reported in Pine River came from Australia (8 | 6.1%), and Oceania (8 | 6.1%), together accounting for 12.3% of all Pine River residents.
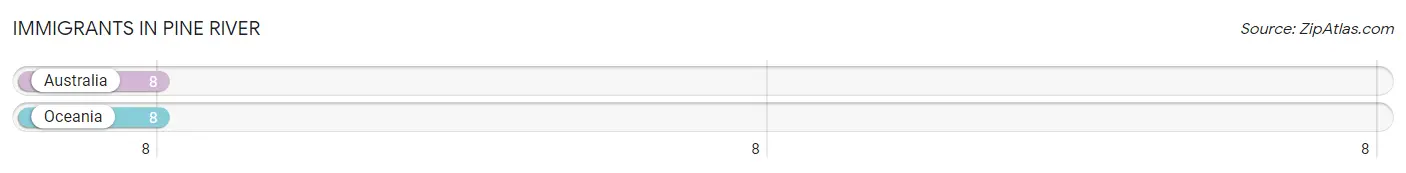
| Immigration Origin | # Population | % Population |
| Australia | 8 | 6.1% |
| Oceania | 8 | 6.1% | View All 2 Rows |
Sex and Age in Pine River
Sex and Age in Pine River
The most populous age groups in Pine River are 75 to 79 Years (10 | 17.5%) for men and 50 to 54 Years (15 | 20.5%) for women.
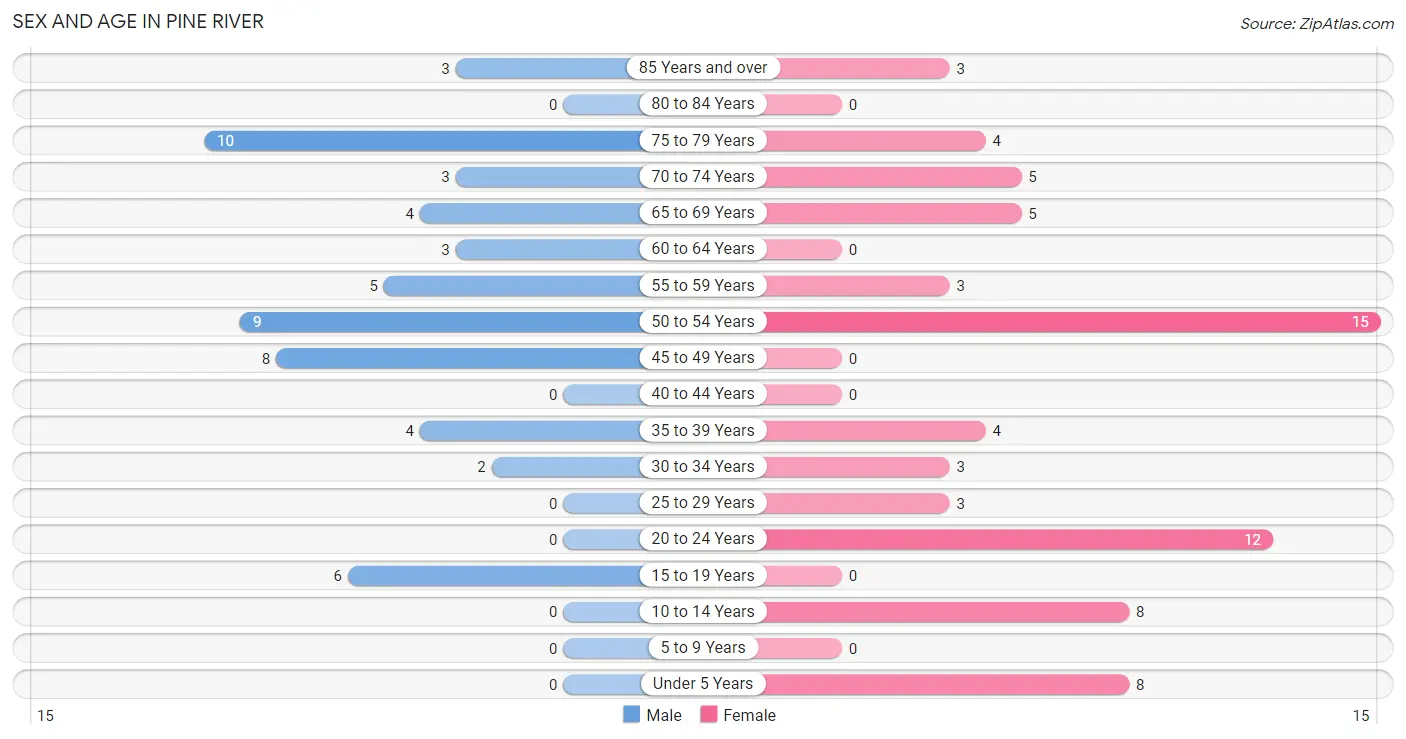
| Age Bracket | Male | Female |
| Under 5 Years | 0 (0.0%) | 8 (11.0%) |
| 5 to 9 Years | 0 (0.0%) | 0 (0.0%) |
| 10 to 14 Years | 0 (0.0%) | 8 (11.0%) |
| 15 to 19 Years | 6 (10.5%) | 0 (0.0%) |
| 20 to 24 Years | 0 (0.0%) | 12 (16.4%) |
| 25 to 29 Years | 0 (0.0%) | 3 (4.1%) |
| 30 to 34 Years | 2 (3.5%) | 3 (4.1%) |
| 35 to 39 Years | 4 (7.0%) | 4 (5.5%) |
| 40 to 44 Years | 0 (0.0%) | 0 (0.0%) |
| 45 to 49 Years | 8 (14.0%) | 0 (0.0%) |
| 50 to 54 Years | 9 (15.8%) | 15 (20.5%) |
| 55 to 59 Years | 5 (8.8%) | 3 (4.1%) |
| 60 to 64 Years | 3 (5.3%) | 0 (0.0%) |
| 65 to 69 Years | 4 (7.0%) | 5 (6.9%) |
| 70 to 74 Years | 3 (5.3%) | 5 (6.9%) |
| 75 to 79 Years | 10 (17.5%) | 4 (5.5%) |
| 80 to 84 Years | 0 (0.0%) | 0 (0.0%) |
| 85 Years and over | 3 (5.3%) | 3 (4.1%) |
| Total | 57 (100.0%) | 73 (100.0%) |
Families and Households in Pine River
Median Family Size in Pine River
The median family size in Pine River is 2.60 persons per family, with single female/mother families (4 | 9.3%) accounting for the largest median family size of 3.75 persons per family. On the other hand, single male/father families (3 | 7.0%) represent the smallest median family size with 2.00 persons per family.
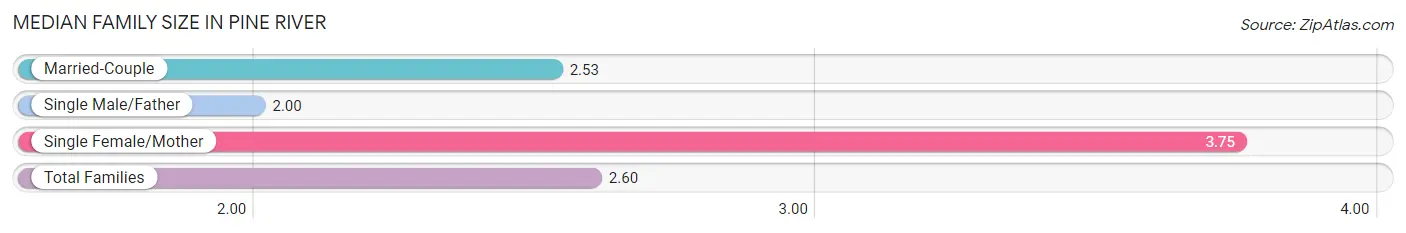
| Family Type | # Families | Family Size |
| Married-Couple | 36 (83.7%) | 2.53 |
| Single Male/Father | 3 (7.0%) | 2.00 |
| Single Female/Mother | 4 (9.3%) | 3.75 |
| Total Families | 43 (100.0%) | 2.60 |
Median Household Size in Pine River
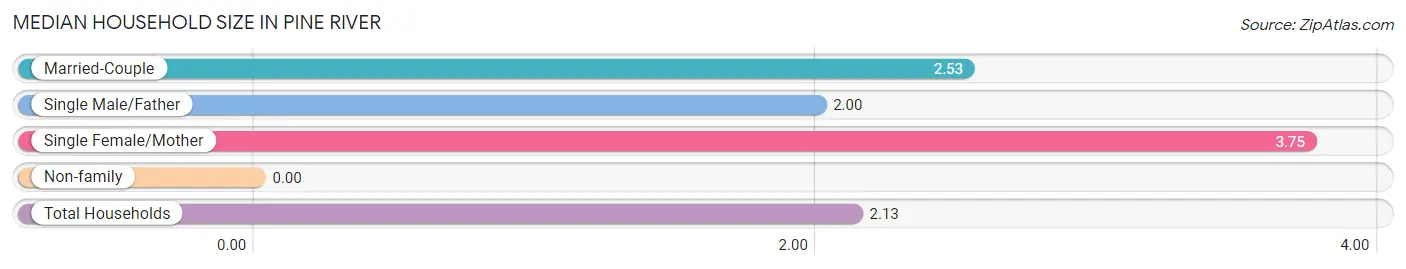
| Household Type | # Households | Household Size |
| Married-Couple | 36 (59.0%) | 2.53 |
| Single Male/Father | 3 (4.9%) | 2.00 |
| Single Female/Mother | 4 (6.6%) | 3.75 |
| Non-family | 18 (29.5%) | - |
| Total Households | 61 (100.0%) | 2.13 |
Household Size by Marriage Status in Pine River
Out of a total of 61 households in Pine River, 43 (70.5%) are family households, while 18 (29.5%) are nonfamily households. The most numerous type of family households are 2-person households, comprising 25, and the most common type of nonfamily households are 1-person households, comprising 18.
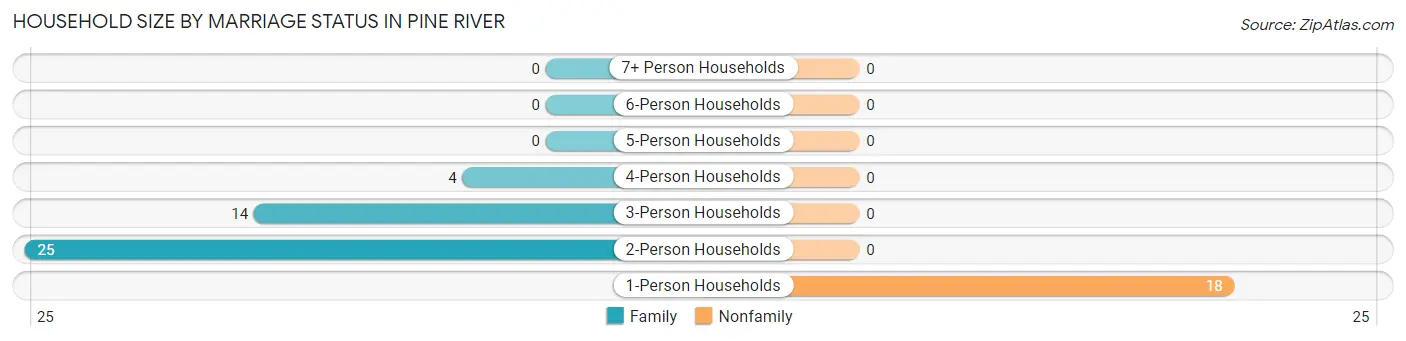
| Household Size | Family Households | Nonfamily Households |
| 1-Person Households | - | 18 (29.5%) |
| 2-Person Households | 25 (41.0%) | 0 (0.0%) |
| 3-Person Households | 14 (23.0%) | 0 (0.0%) |
| 4-Person Households | 4 (6.6%) | 0 (0.0%) |
| 5-Person Households | 0 (0.0%) | 0 (0.0%) |
| 6-Person Households | 0 (0.0%) | 0 (0.0%) |
| 7+ Person Households | 0 (0.0%) | 0 (0.0%) |
| Total | 43 (70.5%) | 18 (29.5%) |
Female Fertility in Pine River
Fertility by Age in Pine River
Average fertility rate in Pine River is 88.0 births per 1,000 women. Women in the age bracket of 20 to 34 years have the highest fertility rate with 167.0 births per 1,000 women. Women in the age bracket of 20 to 34 years acount for 100.0% of all women with births.
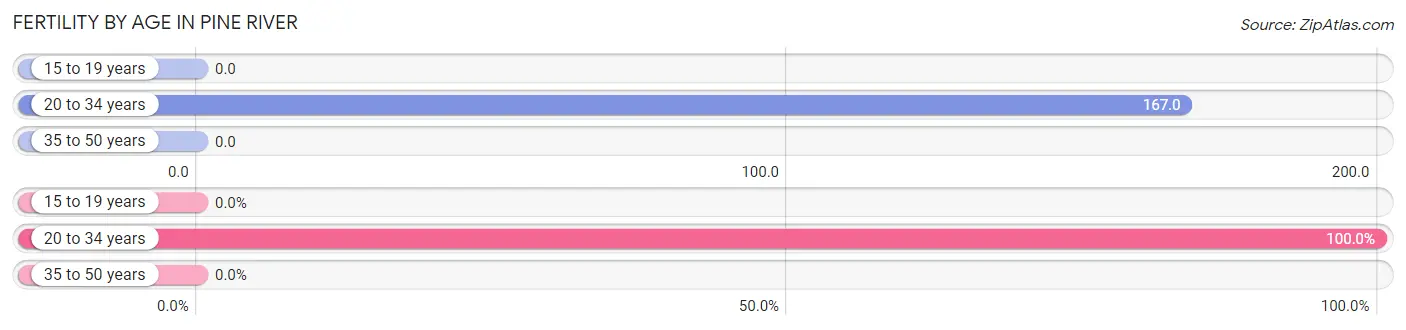
| Age Bracket | Women with Births | Births / 1,000 Women |
| 15 to 19 years | 0 (0.0%) | 0.0 |
| 20 to 34 years | 3 (100.0%) | 167.0 |
| 35 to 50 years | 0 (0.0%) | 0.0 |
| Total | 3 (100.0%) | 88.0 |
Fertility by Age by Marriage Status in Pine River

| Age Bracket | Married | Unmarried |
| 15 to 19 years | 0 (0.0%) | 0 (0.0%) |
| 20 to 34 years | 3 (100.0%) | 0 (0.0%) |
| 35 to 50 years | 0 (0.0%) | 0 (0.0%) |
| Total | 3 (100.0%) | 0 (0.0%) |
Fertility by Education in Pine River
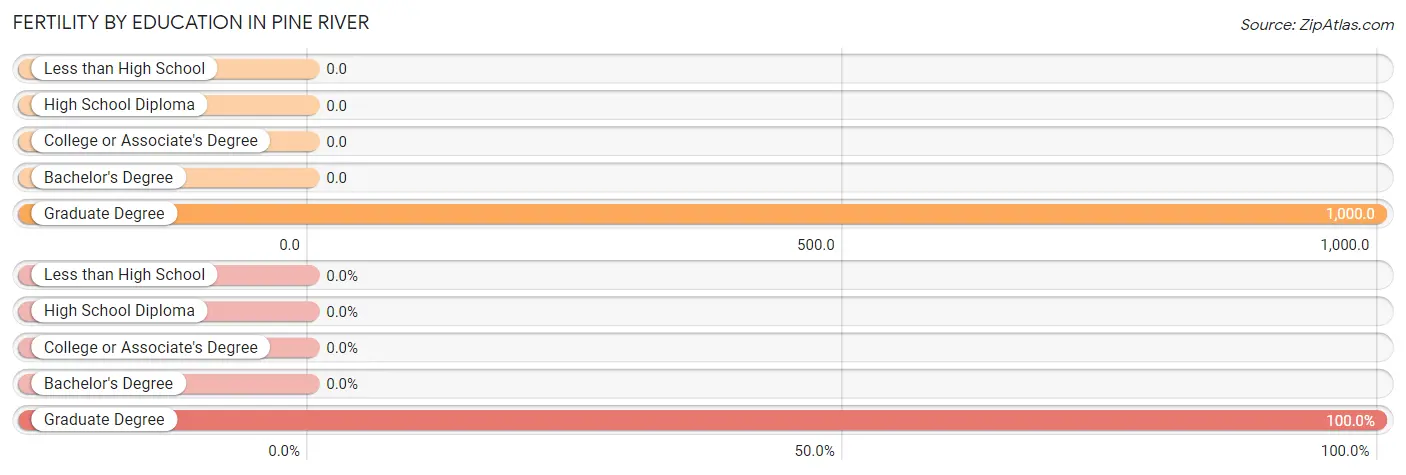
| Educational Attainment | Women with Births | Births / 1,000 Women |
| Less than High School | 0 (0.0%) | 0.0 |
| High School Diploma | 0 (0.0%) | 0.0 |
| College or Associate's Degree | 0 (0.0%) | 0.0 |
| Bachelor's Degree | 0 (0.0%) | 0.0 |
| Graduate Degree | 3 (100.0%) | 1,000.0 |
| Total | 3 (100.0%) | 88.0 |
Fertility by Education by Marriage Status in Pine River
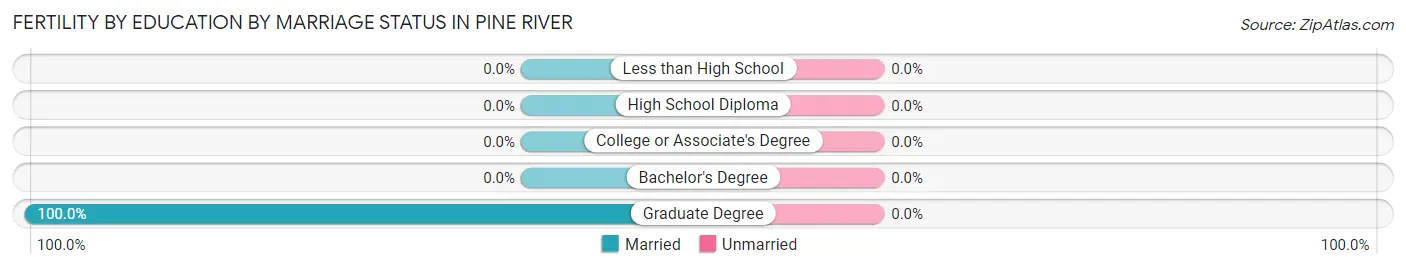
| Educational Attainment | Married | Unmarried |
| Less than High School | 0 (0.0%) | 0 (0.0%) |
| High School Diploma | 0 (0.0%) | 0 (0.0%) |
| College or Associate's Degree | 0 (0.0%) | 0 (0.0%) |
| Bachelor's Degree | 0 (0.0%) | 0 (0.0%) |
| Graduate Degree | 3 (100.0%) | 0 (0.0%) |
| Total | 3 (100.0%) | 0 (0.0%) |
Employment Characteristics in Pine River
Employment by Class of Employer in Pine River
Among the 65 employed individuals in Pine River, private company employees (40 | 61.5%), self-employed (not incorporated) (11 | 16.9%), and unpaid family workers (8 | 12.3%) make up the most common classes of employment.
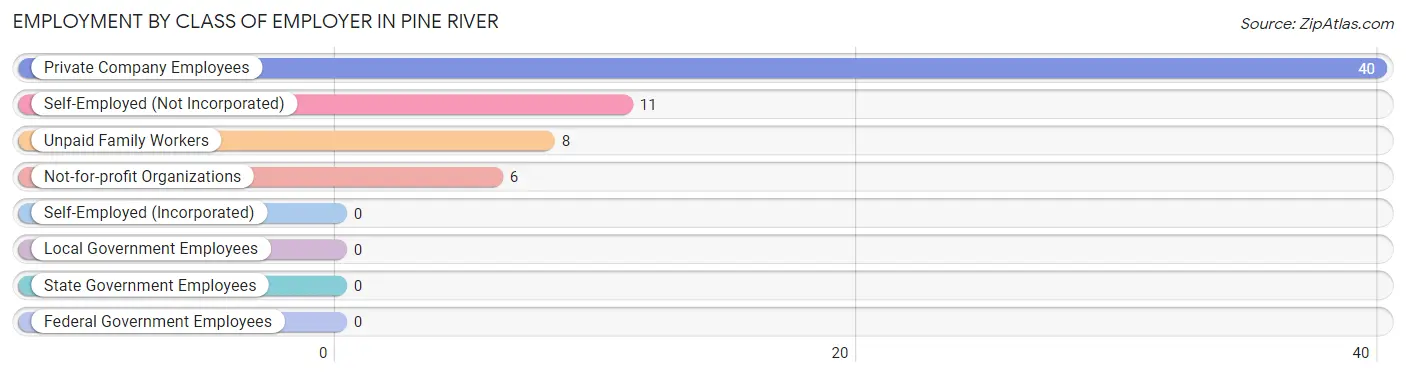
| Employer Class | # Employees | % Employees |
| Private Company Employees | 40 | 61.5% |
| Self-Employed (Incorporated) | 0 | 0.0% |
| Self-Employed (Not Incorporated) | 11 | 16.9% |
| Not-for-profit Organizations | 6 | 9.2% |
| Local Government Employees | 0 | 0.0% |
| State Government Employees | 0 | 0.0% |
| Federal Government Employees | 0 | 0.0% |
| Unpaid Family Workers | 8 | 12.3% |
| Total | 65 | 100.0% |
Employment Status by Age in Pine River
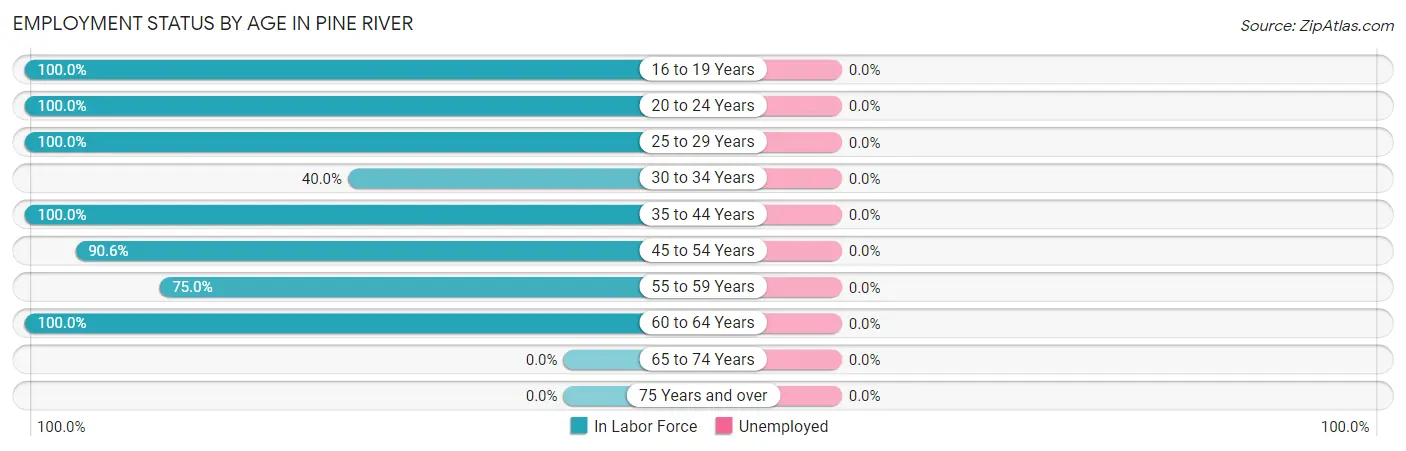
| Age Bracket | In Labor Force | Unemployed |
| 16 to 19 Years | 6 (100.0%) | 0 (0.0%) |
| 20 to 24 Years | 12 (100.0%) | 0 (0.0%) |
| 25 to 29 Years | 3 (100.0%) | 0 (0.0%) |
| 30 to 34 Years | 2 (40.0%) | 0 (0.0%) |
| 35 to 44 Years | 8 (100.0%) | 0 (0.0%) |
| 45 to 54 Years | 29 (90.6%) | 0 (0.0%) |
| 55 to 59 Years | 6 (75.0%) | 0 (0.0%) |
| 60 to 64 Years | 3 (100.0%) | 0 (0.0%) |
| 65 to 74 Years | 0 (0.0%) | 0 (0.0%) |
| 75 Years and over | 0 (0.0%) | 0 (0.0%) |
| Total | 69 (60.5%) | 0 (0.0%) |
Employment Status by Educational Attainment in Pine River
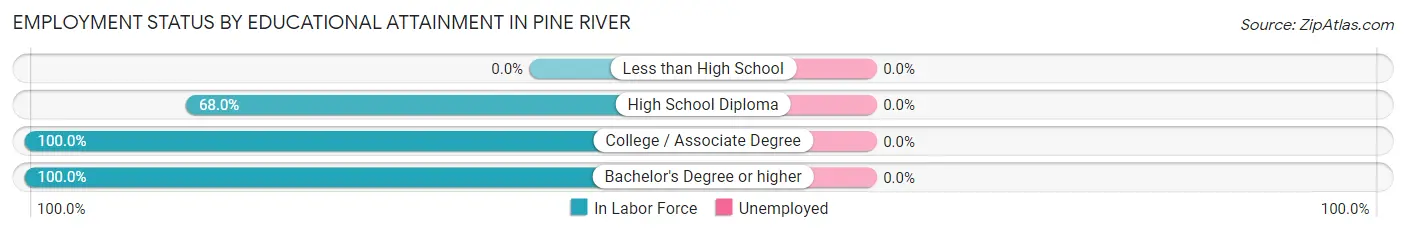
| Educational Attainment | In Labor Force | Unemployed |
| Less than High School | 0 (0.0%) | 0 (0.0%) |
| High School Diploma | 17 (68.0%) | 0 (0.0%) |
| College / Associate Degree | 25 (100.0%) | 0 (0.0%) |
| Bachelor's Degree or higher | 9 (100.0%) | 0 (0.0%) |
| Total | 51 (86.4%) | 0 (0.0%) |
Employment Occupations by Sex in Pine River
Management, Business, Science and Arts Occupations
The most common Management, Business, Science and Arts occupations in Pine River are Health Diagnosing & Treating (6 | 8.7%), Computers, Engineering & Science (3 | 4.3%), Computers & Mathematics (3 | 4.3%), and Health Technologists (3 | 4.3%).
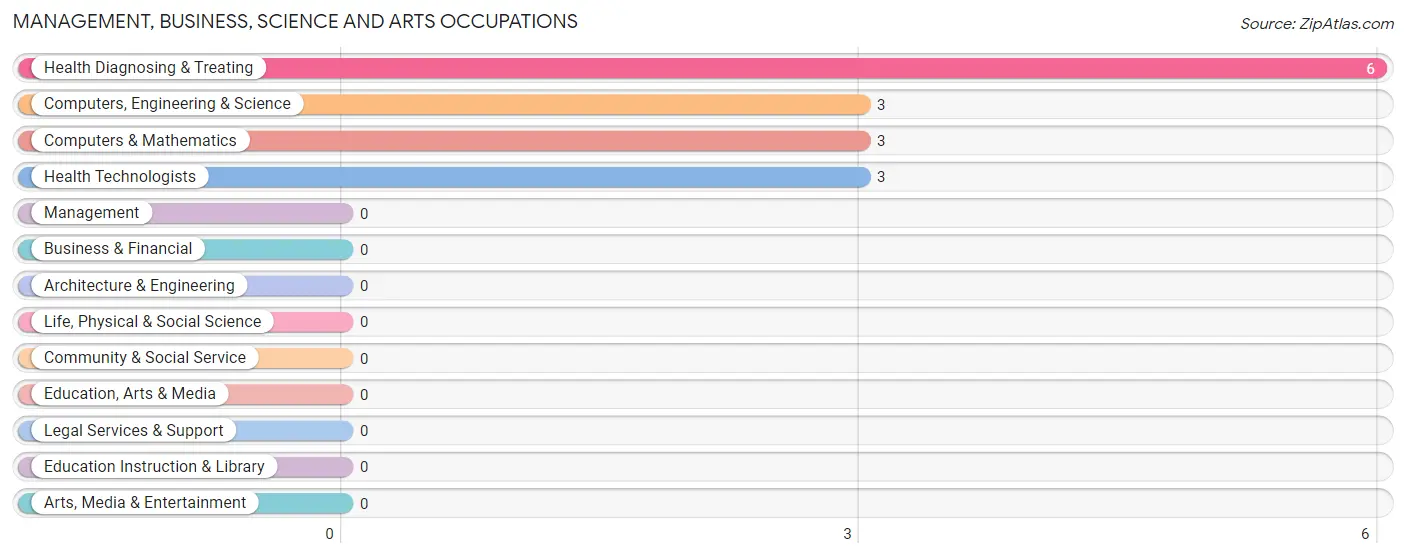
Management, Business, Science and Arts Occupations by Sex
Within the Management, Business, Science and Arts occupations in Pine River, the most male-oriented occupations are Computers, Engineering & Science (100.0%), and Computers & Mathematics (100.0%), while the most female-oriented occupations are Health Diagnosing & Treating (100.0%), and Health Technologists (100.0%).
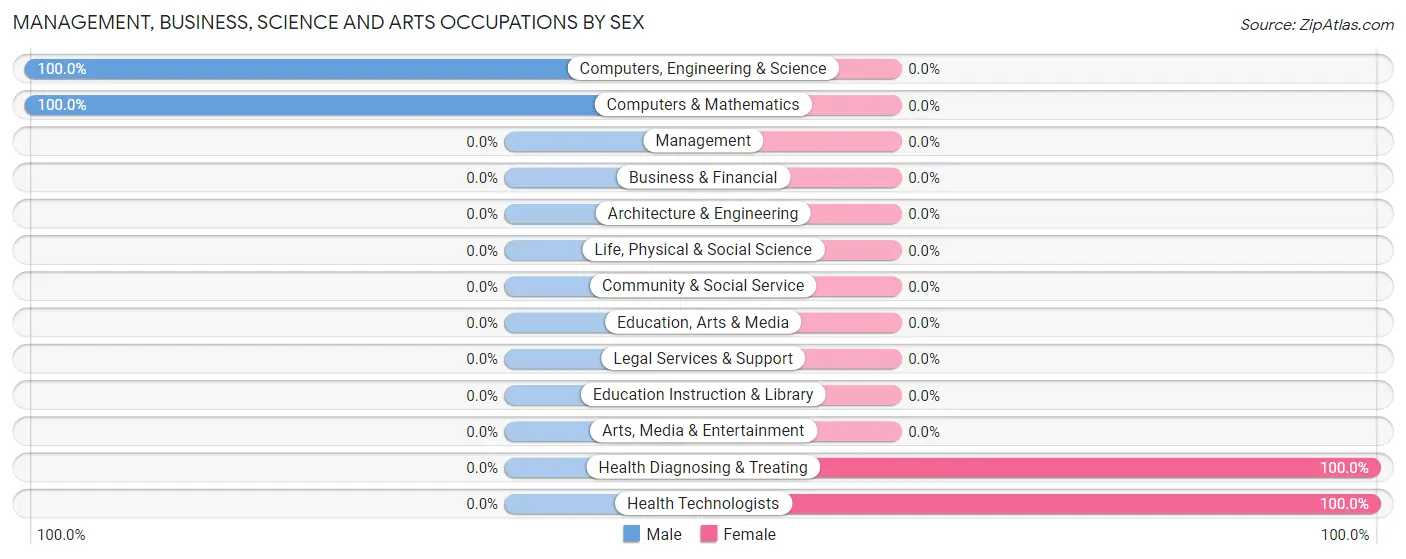
| Occupation | Male | Female |
| Management | 0 (0.0%) | 0 (0.0%) |
| Business & Financial | 0 (0.0%) | 0 (0.0%) |
| Computers, Engineering & Science | 3 (100.0%) | 0 (0.0%) |
| Computers & Mathematics | 3 (100.0%) | 0 (0.0%) |
| Architecture & Engineering | 0 (0.0%) | 0 (0.0%) |
| Life, Physical & Social Science | 0 (0.0%) | 0 (0.0%) |
| Community & Social Service | 0 (0.0%) | 0 (0.0%) |
| Education, Arts & Media | 0 (0.0%) | 0 (0.0%) |
| Legal Services & Support | 0 (0.0%) | 0 (0.0%) |
| Education Instruction & Library | 0 (0.0%) | 0 (0.0%) |
| Arts, Media & Entertainment | 0 (0.0%) | 0 (0.0%) |
| Health Diagnosing & Treating | 0 (0.0%) | 6 (100.0%) |
| Health Technologists | 0 (0.0%) | 3 (100.0%) |
| Total (Category) | 3 (33.3%) | 6 (66.7%) |
| Total (Overall) | 32 (46.4%) | 37 (53.6%) |
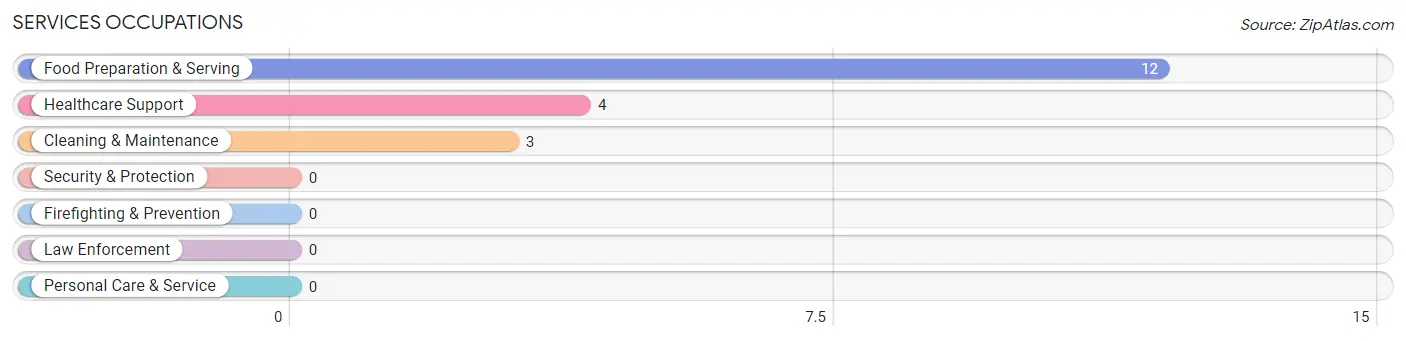
Services Occupations
The most common Services occupations in Pine River are Food Preparation & Serving (12 | 17.4%), Healthcare Support (4 | 5.8%), and Cleaning & Maintenance (3 | 4.3%).
Services Occupations by Sex
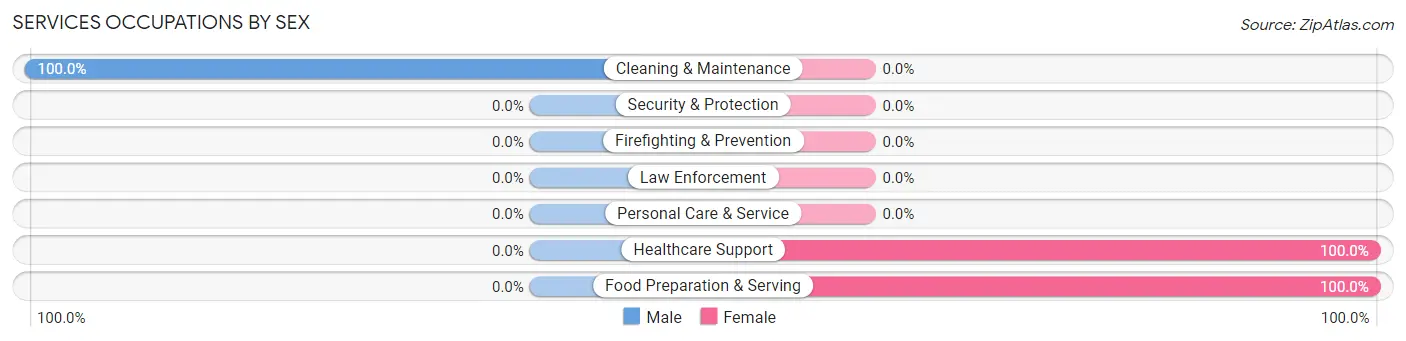
| Occupation | Male | Female |
| Healthcare Support | 0 (0.0%) | 4 (100.0%) |
| Security & Protection | 0 (0.0%) | 0 (0.0%) |
| Firefighting & Prevention | 0 (0.0%) | 0 (0.0%) |
| Law Enforcement | 0 (0.0%) | 0 (0.0%) |
| Food Preparation & Serving | 0 (0.0%) | 12 (100.0%) |
| Cleaning & Maintenance | 3 (100.0%) | 0 (0.0%) |
| Personal Care & Service | 0 (0.0%) | 0 (0.0%) |
| Total (Category) | 3 (15.8%) | 16 (84.2%) |
| Total (Overall) | 32 (46.4%) | 37 (53.6%) |
Sales and Office Occupations
The most common Sales and Office occupations in Pine River are Sales & Related (4 | 5.8%), and Office & Administration (3 | 4.3%).

Sales and Office Occupations by Sex

| Occupation | Male | Female |
| Sales & Related | 0 (0.0%) | 4 (100.0%) |
| Office & Administration | 0 (0.0%) | 3 (100.0%) |
| Total (Category) | 0 (0.0%) | 7 (100.0%) |
| Total (Overall) | 32 (46.4%) | 37 (53.6%) |
Natural Resources, Construction and Maintenance Occupations
The most common Natural Resources, Construction and Maintenance occupations in Pine River are , and Construction & Extraction (4 | 5.8%).
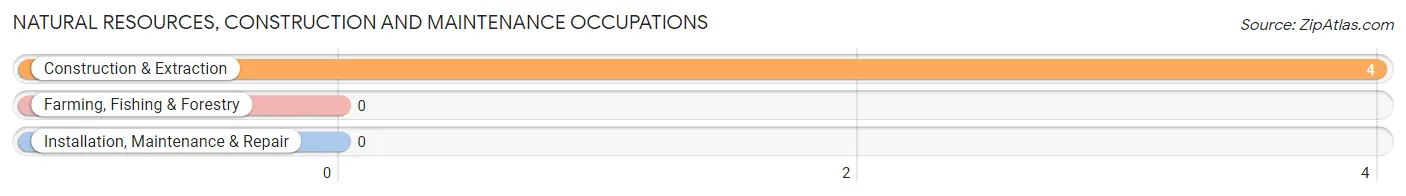
Natural Resources, Construction and Maintenance Occupations by Sex

| Occupation | Male | Female |
| Farming, Fishing & Forestry | 0 (0.0%) | 0 (0.0%) |
| Construction & Extraction | 4 (100.0%) | 0 (0.0%) |
| Installation, Maintenance & Repair | 0 (0.0%) | 0 (0.0%) |
| Total (Category) | 4 (100.0%) | 0 (0.0%) |
| Total (Overall) | 32 (46.4%) | 37 (53.6%) |
Production, Transportation and Moving Occupations
The most common Production, Transportation and Moving occupations in Pine River are Material Moving (16 | 23.2%), Production (8 | 11.6%), and Transportation (6 | 8.7%).
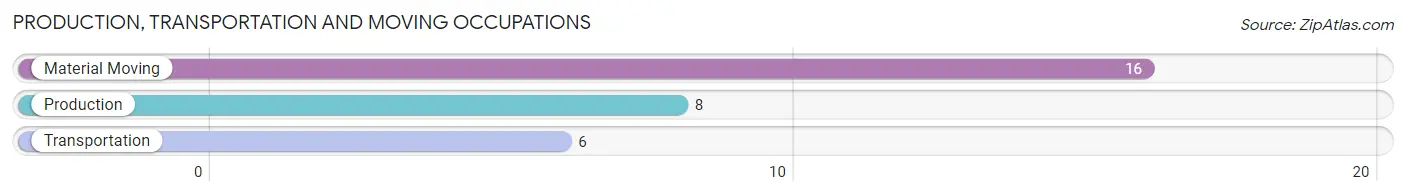
Production, Transportation and Moving Occupations by Sex
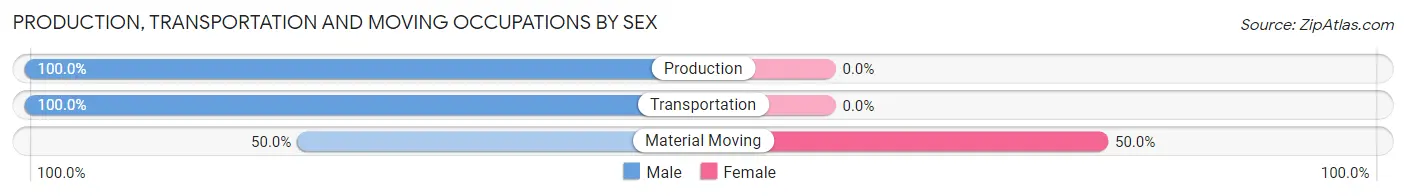
| Occupation | Male | Female |
| Production | 8 (100.0%) | 0 (0.0%) |
| Transportation | 6 (100.0%) | 0 (0.0%) |
| Material Moving | 8 (50.0%) | 8 (50.0%) |
| Total (Category) | 22 (73.3%) | 8 (26.7%) |
| Total (Overall) | 32 (46.4%) | 37 (53.6%) |
Employment Industries by Sex in Pine River
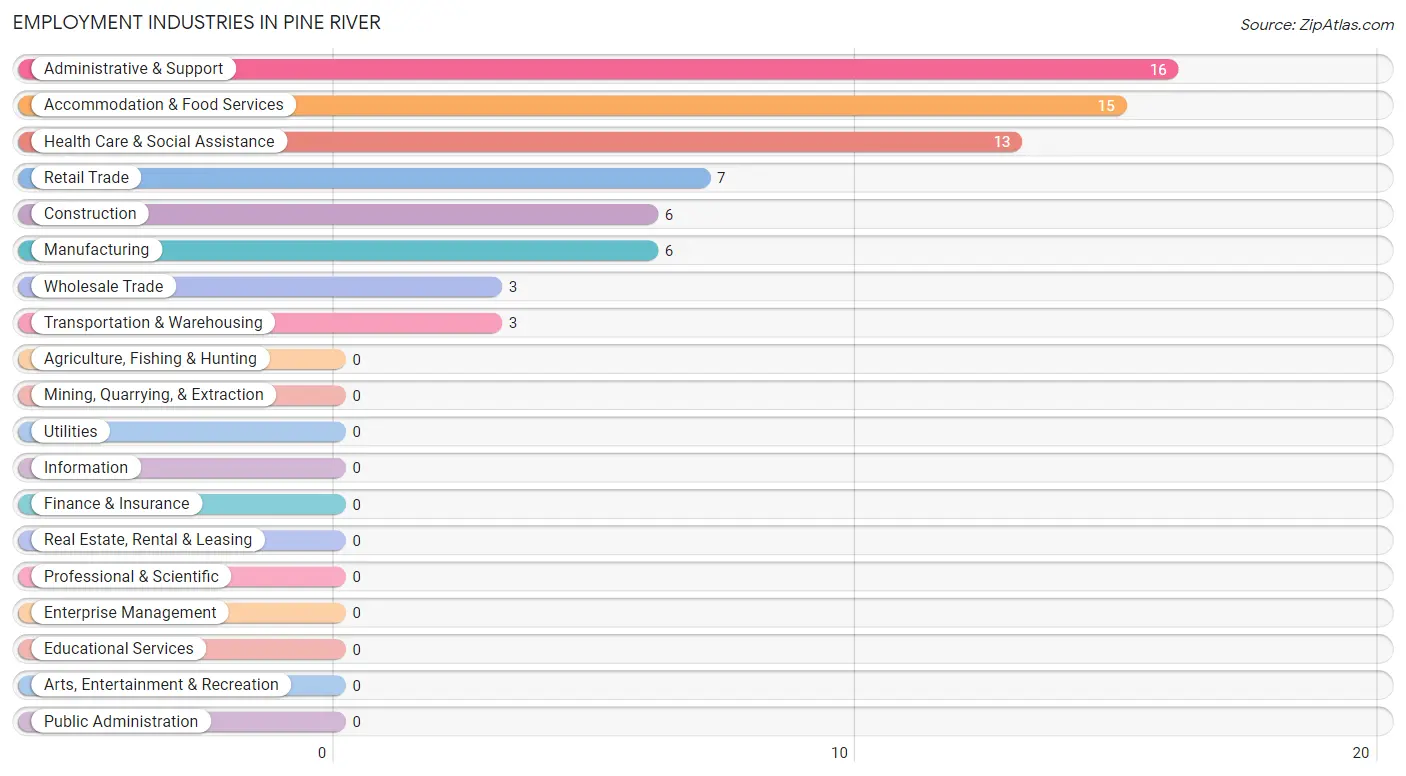
Employment Industries in Pine River
The major employment industries in Pine River include Administrative & Support (16 | 23.2%), Accommodation & Food Services (15 | 21.7%), Health Care & Social Assistance (13 | 18.8%), Retail Trade (7 | 10.1%), and Construction (6 | 8.7%).
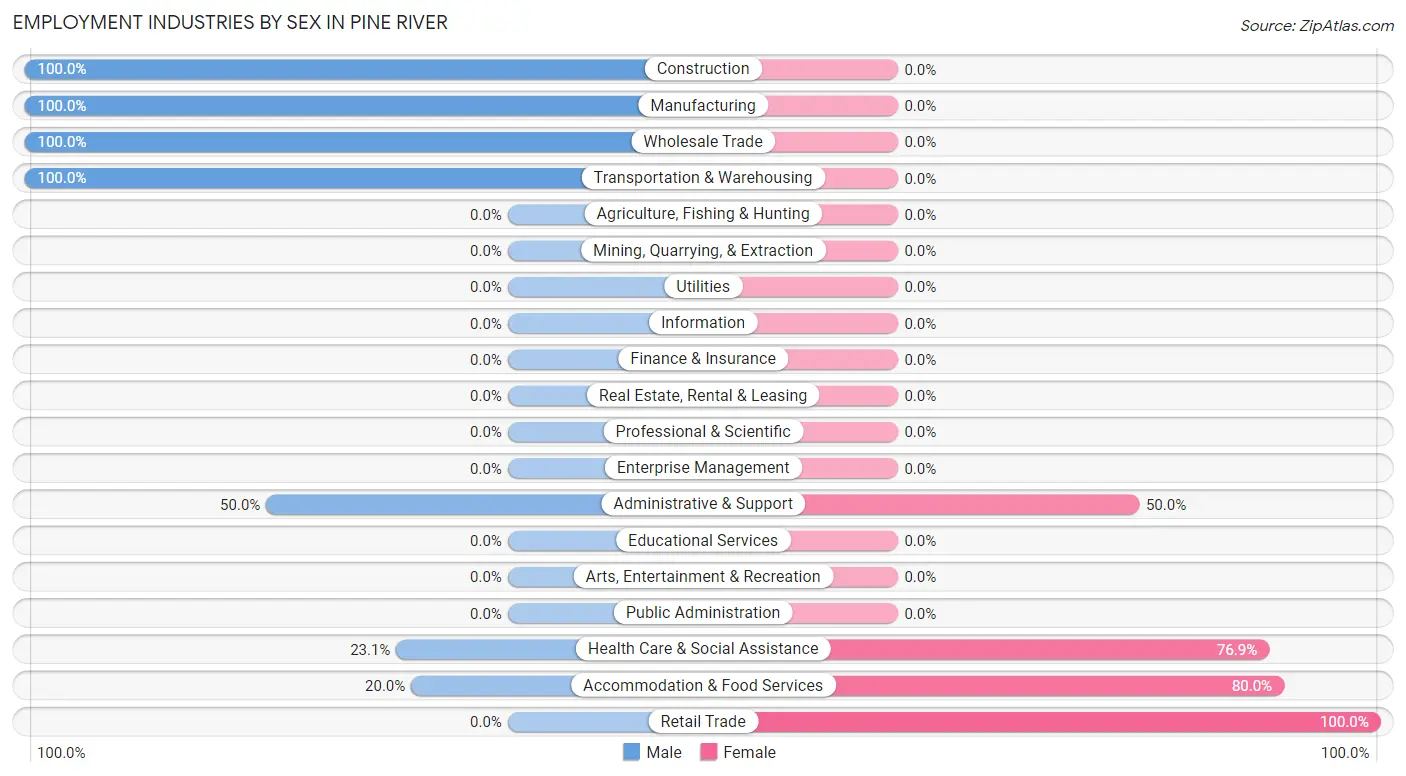
Employment Industries by Sex in Pine River
The Pine River industries that see more men than women are Construction (100.0%), Manufacturing (100.0%), and Wholesale Trade (100.0%), whereas the industries that tend to have a higher number of women are Retail Trade (100.0%), Accommodation & Food Services (80.0%), and Health Care & Social Assistance (76.9%).
| Industry | Male | Female |
| Agriculture, Fishing & Hunting | 0 (0.0%) | 0 (0.0%) |
| Mining, Quarrying, & Extraction | 0 (0.0%) | 0 (0.0%) |
| Construction | 6 (100.0%) | 0 (0.0%) |
| Manufacturing | 6 (100.0%) | 0 (0.0%) |
| Wholesale Trade | 3 (100.0%) | 0 (0.0%) |
| Retail Trade | 0 (0.0%) | 7 (100.0%) |
| Transportation & Warehousing | 3 (100.0%) | 0 (0.0%) |
| Utilities | 0 (0.0%) | 0 (0.0%) |
| Information | 0 (0.0%) | 0 (0.0%) |
| Finance & Insurance | 0 (0.0%) | 0 (0.0%) |
| Real Estate, Rental & Leasing | 0 (0.0%) | 0 (0.0%) |
| Professional & Scientific | 0 (0.0%) | 0 (0.0%) |
| Enterprise Management | 0 (0.0%) | 0 (0.0%) |
| Administrative & Support | 8 (50.0%) | 8 (50.0%) |
| Educational Services | 0 (0.0%) | 0 (0.0%) |
| Health Care & Social Assistance | 3 (23.1%) | 10 (76.9%) |
| Arts, Entertainment & Recreation | 0 (0.0%) | 0 (0.0%) |
| Accommodation & Food Services | 3 (20.0%) | 12 (80.0%) |
| Public Administration | 0 (0.0%) | 0 (0.0%) |
| Total | 32 (46.4%) | 37 (53.6%) |
Education in Pine River
School Enrollment in Pine River
The most common levels of schooling among the 11 students in Pine River are elementary school (4 | 36.4%), middle school (4 | 36.4%), and high school (3 | 27.3%).
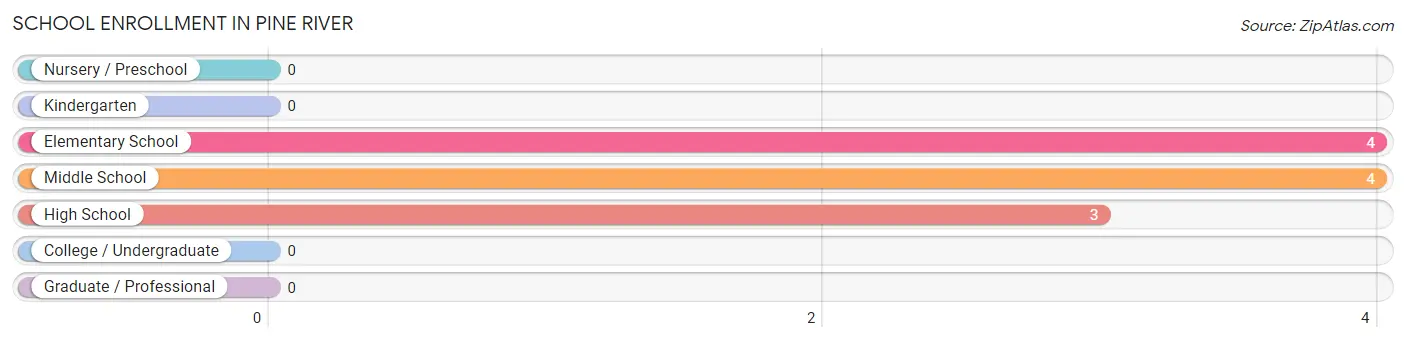
| School Level | # Students | % Students |
| Nursery / Preschool | 0 | 0.0% |
| Kindergarten | 0 | 0.0% |
| Elementary School | 4 | 36.4% |
| Middle School | 4 | 36.4% |
| High School | 3 | 27.3% |
| College / Undergraduate | 0 | 0.0% |
| Graduate / Professional | 0 | 0.0% |
| Total | 11 | 100.0% |
School Enrollment by Age by Funding Source in Pine River
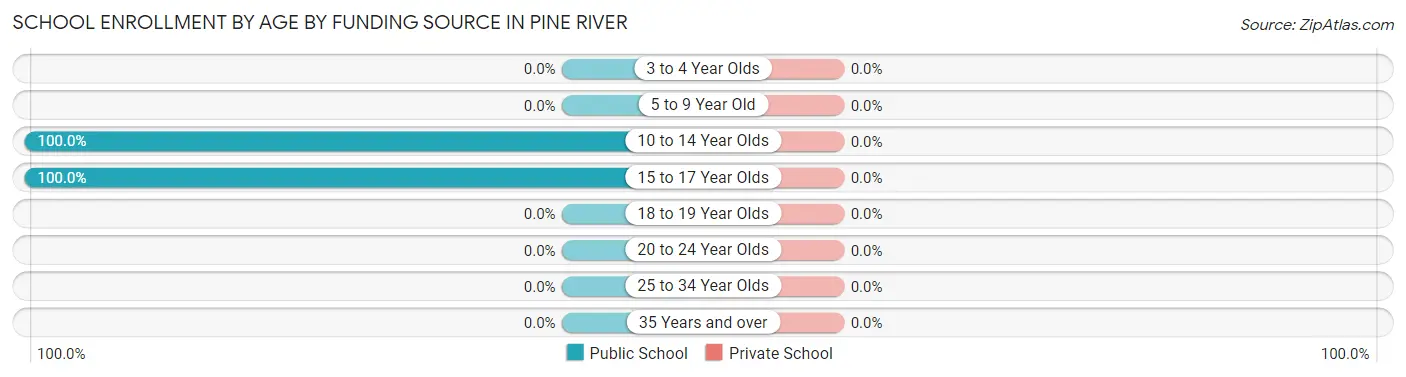
| Age Bracket | Public School | Private School |
| 3 to 4 Year Olds | 0 (0.0%) | 0 (0.0%) |
| 5 to 9 Year Old | 0 (0.0%) | 0 (0.0%) |
| 10 to 14 Year Olds | 8 (100.0%) | 0 (0.0%) |
| 15 to 17 Year Olds | 3 (100.0%) | 0 (0.0%) |
| 18 to 19 Year Olds | 0 (0.0%) | 0 (0.0%) |
| 20 to 24 Year Olds | 0 (0.0%) | 0 (0.0%) |
| 25 to 34 Year Olds | 0 (0.0%) | 0 (0.0%) |
| 35 Years and over | 0 (0.0%) | 0 (0.0%) |
| Total | 11 (100.0%) | 0 (0.0%) |
Educational Attainment by Field of Study in Pine River
Education (4 | 44.4%), science & technology (3 | 33.3%), and engineering (2 | 22.2%) are the most common fields of study among 9 individuals in Pine River who have obtained a bachelor's degree or higher.
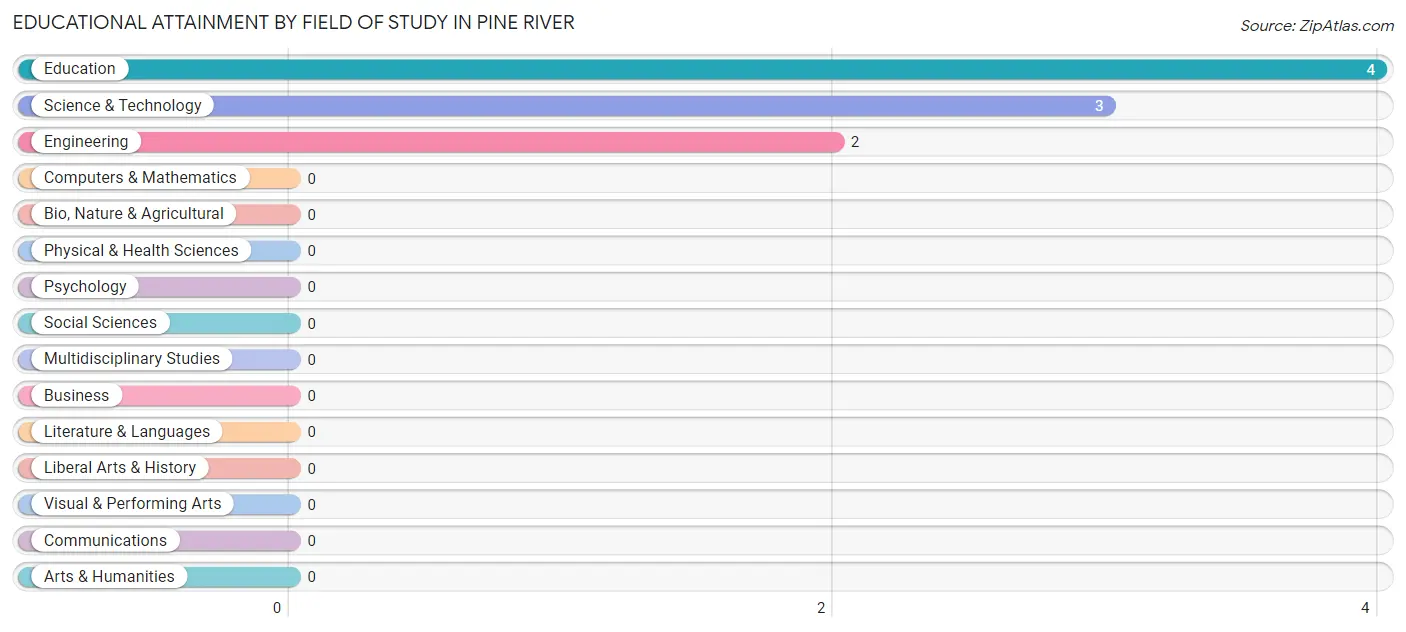
| Field of Study | # Graduates | % Graduates |
| Computers & Mathematics | 0 | 0.0% |
| Bio, Nature & Agricultural | 0 | 0.0% |
| Physical & Health Sciences | 0 | 0.0% |
| Psychology | 0 | 0.0% |
| Social Sciences | 0 | 0.0% |
| Engineering | 2 | 22.2% |
| Multidisciplinary Studies | 0 | 0.0% |
| Science & Technology | 3 | 33.3% |
| Business | 0 | 0.0% |
| Education | 4 | 44.4% |
| Literature & Languages | 0 | 0.0% |
| Liberal Arts & History | 0 | 0.0% |
| Visual & Performing Arts | 0 | 0.0% |
| Communications | 0 | 0.0% |
| Arts & Humanities | 0 | 0.0% |
| Total | 9 | 100.0% |
Transportation & Commute in Pine River
Vehicle Availability by Sex in Pine River
The most prevalent vehicle ownership categories in Pine River are males with 2 vehicles (11, accounting for 39.3%) and females with 2 vehicles (7, making up 29.7%).
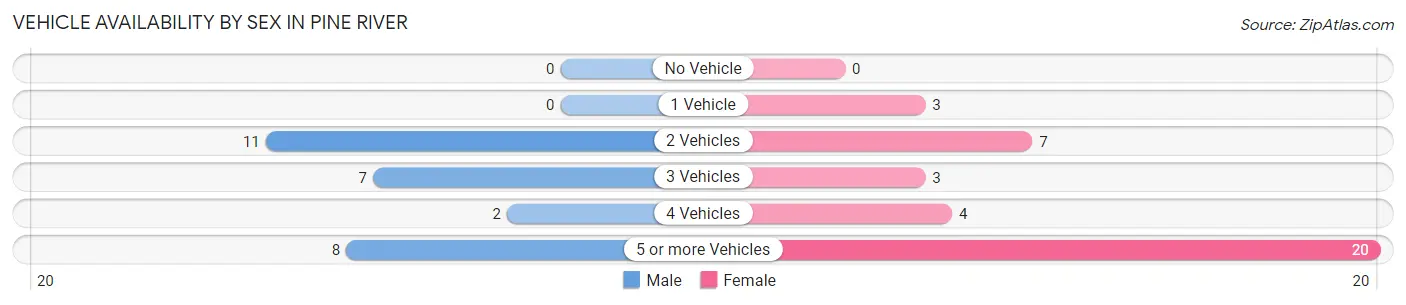
| Vehicles Available | Male | Female |
| No Vehicle | 0 (0.0%) | 0 (0.0%) |
| 1 Vehicle | 0 (0.0%) | 3 (8.1%) |
| 2 Vehicles | 11 (39.3%) | 7 (18.9%) |
| 3 Vehicles | 7 (25.0%) | 3 (8.1%) |
| 4 Vehicles | 2 (7.1%) | 4 (10.8%) |
| 5 or more Vehicles | 8 (28.6%) | 20 (54.0%) |
| Total | 28 (100.0%) | 37 (100.0%) |
Commute Time in Pine River
The most frequently occuring commute durations in Pine River are less than 5 minutes (28 commuters, 45.2%), 45 to 59 minutes (8 commuters, 12.9%), and 15 to 19 minutes (6 commuters, 9.7%).
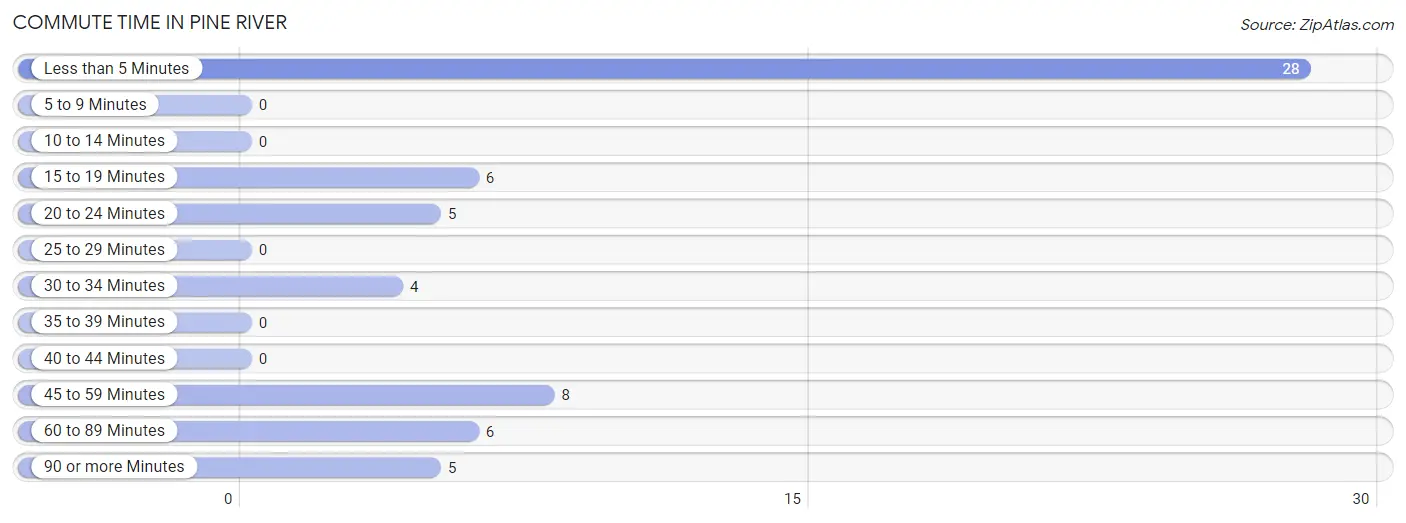
| Commute Time | # Commuters | % Commuters |
| Less than 5 Minutes | 28 | 45.2% |
| 5 to 9 Minutes | 0 | 0.0% |
| 10 to 14 Minutes | 0 | 0.0% |
| 15 to 19 Minutes | 6 | 9.7% |
| 20 to 24 Minutes | 5 | 8.1% |
| 25 to 29 Minutes | 0 | 0.0% |
| 30 to 34 Minutes | 4 | 6.5% |
| 35 to 39 Minutes | 0 | 0.0% |
| 40 to 44 Minutes | 0 | 0.0% |
| 45 to 59 Minutes | 8 | 12.9% |
| 60 to 89 Minutes | 6 | 9.7% |
| 90 or more Minutes | 5 | 8.1% |
Commute Time by Sex in Pine River
The most common commute times in Pine River are less than 5 minutes (8 commuters, 28.6%) for males and less than 5 minutes (20 commuters, 58.8%) for females.
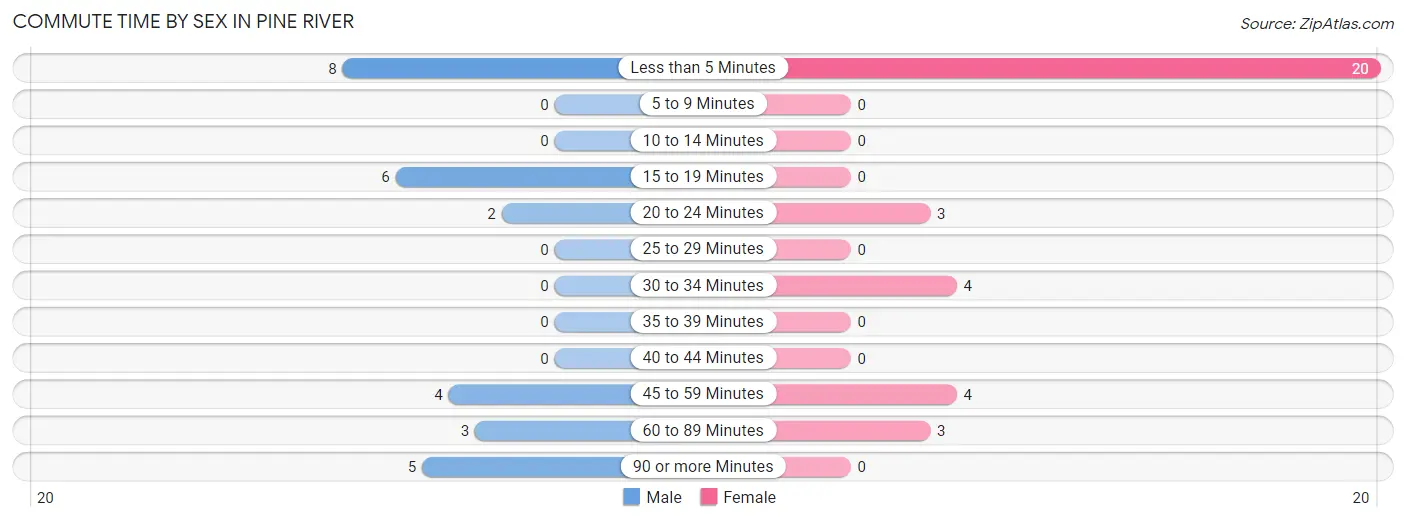
| Commute Time | Male | Female |
| Less than 5 Minutes | 8 (28.6%) | 20 (58.8%) |
| 5 to 9 Minutes | 0 (0.0%) | 0 (0.0%) |
| 10 to 14 Minutes | 0 (0.0%) | 0 (0.0%) |
| 15 to 19 Minutes | 6 (21.4%) | 0 (0.0%) |
| 20 to 24 Minutes | 2 (7.1%) | 3 (8.8%) |
| 25 to 29 Minutes | 0 (0.0%) | 0 (0.0%) |
| 30 to 34 Minutes | 0 (0.0%) | 4 (11.8%) |
| 35 to 39 Minutes | 0 (0.0%) | 0 (0.0%) |
| 40 to 44 Minutes | 0 (0.0%) | 0 (0.0%) |
| 45 to 59 Minutes | 4 (14.3%) | 4 (11.8%) |
| 60 to 89 Minutes | 3 (10.7%) | 3 (8.8%) |
| 90 or more Minutes | 5 (17.9%) | 0 (0.0%) |
Time of Departure to Work by Sex in Pine River
The most frequent times of departure to work in Pine River are 6:00 AM to 6:29 AM (17, 60.7%) for males and 7:30 AM to 7:59 AM (12, 35.3%) for females.
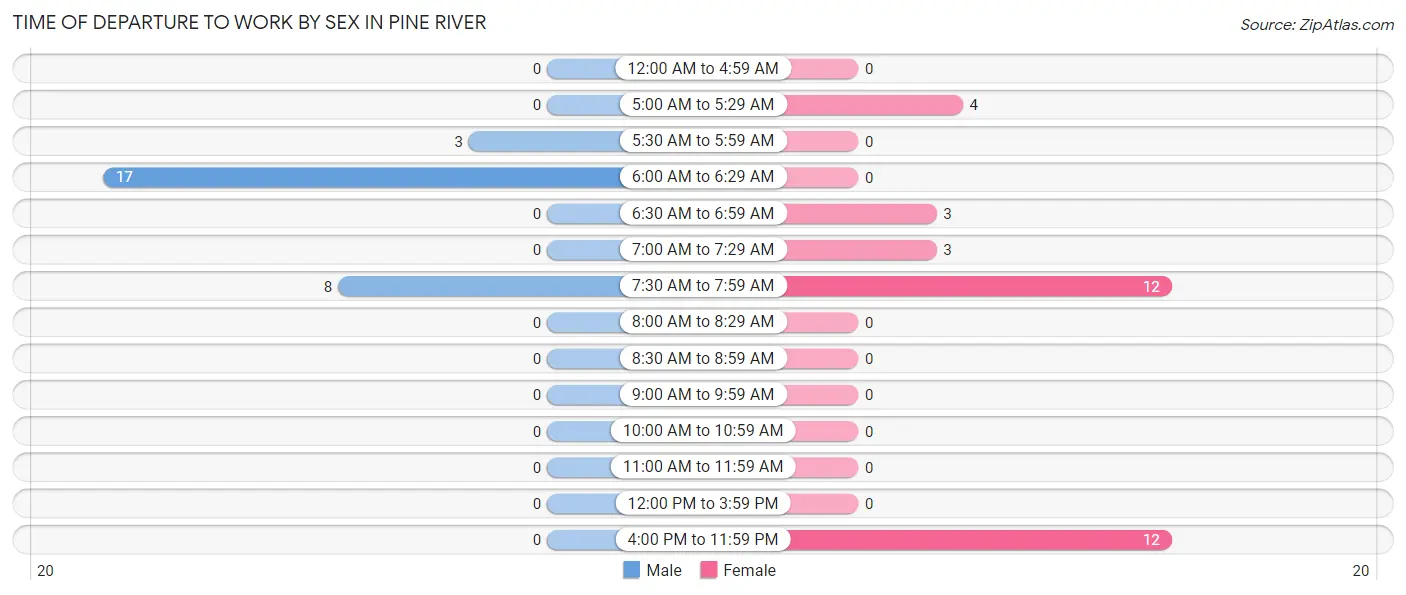
| Time of Departure | Male | Female |
| 12:00 AM to 4:59 AM | 0 (0.0%) | 0 (0.0%) |
| 5:00 AM to 5:29 AM | 0 (0.0%) | 4 (11.8%) |
| 5:30 AM to 5:59 AM | 3 (10.7%) | 0 (0.0%) |
| 6:00 AM to 6:29 AM | 17 (60.7%) | 0 (0.0%) |
| 6:30 AM to 6:59 AM | 0 (0.0%) | 3 (8.8%) |
| 7:00 AM to 7:29 AM | 0 (0.0%) | 3 (8.8%) |
| 7:30 AM to 7:59 AM | 8 (28.6%) | 12 (35.3%) |
| 8:00 AM to 8:29 AM | 0 (0.0%) | 0 (0.0%) |
| 8:30 AM to 8:59 AM | 0 (0.0%) | 0 (0.0%) |
| 9:00 AM to 9:59 AM | 0 (0.0%) | 0 (0.0%) |
| 10:00 AM to 10:59 AM | 0 (0.0%) | 0 (0.0%) |
| 11:00 AM to 11:59 AM | 0 (0.0%) | 0 (0.0%) |
| 12:00 PM to 3:59 PM | 0 (0.0%) | 0 (0.0%) |
| 4:00 PM to 11:59 PM | 0 (0.0%) | 12 (35.3%) |
| Total | 28 (100.0%) | 34 (100.0%) |
Housing Occupancy in Pine River
Occupancy by Ownership in Pine River
Of the total 61 dwellings in Pine River, owner-occupied units account for 61 (100.0%), while renter-occupied units make up 0 (0.0%).
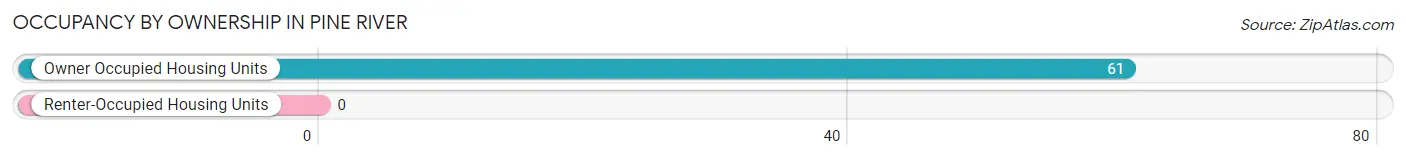
| Occupancy | # Housing Units | % Housing Units |
| Owner Occupied Housing Units | 61 | 100.0% |
| Renter-Occupied Housing Units | 0 | 0.0% |
| Total Occupied Housing Units | 61 | 100.0% |
Occupancy by Household Size in Pine River
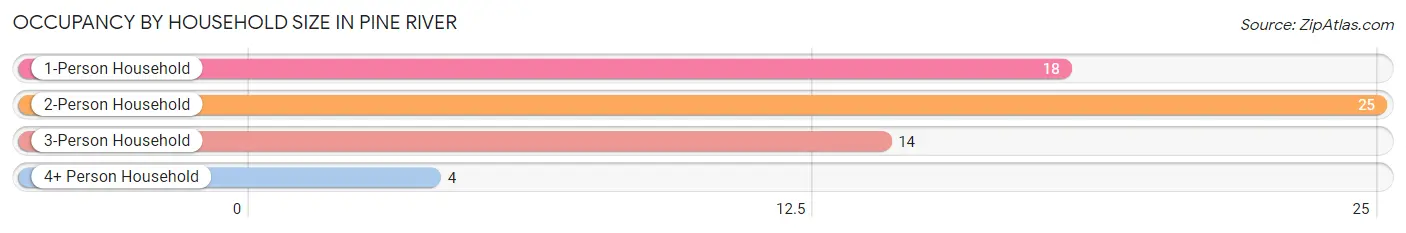
| Household Size | # Housing Units | % Housing Units |
| 1-Person Household | 18 | 29.5% |
| 2-Person Household | 25 | 41.0% |
| 3-Person Household | 14 | 23.0% |
| 4+ Person Household | 4 | 6.6% |
| Total Housing Units | 61 | 100.0% |
Occupancy by Ownership by Household Size in Pine River
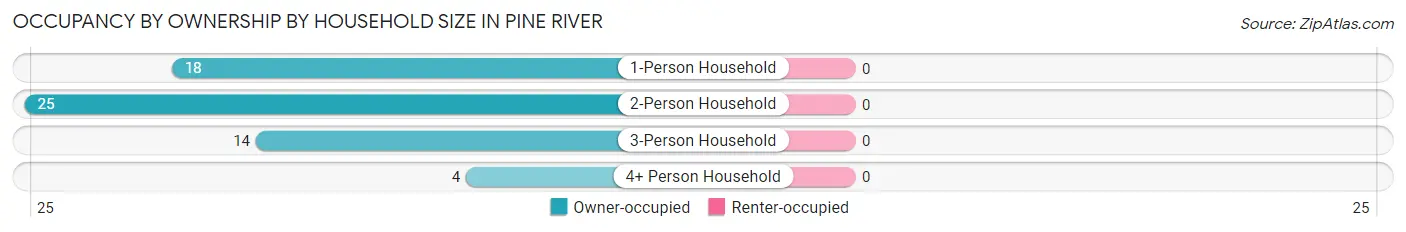
| Household Size | Owner-occupied | Renter-occupied |
| 1-Person Household | 18 (100.0%) | 0 (0.0%) |
| 2-Person Household | 25 (100.0%) | 0 (0.0%) |
| 3-Person Household | 14 (100.0%) | 0 (0.0%) |
| 4+ Person Household | 4 (100.0%) | 0 (0.0%) |
| Total Housing Units | 61 (100.0%) | 0 (0.0%) |
Occupancy by Educational Attainment in Pine River
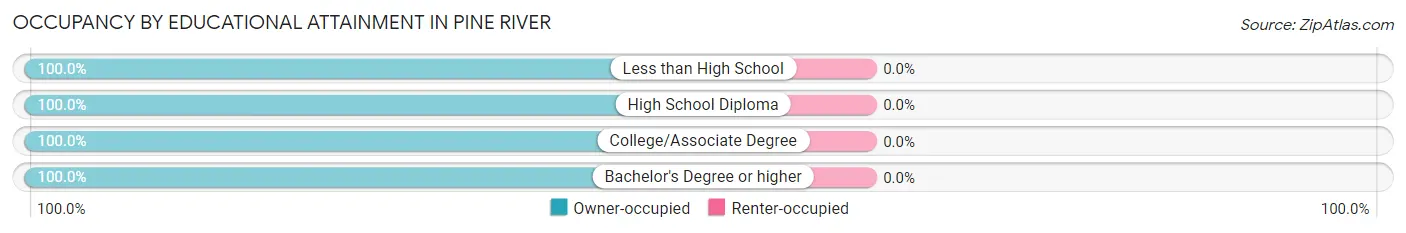
| Household Size | Owner-occupied | Renter-occupied |
| Less than High School | 3 (100.0%) | 0 (0.0%) |
| High School Diploma | 21 (100.0%) | 0 (0.0%) |
| College/Associate Degree | 35 (100.0%) | 0 (0.0%) |
| Bachelor's Degree or higher | 2 (100.0%) | 0 (0.0%) |
Occupancy by Age of Householder in Pine River
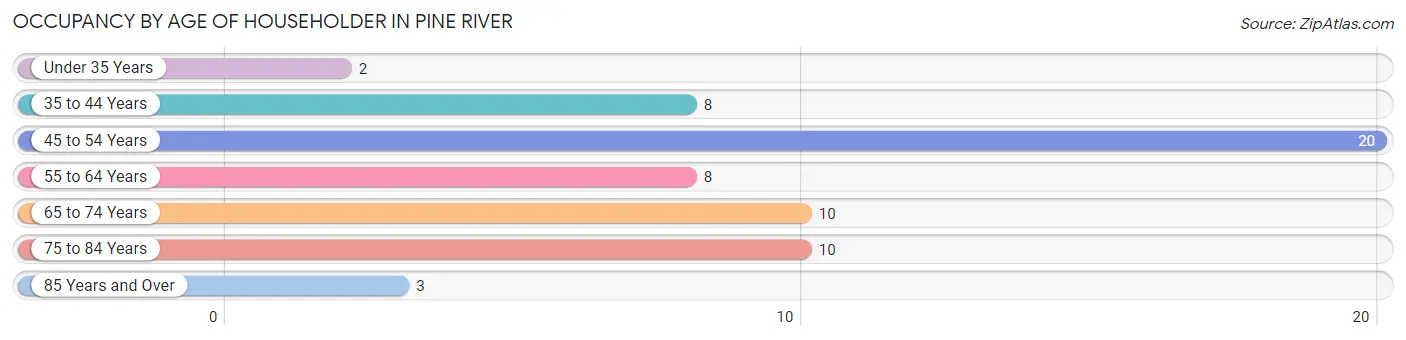
| Age Bracket | # Households | % Households |
| Under 35 Years | 2 | 3.3% |
| 35 to 44 Years | 8 | 13.1% |
| 45 to 54 Years | 20 | 32.8% |
| 55 to 64 Years | 8 | 13.1% |
| 65 to 74 Years | 10 | 16.4% |
| 75 to 84 Years | 10 | 16.4% |
| 85 Years and Over | 3 | 4.9% |
| Total | 61 | 100.0% |
Housing Finances in Pine River
Median Income by Occupancy in Pine River
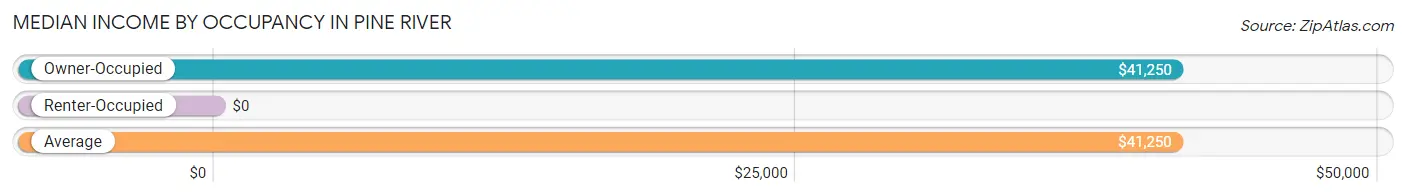
| Occupancy Type | # Households | Median Income |
| Owner-Occupied | 61 (100.0%) | $41,250 |
| Renter-Occupied | 0 (0.0%) | $0 |
| Average | 61 (100.0%) | $41,250 |
Occupancy by Householder Income Bracket in Pine River
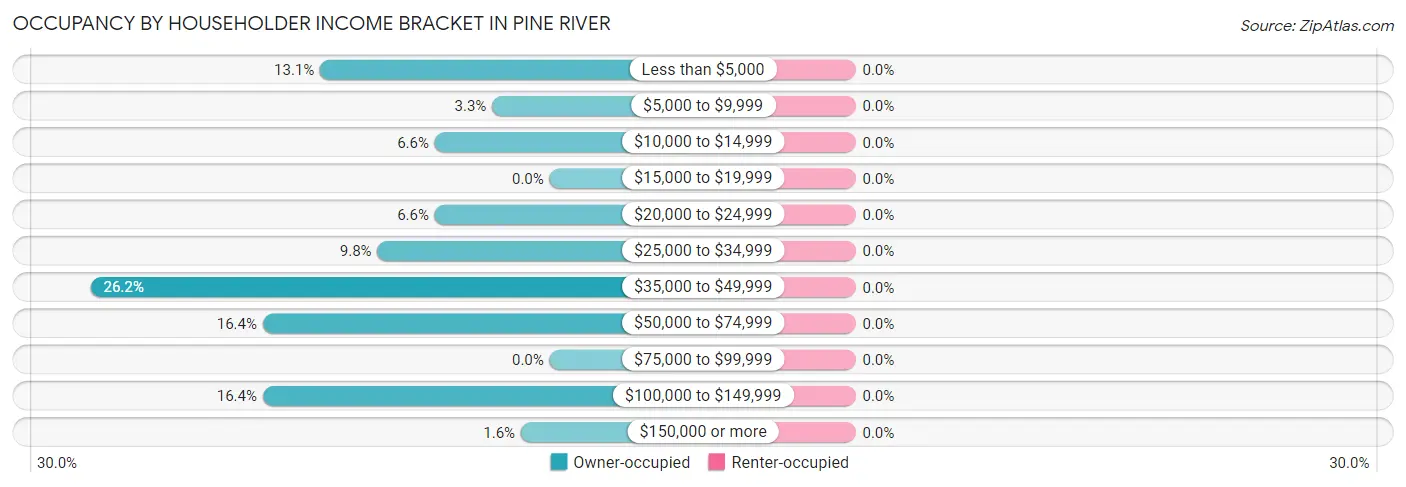
| Income Bracket | Owner-occupied | Renter-occupied |
| Less than $5,000 | 8 (13.1%) | 0 (0.0%) |
| $5,000 to $9,999 | 2 (3.3%) | 0 (0.0%) |
| $10,000 to $14,999 | 4 (6.6%) | 0 (0.0%) |
| $15,000 to $19,999 | 0 (0.0%) | 0 (0.0%) |
| $20,000 to $24,999 | 4 (6.6%) | 0 (0.0%) |
| $25,000 to $34,999 | 6 (9.8%) | 0 (0.0%) |
| $35,000 to $49,999 | 16 (26.2%) | 0 (0.0%) |
| $50,000 to $74,999 | 10 (16.4%) | 0 (0.0%) |
| $75,000 to $99,999 | 0 (0.0%) | 0 (0.0%) |
| $100,000 to $149,999 | 10 (16.4%) | 0 (0.0%) |
| $150,000 or more | 1 (1.6%) | 0 (0.0%) |
| Total | 61 (100.0%) | 0 (0.0%) |
Monthly Housing Cost Tiers in Pine River
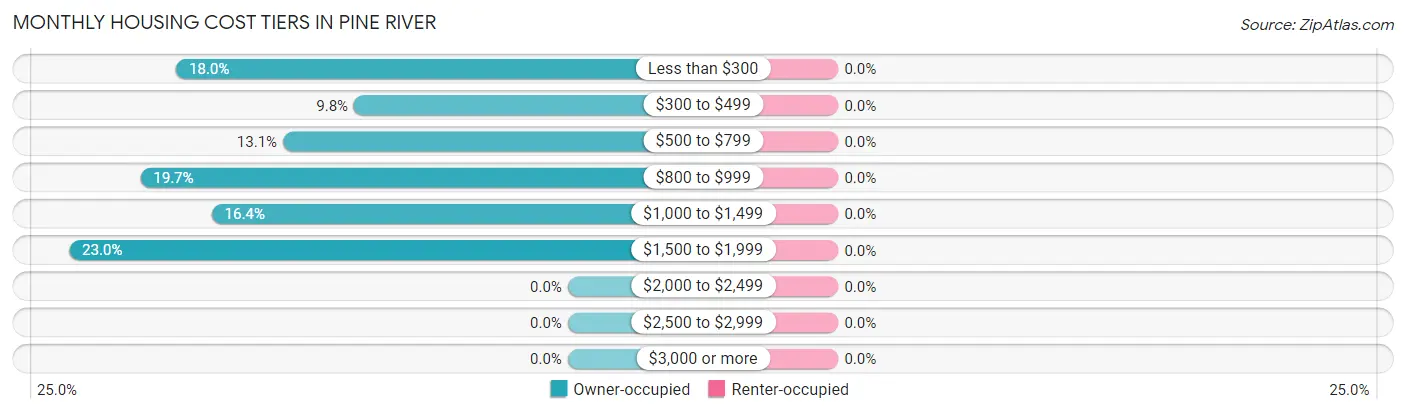
| Monthly Cost | Owner-occupied | Renter-occupied |
| Less than $300 | 11 (18.0%) | 0 (0.0%) |
| $300 to $499 | 6 (9.8%) | 0 (0.0%) |
| $500 to $799 | 8 (13.1%) | 0 (0.0%) |
| $800 to $999 | 12 (19.7%) | 0 (0.0%) |
| $1,000 to $1,499 | 10 (16.4%) | 0 (0.0%) |
| $1,500 to $1,999 | 14 (23.0%) | 0 (0.0%) |
| $2,000 to $2,499 | 0 (0.0%) | 0 (0.0%) |
| $2,500 to $2,999 | 0 (0.0%) | 0 (0.0%) |
| $3,000 or more | 0 (0.0%) | 0 (0.0%) |
| Total | 61 (100.0%) | 0 (0.0%) |
Physical Housing Characteristics in Pine River
Housing Structures in Pine River
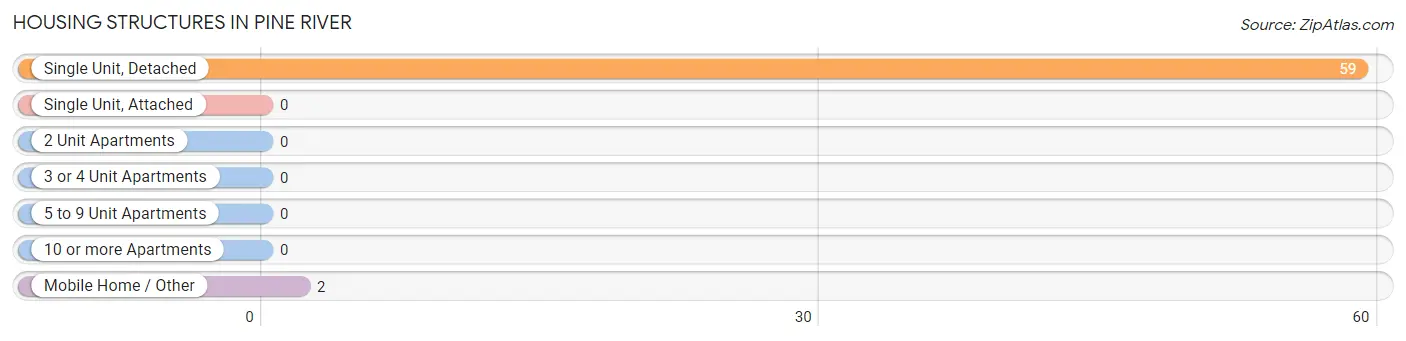
| Structure Type | # Housing Units | % Housing Units |
| Single Unit, Detached | 59 | 96.7% |
| Single Unit, Attached | 0 | 0.0% |
| 2 Unit Apartments | 0 | 0.0% |
| 3 or 4 Unit Apartments | 0 | 0.0% |
| 5 to 9 Unit Apartments | 0 | 0.0% |
| 10 or more Apartments | 0 | 0.0% |
| Mobile Home / Other | 2 | 3.3% |
| Total | 61 | 100.0% |
Housing Structures by Occupancy in Pine River
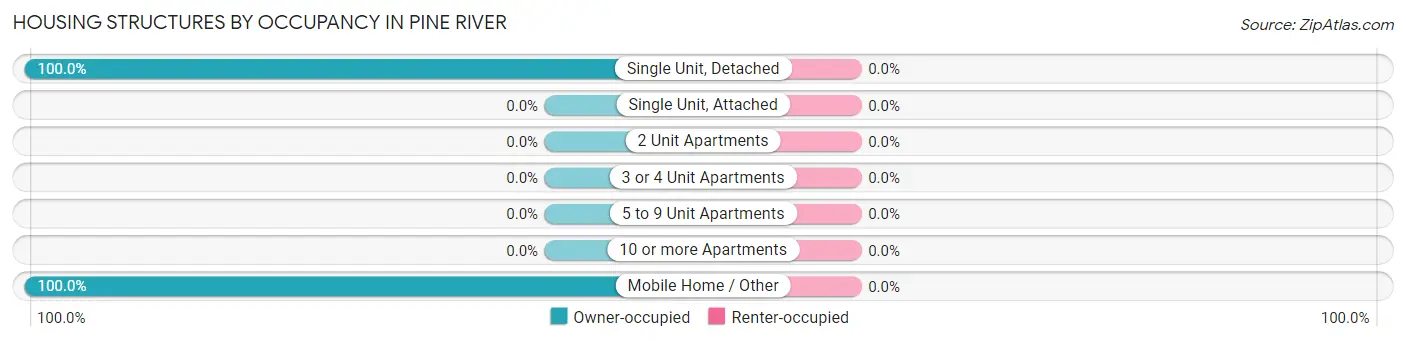
| Structure Type | Owner-occupied | Renter-occupied |
| Single Unit, Detached | 59 (100.0%) | 0 (0.0%) |
| Single Unit, Attached | 0 (0.0%) | 0 (0.0%) |
| 2 Unit Apartments | 0 (0.0%) | 0 (0.0%) |
| 3 or 4 Unit Apartments | 0 (0.0%) | 0 (0.0%) |
| 5 to 9 Unit Apartments | 0 (0.0%) | 0 (0.0%) |
| 10 or more Apartments | 0 (0.0%) | 0 (0.0%) |
| Mobile Home / Other | 2 (100.0%) | 0 (0.0%) |
| Total | 61 (100.0%) | 0 (0.0%) |
Housing Structures by Number of Rooms in Pine River
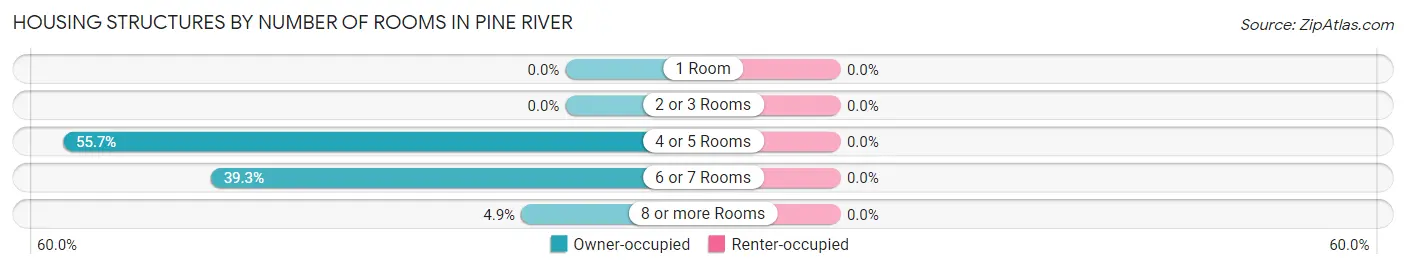
| Number of Rooms | Owner-occupied | Renter-occupied |
| 1 Room | 0 (0.0%) | 0 (0.0%) |
| 2 or 3 Rooms | 0 (0.0%) | 0 (0.0%) |
| 4 or 5 Rooms | 34 (55.7%) | 0 (0.0%) |
| 6 or 7 Rooms | 24 (39.3%) | 0 (0.0%) |
| 8 or more Rooms | 3 (4.9%) | 0 (0.0%) |
| Total | 61 (100.0%) | 0 (0.0%) |
Housing Structure by Heating Type in Pine River
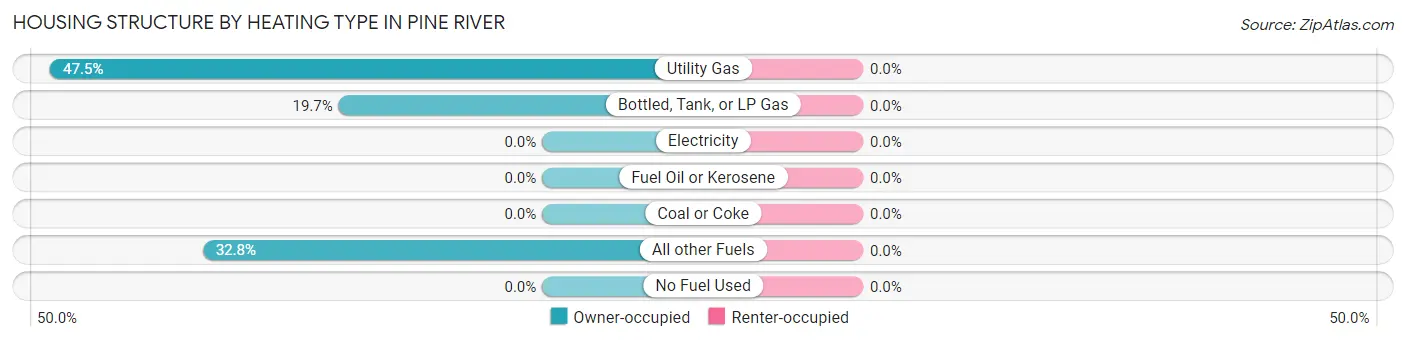
| Heating Type | Owner-occupied | Renter-occupied |
| Utility Gas | 29 (47.5%) | 0 (0.0%) |
| Bottled, Tank, or LP Gas | 12 (19.7%) | 0 (0.0%) |
| Electricity | 0 (0.0%) | 0 (0.0%) |
| Fuel Oil or Kerosene | 0 (0.0%) | 0 (0.0%) |
| Coal or Coke | 0 (0.0%) | 0 (0.0%) |
| All other Fuels | 20 (32.8%) | 0 (0.0%) |
| No Fuel Used | 0 (0.0%) | 0 (0.0%) |
| Total | 61 (100.0%) | 0 (0.0%) |
Household Vehicle Usage in Pine River
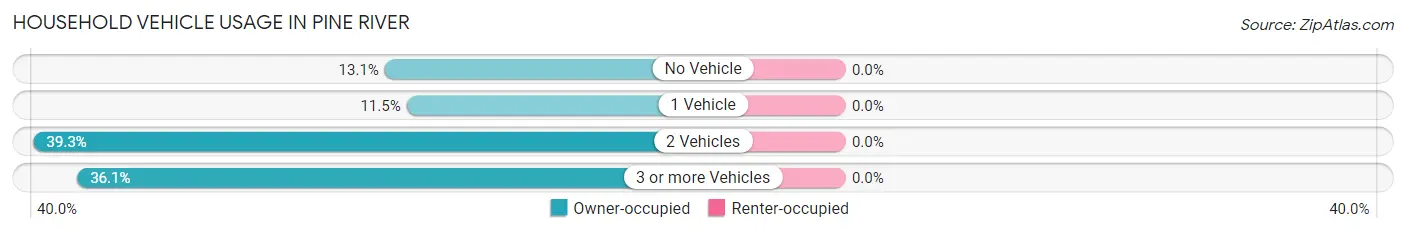
| Vehicles per Household | Owner-occupied | Renter-occupied |
| No Vehicle | 8 (13.1%) | 0 (0.0%) |
| 1 Vehicle | 7 (11.5%) | 0 (0.0%) |
| 2 Vehicles | 24 (39.3%) | 0 (0.0%) |
| 3 or more Vehicles | 22 (36.1%) | 0 (0.0%) |
| Total | 61 (100.0%) | 0 (0.0%) |
Real Estate & Mortgages in Pine River
Real Estate and Mortgage Overview in Pine River
| Characteristic | Without Mortgage | With Mortgage |
| Housing Units | 20 | 41 |
| Median Property Value | - | - |
| Median Household Income | - | - |
| Monthly Housing Costs | $283 | $0 |
| Real Estate Taxes | $1,318 | $0 |
Property Value by Mortgage Status in Pine River
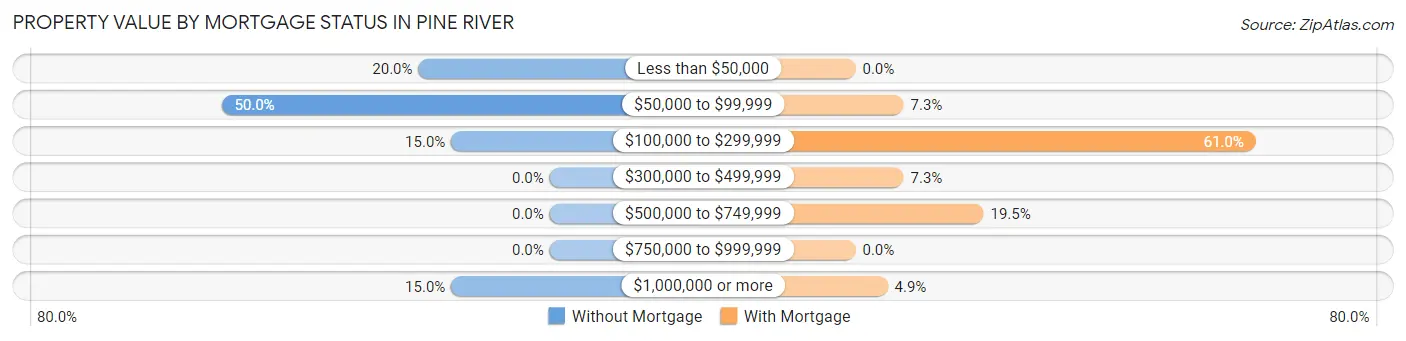
| Property Value | Without Mortgage | With Mortgage |
| Less than $50,000 | 4 (20.0%) | 0 (0.0%) |
| $50,000 to $99,999 | 10 (50.0%) | 3 (7.3%) |
| $100,000 to $299,999 | 3 (15.0%) | 25 (61.0%) |
| $300,000 to $499,999 | 0 (0.0%) | 3 (7.3%) |
| $500,000 to $749,999 | 0 (0.0%) | 8 (19.5%) |
| $750,000 to $999,999 | 0 (0.0%) | 0 (0.0%) |
| $1,000,000 or more | 3 (15.0%) | 2 (4.9%) |
| Total | 20 (100.0%) | 41 (100.0%) |
Household Income by Mortgage Status in Pine River
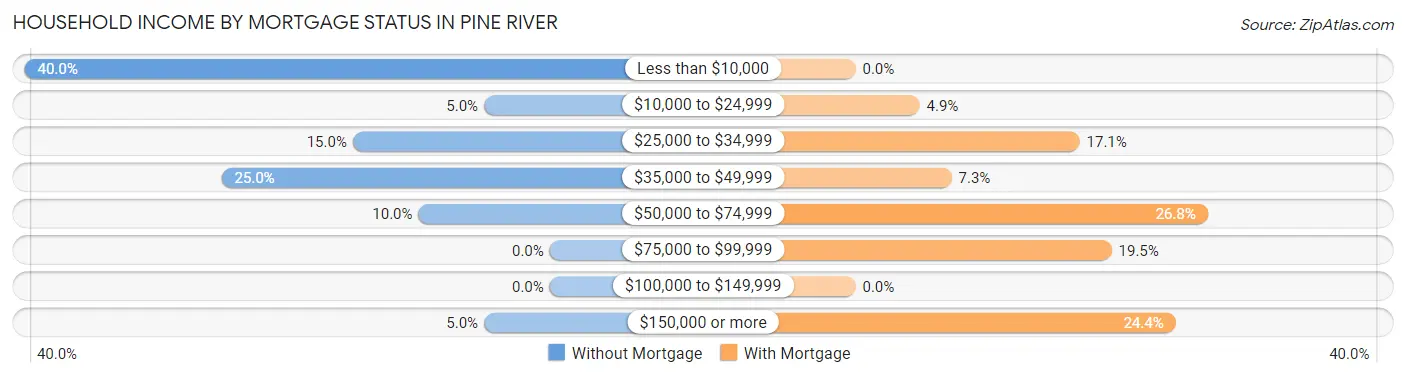
| Household Income | Without Mortgage | With Mortgage |
| Less than $10,000 | 8 (40.0%) | 0 (0.0%) |
| $10,000 to $24,999 | 1 (5.0%) | 2 (4.9%) |
| $25,000 to $34,999 | 3 (15.0%) | 7 (17.1%) |
| $35,000 to $49,999 | 5 (25.0%) | 3 (7.3%) |
| $50,000 to $74,999 | 2 (10.0%) | 11 (26.8%) |
| $75,000 to $99,999 | 0 (0.0%) | 8 (19.5%) |
| $100,000 to $149,999 | 0 (0.0%) | 0 (0.0%) |
| $150,000 or more | 1 (5.0%) | 10 (24.4%) |
| Total | 20 (100.0%) | 41 (100.0%) |
Property Value to Household Income Ratio in Pine River
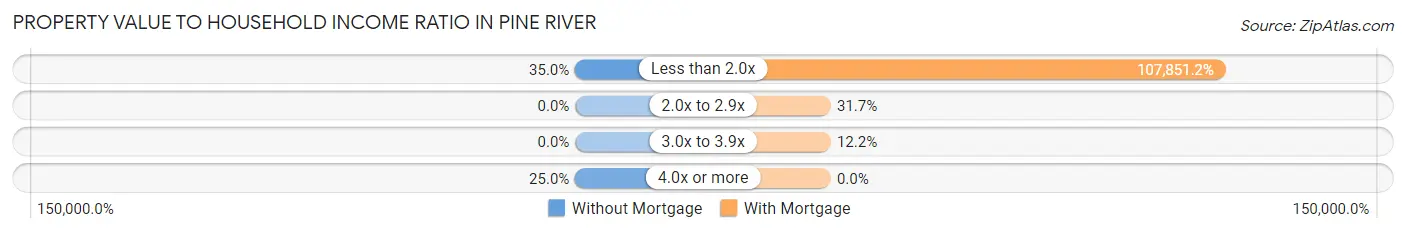
| Value-to-Income Ratio | Without Mortgage | With Mortgage |
| Less than 2.0x | 7 (35.0%) | 44,219 (107,851.2%) |
| 2.0x to 2.9x | 0 (0.0%) | 13 (31.7%) |
| 3.0x to 3.9x | 0 (0.0%) | 5 (12.2%) |
| 4.0x or more | 5 (25.0%) | 0 (0.0%) |
| Total | 20 (100.0%) | 41 (100.0%) |
Real Estate Taxes by Mortgage Status in Pine River

| Property Taxes | Without Mortgage | With Mortgage |
| Less than $800 | 2 (10.0%) | 0 (0.0%) |
| $800 to $1,499 | 12 (60.0%) | 0 (0.0%) |
| $800 to $1,499 | 6 (30.0%) | 7 (17.1%) |
| Total | 20 (100.0%) | 41 (100.0%) |
Health & Disability in Pine River
Health Insurance Coverage by Age in Pine River
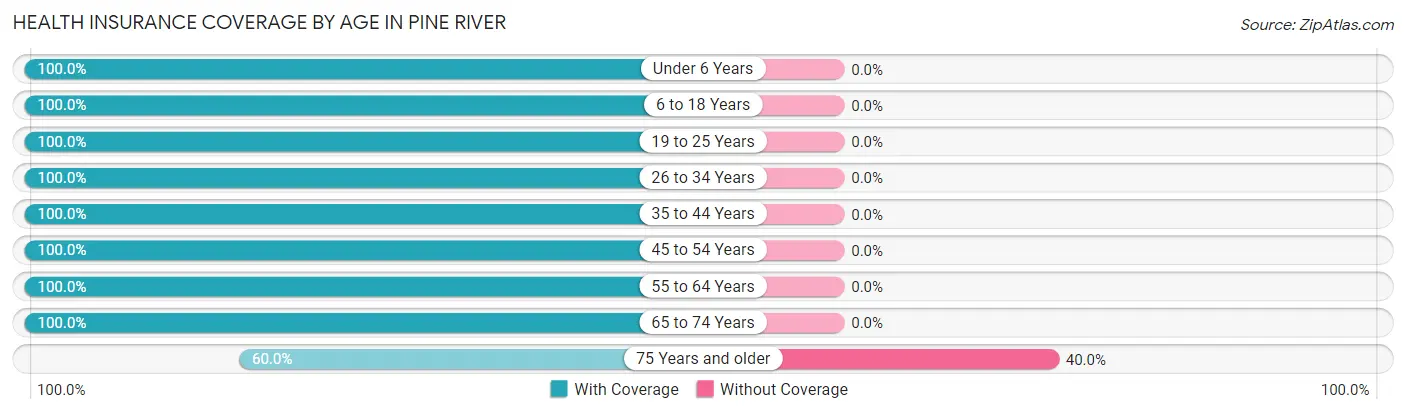
| Age Bracket | With Coverage | Without Coverage |
| Under 6 Years | 8 (100.0%) | 0 (0.0%) |
| 6 to 18 Years | 11 (100.0%) | 0 (0.0%) |
| 19 to 25 Years | 15 (100.0%) | 0 (0.0%) |
| 26 to 34 Years | 8 (100.0%) | 0 (0.0%) |
| 35 to 44 Years | 8 (100.0%) | 0 (0.0%) |
| 45 to 54 Years | 32 (100.0%) | 0 (0.0%) |
| 55 to 64 Years | 11 (100.0%) | 0 (0.0%) |
| 65 to 74 Years | 17 (100.0%) | 0 (0.0%) |
| 75 Years and older | 12 (60.0%) | 8 (40.0%) |
| Total | 122 (93.9%) | 8 (6.1%) |
Health Insurance Coverage by Citizenship Status in Pine River

| Citizenship Status | With Coverage | Without Coverage |
| Native Born | 8 (100.0%) | 0 (0.0%) |
| Foreign Born, Citizen | 11 (100.0%) | 0 (0.0%) |
| Foreign Born, not a Citizen | 15 (100.0%) | 0 (0.0%) |
Health Insurance Coverage by Household Income in Pine River
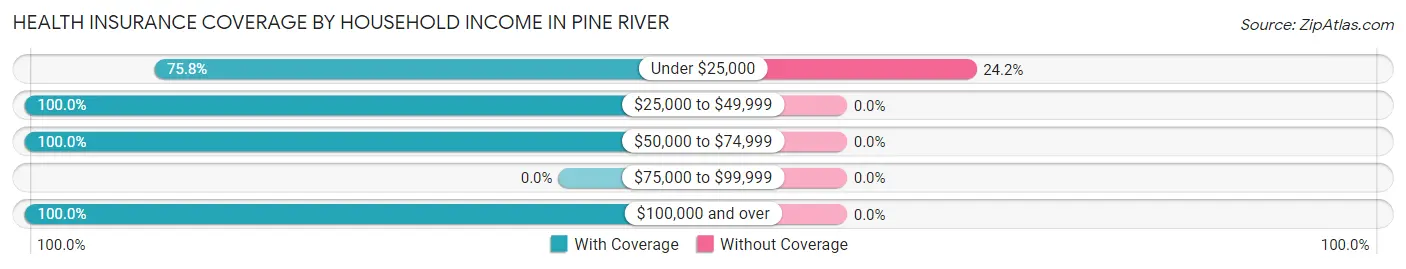
| Household Income | With Coverage | Without Coverage |
| Under $25,000 | 25 (75.8%) | 8 (24.2%) |
| $25,000 to $49,999 | 50 (100.0%) | 0 (0.0%) |
| $50,000 to $74,999 | 17 (100.0%) | 0 (0.0%) |
| $75,000 to $99,999 | 0 (0.0%) | 0 (0.0%) |
| $100,000 and over | 30 (100.0%) | 0 (0.0%) |
Public vs Private Health Insurance Coverage by Age in Pine River
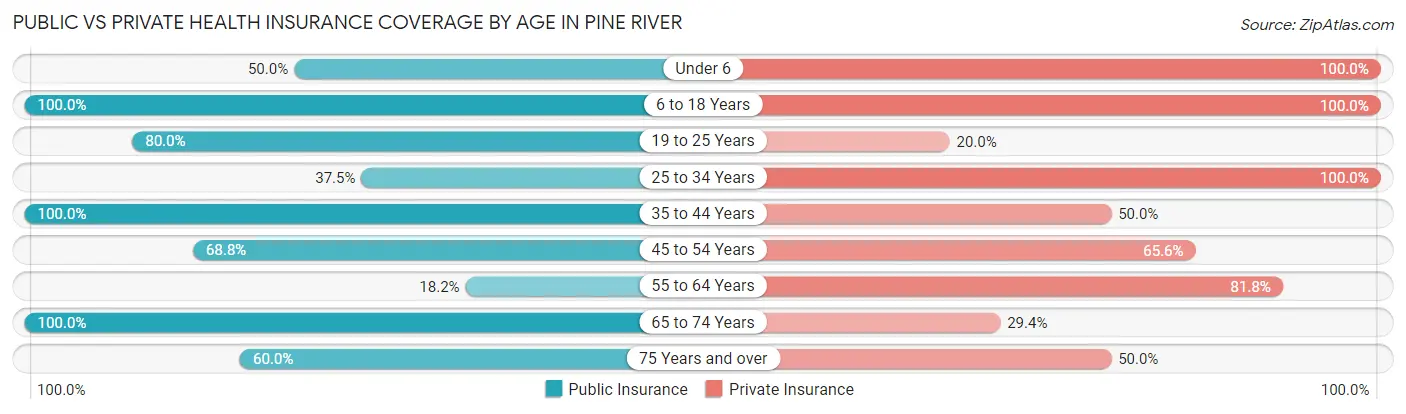
| Age Bracket | Public Insurance | Private Insurance |
| Under 6 | 4 (50.0%) | 8 (100.0%) |
| 6 to 18 Years | 11 (100.0%) | 11 (100.0%) |
| 19 to 25 Years | 12 (80.0%) | 3 (20.0%) |
| 25 to 34 Years | 3 (37.5%) | 8 (100.0%) |
| 35 to 44 Years | 8 (100.0%) | 4 (50.0%) |
| 45 to 54 Years | 22 (68.8%) | 21 (65.6%) |
| 55 to 64 Years | 2 (18.2%) | 9 (81.8%) |
| 65 to 74 Years | 17 (100.0%) | 5 (29.4%) |
| 75 Years and over | 12 (60.0%) | 10 (50.0%) |
| Total | 91 (70.0%) | 79 (60.8%) |
Disability Status by Sex by Age in Pine River
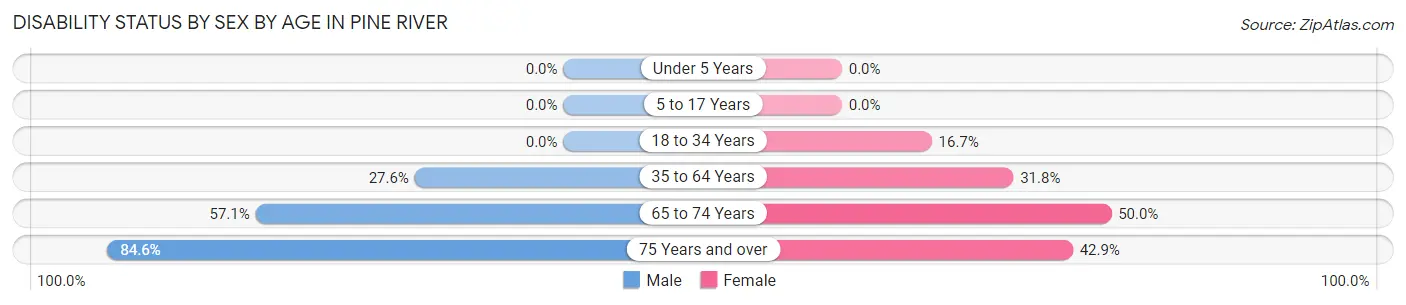
| Age Bracket | Male | Female |
| Under 5 Years | 0 (0.0%) | 0 (0.0%) |
| 5 to 17 Years | 0 (0.0%) | 0 (0.0%) |
| 18 to 34 Years | 0 (0.0%) | 3 (16.7%) |
| 35 to 64 Years | 8 (27.6%) | 7 (31.8%) |
| 65 to 74 Years | 4 (57.1%) | 5 (50.0%) |
| 75 Years and over | 11 (84.6%) | 3 (42.9%) |
Disability Class by Sex by Age in Pine River
Disability Class: Hearing Difficulty
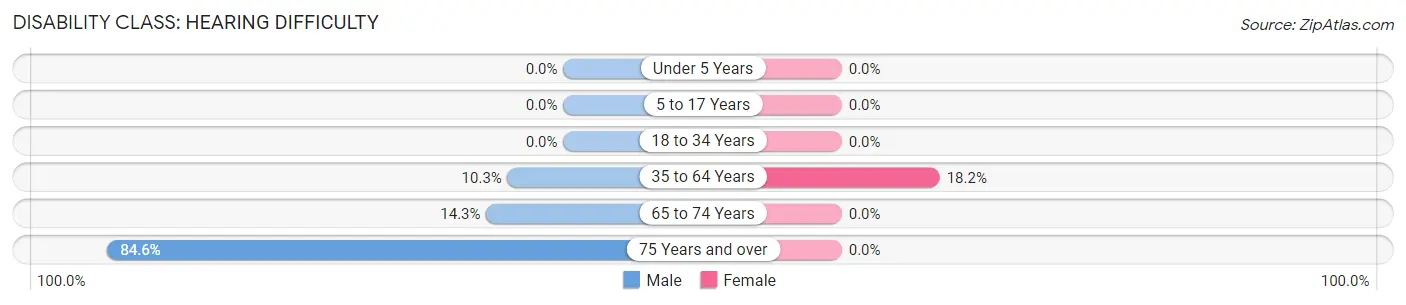
| Age Bracket | Male | Female |
| Under 5 Years | 0 (0.0%) | 0 (0.0%) |
| 5 to 17 Years | 0 (0.0%) | 0 (0.0%) |
| 18 to 34 Years | 0 (0.0%) | 0 (0.0%) |
| 35 to 64 Years | 3 (10.3%) | 4 (18.2%) |
| 65 to 74 Years | 1 (14.3%) | 0 (0.0%) |
| 75 Years and over | 11 (84.6%) | 0 (0.0%) |
Disability Class: Vision Difficulty
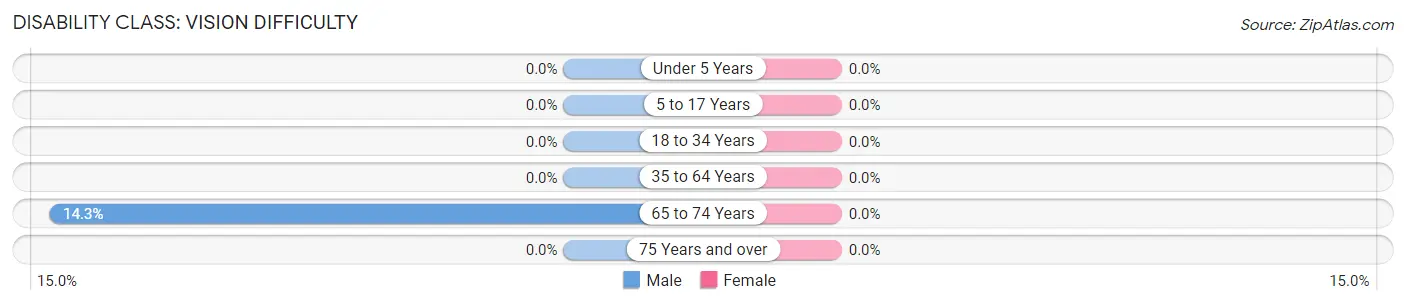
| Age Bracket | Male | Female |
| Under 5 Years | 0 (0.0%) | 0 (0.0%) |
| 5 to 17 Years | 0 (0.0%) | 0 (0.0%) |
| 18 to 34 Years | 0 (0.0%) | 0 (0.0%) |
| 35 to 64 Years | 0 (0.0%) | 0 (0.0%) |
| 65 to 74 Years | 1 (14.3%) | 0 (0.0%) |
| 75 Years and over | 0 (0.0%) | 0 (0.0%) |
Disability Class: Cognitive Difficulty
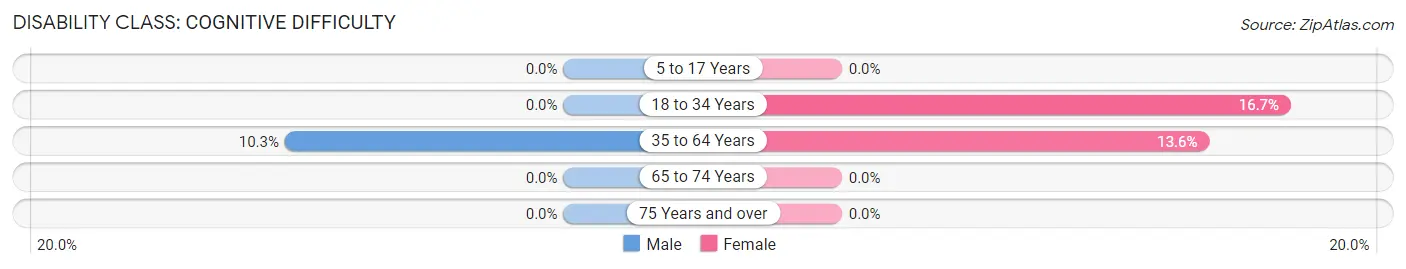
| Age Bracket | Male | Female |
| 5 to 17 Years | 0 (0.0%) | 0 (0.0%) |
| 18 to 34 Years | 0 (0.0%) | 3 (16.7%) |
| 35 to 64 Years | 3 (10.3%) | 3 (13.6%) |
| 65 to 74 Years | 0 (0.0%) | 0 (0.0%) |
| 75 Years and over | 0 (0.0%) | 0 (0.0%) |
Disability Class: Ambulatory Difficulty
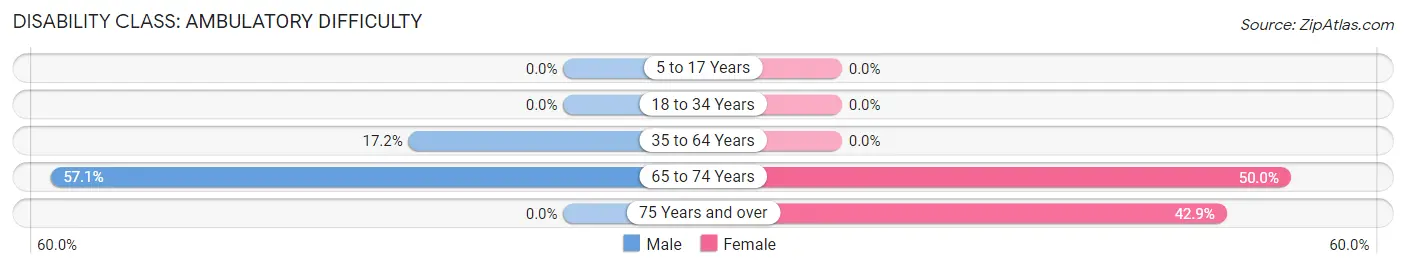
| Age Bracket | Male | Female |
| 5 to 17 Years | 0 (0.0%) | 0 (0.0%) |
| 18 to 34 Years | 0 (0.0%) | 0 (0.0%) |
| 35 to 64 Years | 5 (17.2%) | 0 (0.0%) |
| 65 to 74 Years | 4 (57.1%) | 5 (50.0%) |
| 75 Years and over | 0 (0.0%) | 3 (42.9%) |
Disability Class: Self-Care Difficulty
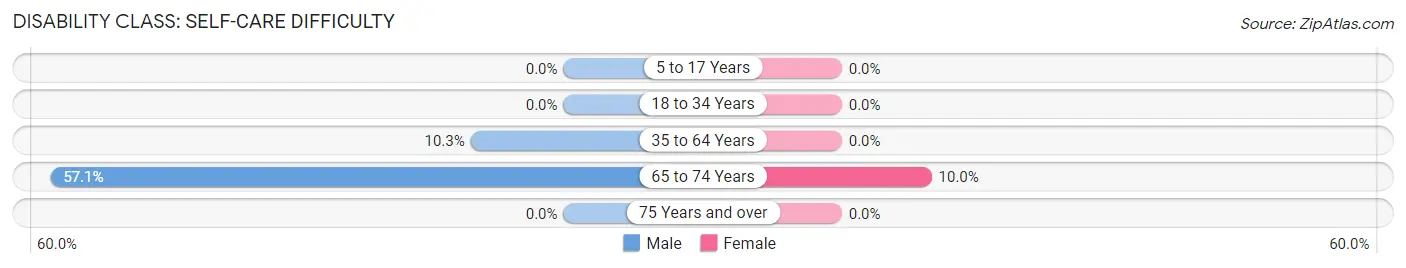
| Age Bracket | Male | Female |
| 5 to 17 Years | 0 (0.0%) | 0 (0.0%) |
| 18 to 34 Years | 0 (0.0%) | 0 (0.0%) |
| 35 to 64 Years | 3 (10.3%) | 0 (0.0%) |
| 65 to 74 Years | 4 (57.1%) | 1 (10.0%) |
| 75 Years and over | 0 (0.0%) | 0 (0.0%) |
Technology Access in Pine River
Computing Device Access in Pine River
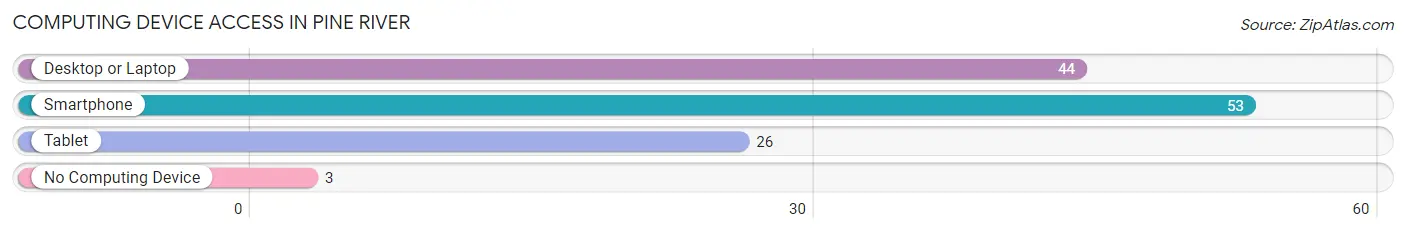
| Device Type | # Households | % Households |
| Desktop or Laptop | 44 | 72.1% |
| Smartphone | 53 | 86.9% |
| Tablet | 26 | 42.6% |
| No Computing Device | 3 | 4.9% |
| Total | 61 | 100.0% |
Internet Access in Pine River
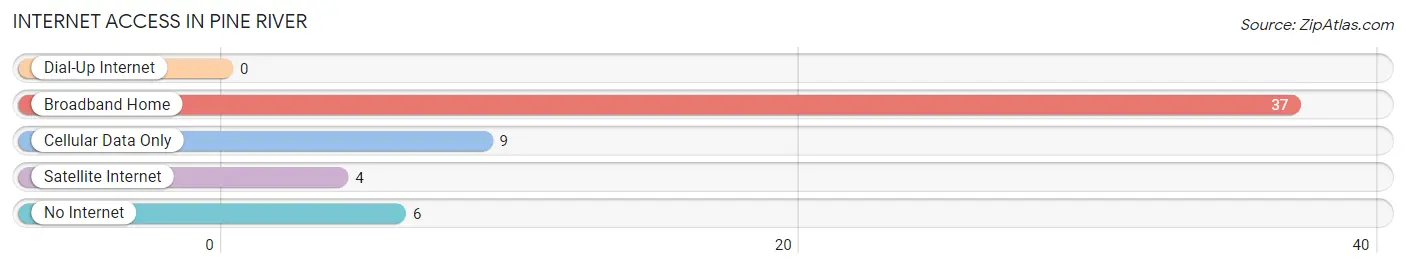
| Internet Type | # Households | % Households |
| Dial-Up Internet | 0 | 0.0% |
| Broadband Home | 37 | 60.7% |
| Cellular Data Only | 9 | 14.7% |
| Satellite Internet | 4 | 6.6% |
| No Internet | 6 | 9.8% |
| Total | 61 | 100.0% |
Pine River Summary
Pine River is a small village located in Langlade County, Wisconsin. It is situated on the banks of the Pine River, a tributary of the Wolf River. The village is located approximately 30 miles northeast of Wausau and is part of the Wausau, WI Metropolitan Statistical Area. The population of Pine River was estimated to be 545 in 2019.
History
The area that is now Pine River was first settled in the late 1800s by German and Polish immigrants. The village was officially incorporated in 1891. The village was named after the Pine River, which was named by early settlers for the abundance of pine trees in the area.
In the early 1900s, the village was a thriving logging and farming community. The village was home to several sawmills, a cheese factory, and a general store. The village also had a post office, a blacksmith shop, and a hotel.
In the 1950s, the village began to decline as the logging industry moved away from the area. The village was also affected by the construction of the Wolf River Dam, which flooded much of the surrounding area.
Geography
Pine River is located in the north-central part of Wisconsin, approximately 30 miles northeast of Wausau. The village is situated on the banks of the Pine River, a tributary of the Wolf River. The village is surrounded by rolling hills and forests.
The climate in Pine River is classified as humid continental, with cold winters and warm summers. The average annual temperature is around 40°F (4°C). The average annual precipitation is around 33 inches (84 cm).
Economy
The economy of Pine River is largely based on tourism and agriculture. The village is home to several small businesses, including a general store, a restaurant, and a bed and breakfast. The village also has a small airport, which is used for recreational flying.
The village is also home to several farms, which produce a variety of crops, including corn, soybeans, and hay. The village is also home to several hunting and fishing lodges, which attract visitors from around the region.
Demographics
The population of Pine River was estimated to be 545 in 2019. The population is predominantly white (97.3%), with a small percentage of African Americans (1.3%) and Native Americans (0.7%). The median household income is $45,000, and the median age is 44.
The village is served by the Pine River-Backus School District, which includes a K-12 school. The village is also home to a public library and a community center.
Conclusion
Pine River is a small village located in Langlade County, Wisconsin. It is situated on the banks of the Pine River, a tributary of the Wolf River. The village is home to a variety of businesses and is a popular destination for tourists and outdoor enthusiasts. The population of Pine River was estimated to be 545 in 2019, and the median household income is $45,000. The village is served by the Pine River-Backus School District and is home to a public library and a community center.
Common Questions
What is Per Capita Income in Pine River?
Per Capita income in Pine River is $26,021.
What is the Median Family Income in Pine River?
Median Family Income in Pine River is $44,219.
What is the Median Household income in Pine River?
Median Household Income in Pine River is $41,250.
What is Inequality or Gini Index in Pine River?
Inequality or Gini Index in Pine River is 0.49.
What is the Total Population of Pine River?
Total Population of Pine River is 130.
What is the Total Male Population of Pine River?
Total Male Population of Pine River is 57.
What is the Total Female Population of Pine River?
Total Female Population of Pine River is 73.
What is the Ratio of Males per 100 Females in Pine River?
There are 78.08 Males per 100 Females in Pine River.
What is the Ratio of Females per 100 Males in Pine River?
There are 128.07 Females per 100 Males in Pine River.
What is the Median Population Age in Pine River?
Median Population Age in Pine River is 50.6 Years.
What is the Average Family Size in Pine River
Average Family Size in Pine River is 2.6 People.
What is the Average Household Size in Pine River
Average Household Size in Pine River is 2.1 People.
How Large is the Labor Force in Pine River?
There are 69 People in the Labor Forcein in Pine River.
What is the Percentage of People in the Labor Force in Pine River?
60.5% of People are in the Labor Force in Pine River.