Delavan, WI Map & Demographics
Delavan Map
Delavan Overview
$31,716
PER CAPITA INCOME
$80,036
AVG FAMILY INCOME
$69,238
AVG HOUSEHOLD INCOME
39.1%
WAGE / INCOME GAP [ % ]
60.9¢/ $1
WAGE / INCOME GAP [ $ ]
0.40
INEQUALITY / GINI INDEX
8,519
TOTAL POPULATION
4,379
MALE POPULATION
4,140
FEMALE POPULATION
105.77
MALES / 100 FEMALES
94.54
FEMALES / 100 MALES
37.0
MEDIAN AGE
2.9
AVG FAMILY SIZE
2.4
AVG HOUSEHOLD SIZE
4,651
LABOR FORCE [ PEOPLE ]
68.9%
PERCENT IN LABOR FORCE
4.3%
UNEMPLOYMENT RATE
Delavan Zip Codes
Income in Delavan
Income Overview in Delavan
Per Capita Income in Delavan is $31,716, while median incomes of families and households are $80,036 and $69,238 respectively.
| Characteristic | Number | Measure |
| Per Capita Income | 8,519 | $31,716 |
| Median Family Income | 2,279 | $80,036 |
| Mean Family Income | 2,279 | $91,062 |
| Median Household Income | 3,539 | $69,238 |
| Mean Household Income | 3,539 | $76,218 |
| Income Deficit | 2,279 | $0 |
| Wage / Income Gap (%) | 8,519 | 39.10% |
| Wage / Income Gap ($) | 8,519 | 60.90¢ per $1 |
| Gini / Inequality Index | 8,519 | 0.40 |
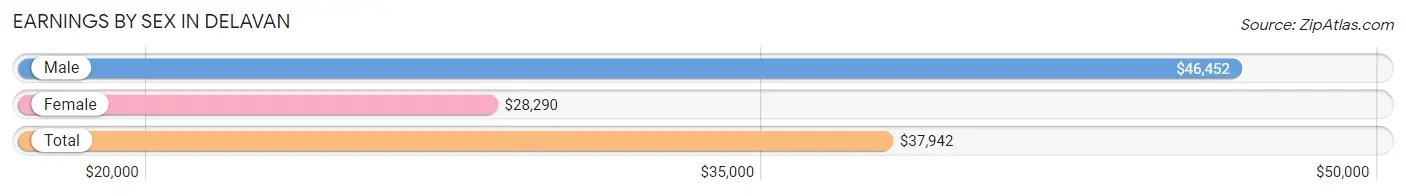
Earnings by Sex in Delavan
Average Earnings in Delavan are $37,942, $46,452 for men and $28,290 for women, a difference of 39.1%.
| Sex | Number | Average Earnings |
| Male | 2,622 (53.5%) | $46,452 |
| Female | 2,283 (46.5%) | $28,290 |
| Total | 4,905 (100.0%) | $37,942 |
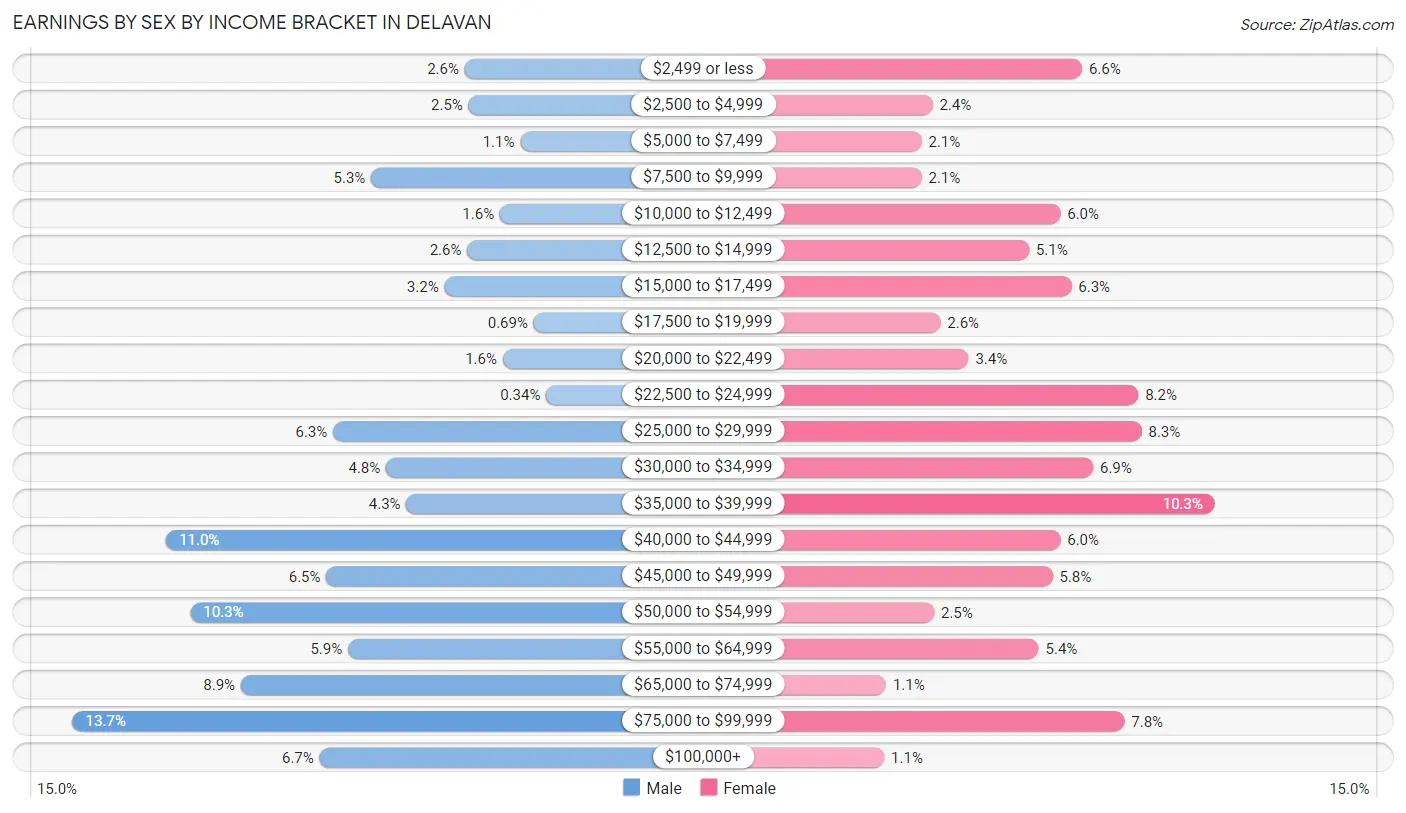
Earnings by Sex by Income Bracket in Delavan
The most common earnings brackets in Delavan are $75,000 to $99,999 for men (358 | 13.7%) and $35,000 to $39,999 for women (236 | 10.3%).
| Income | Male | Female |
| $2,499 or less | 69 (2.6%) | 151 (6.6%) |
| $2,500 to $4,999 | 66 (2.5%) | 55 (2.4%) |
| $5,000 to $7,499 | 28 (1.1%) | 48 (2.1%) |
| $7,500 to $9,999 | 138 (5.3%) | 48 (2.1%) |
| $10,000 to $12,499 | 43 (1.6%) | 137 (6.0%) |
| $12,500 to $14,999 | 67 (2.6%) | 117 (5.1%) |
| $15,000 to $17,499 | 84 (3.2%) | 144 (6.3%) |
| $17,500 to $19,999 | 18 (0.7%) | 60 (2.6%) |
| $20,000 to $22,499 | 41 (1.6%) | 78 (3.4%) |
| $22,500 to $24,999 | 9 (0.3%) | 187 (8.2%) |
| $25,000 to $29,999 | 166 (6.3%) | 189 (8.3%) |
| $30,000 to $34,999 | 127 (4.8%) | 158 (6.9%) |
| $35,000 to $39,999 | 112 (4.3%) | 236 (10.3%) |
| $40,000 to $44,999 | 289 (11.0%) | 137 (6.0%) |
| $45,000 to $49,999 | 171 (6.5%) | 132 (5.8%) |
| $50,000 to $54,999 | 271 (10.3%) | 56 (2.5%) |
| $55,000 to $64,999 | 155 (5.9%) | 123 (5.4%) |
| $65,000 to $74,999 | 234 (8.9%) | 25 (1.1%) |
| $75,000 to $99,999 | 358 (13.7%) | 178 (7.8%) |
| $100,000+ | 176 (6.7%) | 24 (1.1%) |
| Total | 2,622 (100.0%) | 2,283 (100.0%) |
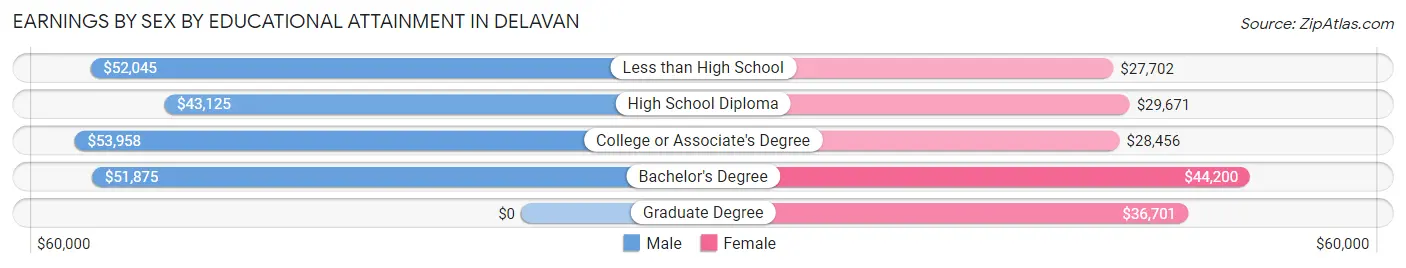
Earnings by Sex by Educational Attainment in Delavan
Average earnings in Delavan are $50,055 for men and $32,900 for women, a difference of 34.3%. Men with an educational attainment of college or associate's degree enjoy the highest average annual earnings of $53,958, while those with high school diploma education earn the least with $43,125. Women with an educational attainment of bachelor's degree earn the most with the average annual earnings of $44,200, while those with less than high school education have the smallest earnings of $27,702.
| Educational Attainment | Male Income | Female Income |
| Less than High School | $52,045 | $27,702 |
| High School Diploma | $43,125 | $29,671 |
| College or Associate's Degree | $53,958 | $28,456 |
| Bachelor's Degree | $51,875 | $44,200 |
| Graduate Degree | - | - |
| Total | $50,055 | $32,900 |
Family Income in Delavan
Family Income Brackets in Delavan
According to the Delavan family income data, there are 627 families falling into the $100,000 to $149,999 income range, which is the most common income bracket and makes up 27.5% of all families. Conversely, the less than $10,000 income bracket is the least frequent group with only 9 families (0.4%) belonging to this category.
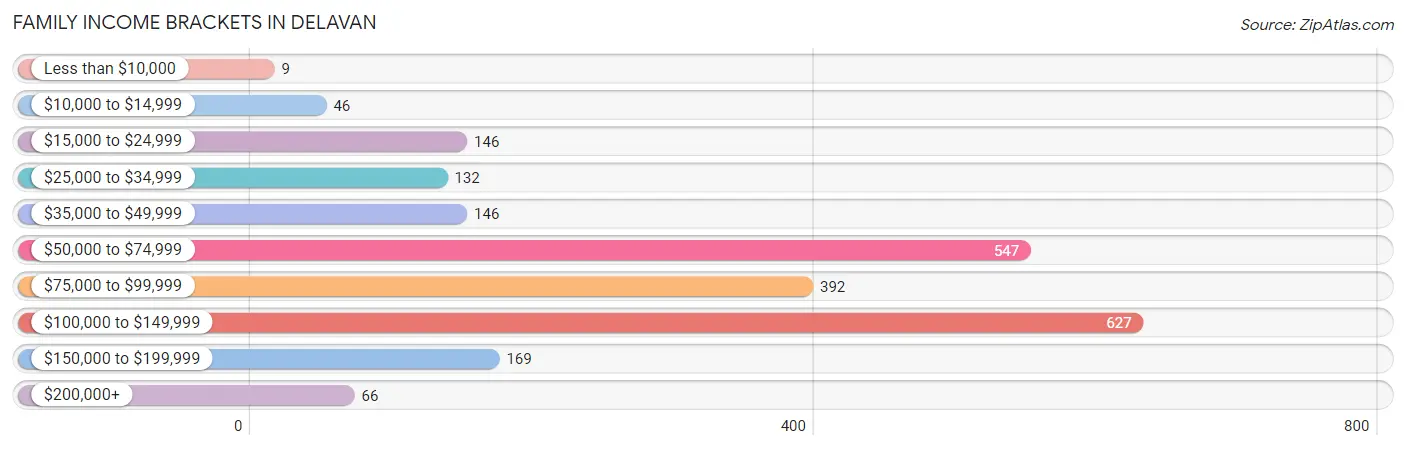
| Income Bracket | # Families | % Families |
| Less than $10,000 | 9 | 0.4% |
| $10,000 to $14,999 | 46 | 2.0% |
| $15,000 to $24,999 | 146 | 6.4% |
| $25,000 to $34,999 | 132 | 5.8% |
| $35,000 to $49,999 | 146 | 6.4% |
| $50,000 to $74,999 | 547 | 24.0% |
| $75,000 to $99,999 | 392 | 17.2% |
| $100,000 to $149,999 | 627 | 27.5% |
| $150,000 to $199,999 | 169 | 7.4% |
| $200,000+ | 66 | 2.9% |
Family Income by Famaliy Size in Delavan
7+ person families (63 | 2.8%) account for the highest median family income in Delavan with $250,001 per family, while 2-person families (1,196 | 52.5%) have the highest median income of $36,978 per family member.
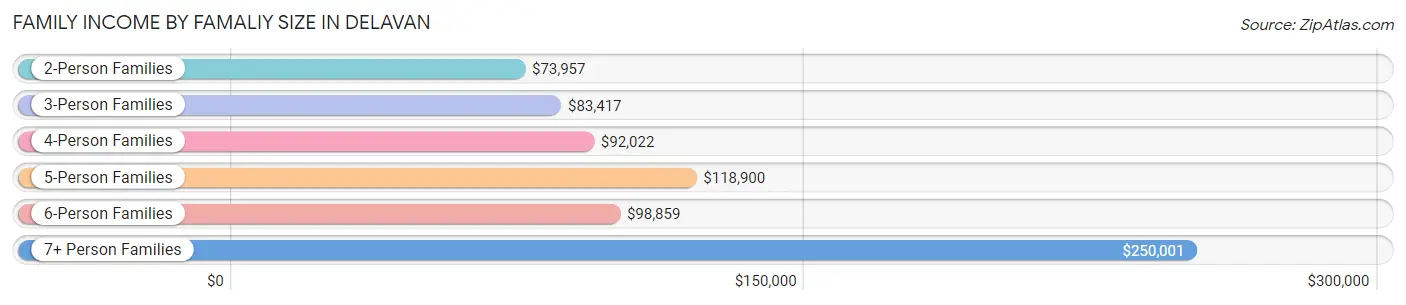
| Income Bracket | # Families | Median Income |
| 2-Person Families | 1,196 (52.5%) | $73,957 |
| 3-Person Families | 482 (21.1%) | $83,417 |
| 4-Person Families | 363 (15.9%) | $92,022 |
| 5-Person Families | 132 (5.8%) | $118,900 |
| 6-Person Families | 43 (1.9%) | $98,859 |
| 7+ Person Families | 63 (2.8%) | $250,001 |
| Total | 2,279 (100.0%) | $80,036 |
Family Income by Number of Earners in Delavan
The median family income in Delavan is $80,036, with families comprising 3+ earners (365) having the highest median family income of $117,899, while families with no earners (302) have the lowest median family income of $42,500, accounting for 16.0% and 13.3% of families, respectively.
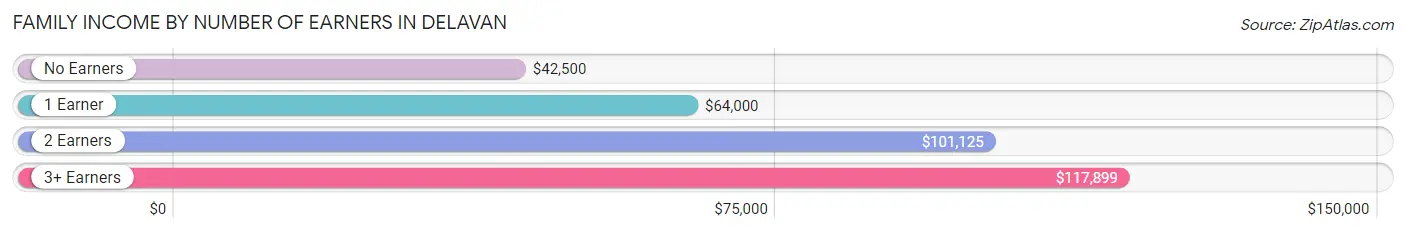
| Number of Earners | # Families | Median Income |
| No Earners | 302 (13.3%) | $42,500 |
| 1 Earner | 648 (28.4%) | $64,000 |
| 2 Earners | 964 (42.3%) | $101,125 |
| 3+ Earners | 365 (16.0%) | $117,899 |
| Total | 2,279 (100.0%) | $80,036 |
Household Income in Delavan
Household Income Brackets in Delavan
With 736 households falling in the category, the $50,000 to $74,999 income range is the most frequent in Delavan, accounting for 20.8% of all households. In contrast, only 85 households (2.4%) fall into the $200,000+ income bracket, making it the least populous group.
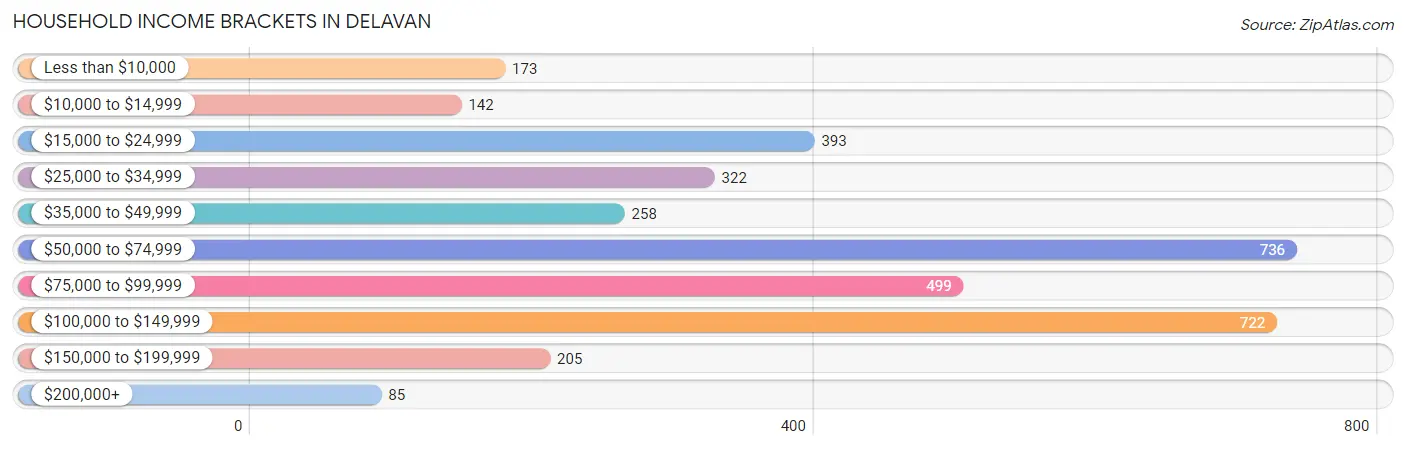
| Income Bracket | # Households | % Households |
| Less than $10,000 | 173 | 4.9% |
| $10,000 to $14,999 | 142 | 4.0% |
| $15,000 to $24,999 | 393 | 11.1% |
| $25,000 to $34,999 | 322 | 9.1% |
| $35,000 to $49,999 | 258 | 7.3% |
| $50,000 to $74,999 | 736 | 20.8% |
| $75,000 to $99,999 | 499 | 14.1% |
| $100,000 to $149,999 | 722 | 20.4% |
| $150,000 to $199,999 | 205 | 5.8% |
| $200,000+ | 85 | 2.4% |
Household Income by Householder Age in Delavan
The median household income in Delavan is $69,238, with the highest median household income of $81,051 found in the 25 to 44 years age bracket for the primary householder. A total of 1,418 households (40.1%) fall into this category. Meanwhile, the 15 to 24 years age bracket for the primary householder has the lowest median household income of $32,667, with 160 households (4.5%) in this group.
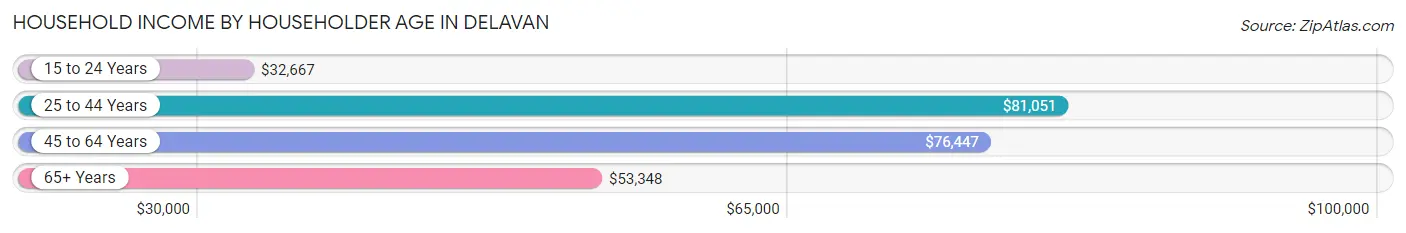
| Income Bracket | # Households | Median Income |
| 15 to 24 Years | 160 (4.5%) | $32,667 |
| 25 to 44 Years | 1,418 (40.1%) | $81,051 |
| 45 to 64 Years | 1,038 (29.3%) | $76,447 |
| 65+ Years | 923 (26.1%) | $53,348 |
| Total | 3,539 (100.0%) | $69,238 |
Poverty in Delavan
Income Below Poverty by Sex and Age in Delavan
With 8.5% poverty level for males and 9.7% for females among the residents of Delavan, 75 year old and over males and 75 year old and over females are the most vulnerable to poverty, with 56 males (32.6%) and 78 females (26.4%) in their respective age groups living below the poverty level.
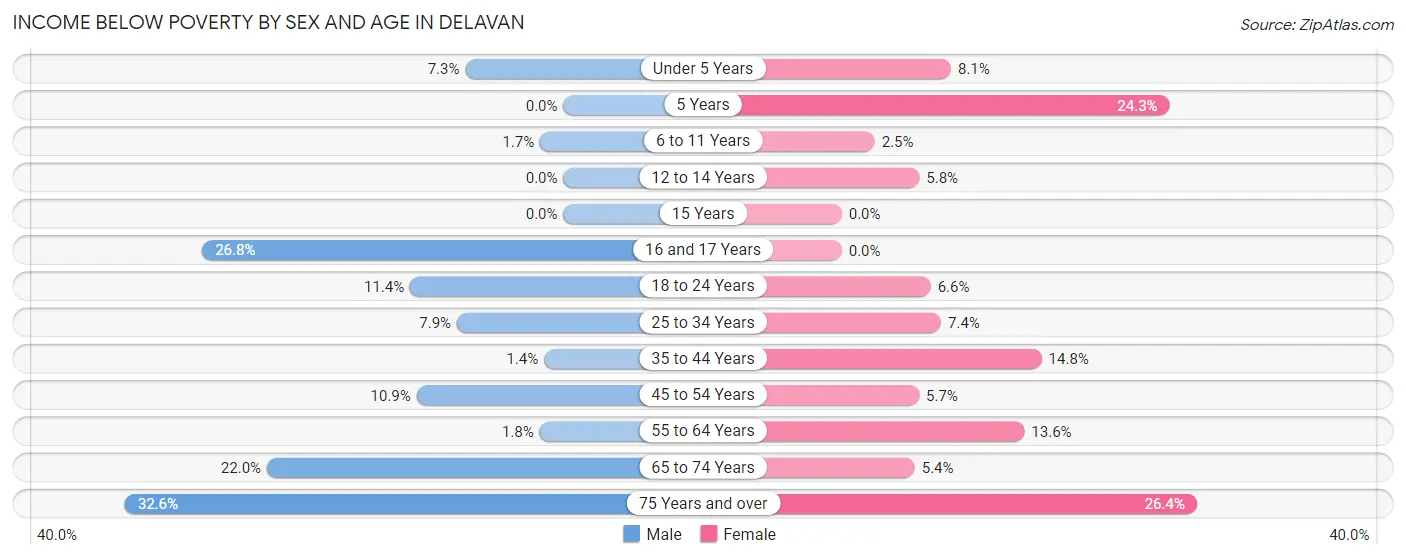
| Age Bracket | Male | Female |
| Under 5 Years | 15 (7.3%) | 9 (8.1%) |
| 5 Years | 0 (0.0%) | 9 (24.3%) |
| 6 to 11 Years | 6 (1.7%) | 10 (2.5%) |
| 12 to 14 Years | 0 (0.0%) | 8 (5.8%) |
| 15 Years | 0 (0.0%) | 0 (0.0%) |
| 16 and 17 Years | 37 (26.8%) | 0 (0.0%) |
| 18 to 24 Years | 28 (11.4%) | 26 (6.6%) |
| 25 to 34 Years | 66 (7.9%) | 35 (7.4%) |
| 35 to 44 Years | 9 (1.4%) | 95 (14.8%) |
| 45 to 54 Years | 41 (10.9%) | 26 (5.7%) |
| 55 to 64 Years | 10 (1.8%) | 72 (13.6%) |
| 65 to 74 Years | 103 (22.0%) | 22 (5.4%) |
| 75 Years and over | 56 (32.6%) | 78 (26.4%) |
| Total | 371 (8.5%) | 390 (9.7%) |
Income Above Poverty by Sex and Age in Delavan
According to the poverty statistics in Delavan, males aged 5 years and females aged 15 years are the age groups that are most secure financially, with 100.0% of males and 100.0% of females in these age groups living above the poverty line.
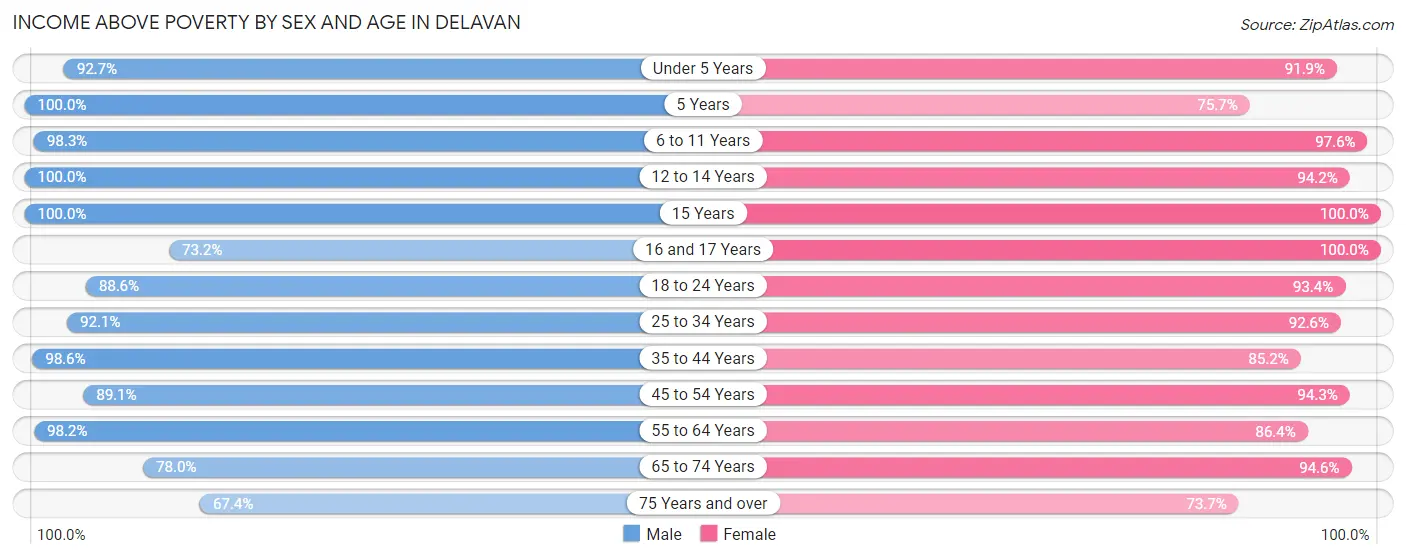
| Age Bracket | Male | Female |
| Under 5 Years | 191 (92.7%) | 102 (91.9%) |
| 5 Years | 77 (100.0%) | 28 (75.7%) |
| 6 to 11 Years | 340 (98.3%) | 398 (97.6%) |
| 12 to 14 Years | 224 (100.0%) | 131 (94.2%) |
| 15 Years | 99 (100.0%) | 46 (100.0%) |
| 16 and 17 Years | 101 (73.2%) | 105 (100.0%) |
| 18 to 24 Years | 218 (88.6%) | 368 (93.4%) |
| 25 to 34 Years | 769 (92.1%) | 440 (92.6%) |
| 35 to 44 Years | 619 (98.6%) | 545 (85.2%) |
| 45 to 54 Years | 335 (89.1%) | 427 (94.3%) |
| 55 to 64 Years | 554 (98.2%) | 459 (86.4%) |
| 65 to 74 Years | 365 (78.0%) | 384 (94.6%) |
| 75 Years and over | 116 (67.4%) | 218 (73.7%) |
| Total | 4,008 (91.5%) | 3,651 (90.3%) |
Income Below Poverty Among Married-Couple Families in Delavan
The poverty statistics for married-couple families in Delavan show that 3.3% or 51 of the total 1,567 families live below the poverty line. Families with no children have the highest poverty rate of 4.2%, comprising of 42 families. On the other hand, families with 3 or 4 children have the lowest poverty rate of 0.0%, which includes 0 families.
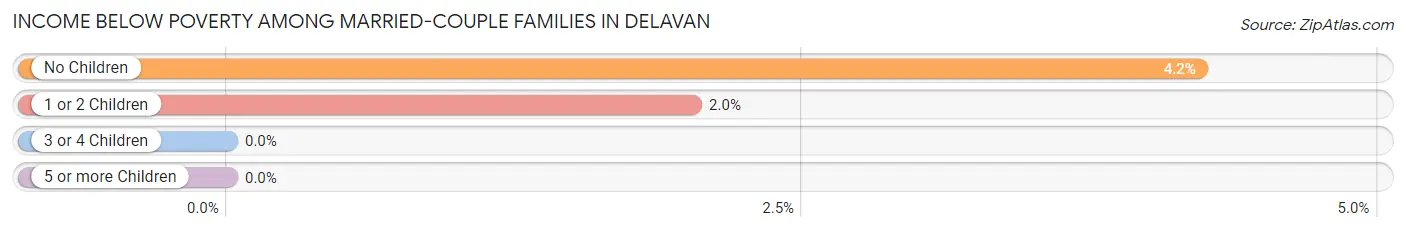
| Children | Above Poverty | Below Poverty |
| No Children | 954 (95.8%) | 42 (4.2%) |
| 1 or 2 Children | 436 (98.0%) | 9 (2.0%) |
| 3 or 4 Children | 101 (100.0%) | 0 (0.0%) |
| 5 or more Children | 25 (100.0%) | 0 (0.0%) |
| Total | 1,516 (96.8%) | 51 (3.3%) |
Income Below Poverty Among Single-Parent Households in Delavan
According to the poverty data in Delavan, 8.0% or 30 single-father households and 17.3% or 58 single-mother households are living below the poverty line. Among single-father households, those with no children have the highest poverty rate, with 30 households (19.9%) experiencing poverty. Likewise, among single-mother households, those with 1 or 2 children have the highest poverty rate, with 58 households (29.3%) falling below the poverty line.
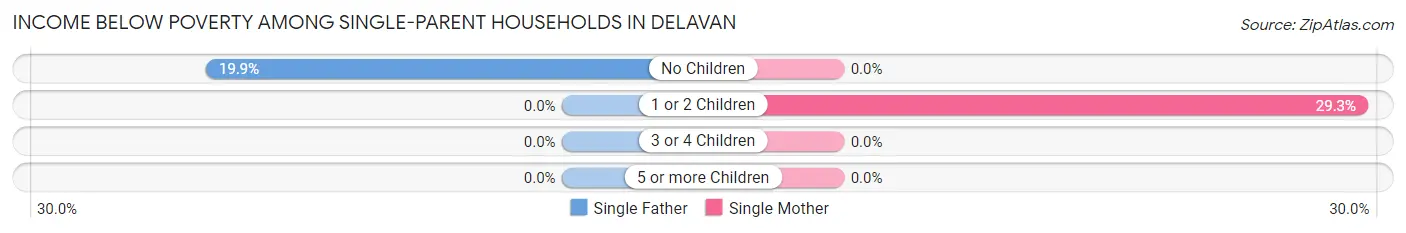
| Children | Single Father | Single Mother |
| No Children | 30 (19.9%) | 0 (0.0%) |
| 1 or 2 Children | 0 (0.0%) | 58 (29.3%) |
| 3 or 4 Children | 0 (0.0%) | 0 (0.0%) |
| 5 or more Children | 0 (0.0%) | 0 (0.0%) |
| Total | 30 (8.0%) | 58 (17.3%) |
Income Below Poverty Among Married-Couple vs Single-Parent Households in Delavan
The poverty data for Delavan shows that 51 of the married-couple family households (3.3%) and 88 of the single-parent households (12.4%) are living below the poverty level. Within the married-couple family households, those with no children have the highest poverty rate, with 42 households (4.2%) falling below the poverty line. Among the single-parent households, those with 1 or 2 children have the highest poverty rate, with 58 household (13.7%) living below poverty.
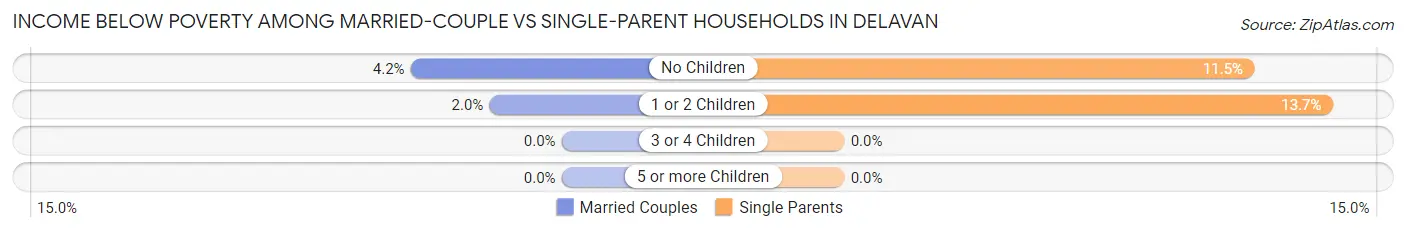
| Children | Married-Couple Families | Single-Parent Households |
| No Children | 42 (4.2%) | 30 (11.5%) |
| 1 or 2 Children | 9 (2.0%) | 58 (13.7%) |
| 3 or 4 Children | 0 (0.0%) | 0 (0.0%) |
| 5 or more Children | 0 (0.0%) | 0 (0.0%) |
| Total | 51 (3.3%) | 88 (12.4%) |
Race in Delavan
The most populous races in Delavan are White / Caucasian (7,233 | 84.9%), Hispanic or Latino (2,065 | 24.2%), and Some other Race (598 | 7.0%).
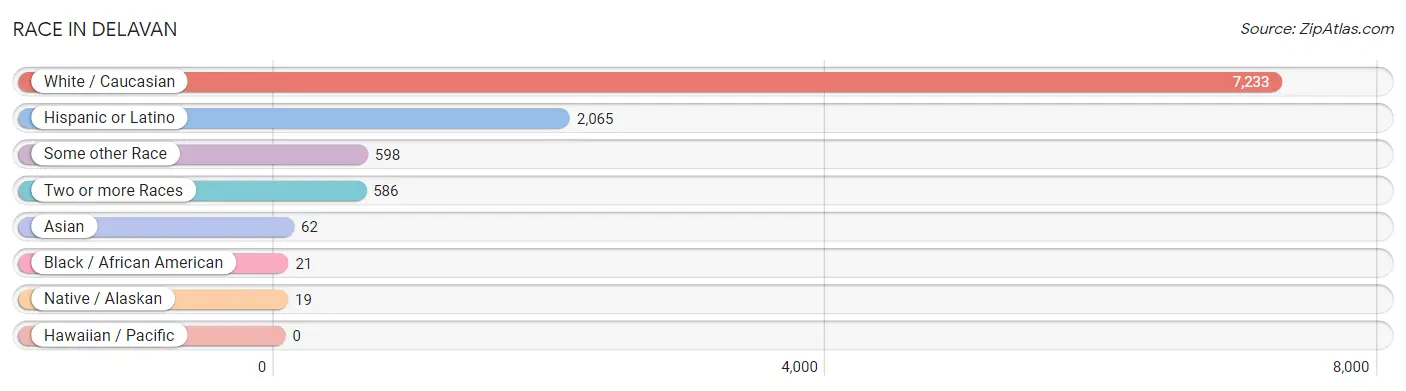
| Race | # Population | % Population |
| Asian | 62 | 0.7% |
| Black / African American | 21 | 0.3% |
| Hawaiian / Pacific | 0 | 0.0% |
| Hispanic or Latino | 2,065 | 24.2% |
| Native / Alaskan | 19 | 0.2% |
| White / Caucasian | 7,233 | 84.9% |
| Two or more Races | 586 | 6.9% |
| Some other Race | 598 | 7.0% |
| Total | 8,519 | 100.0% |
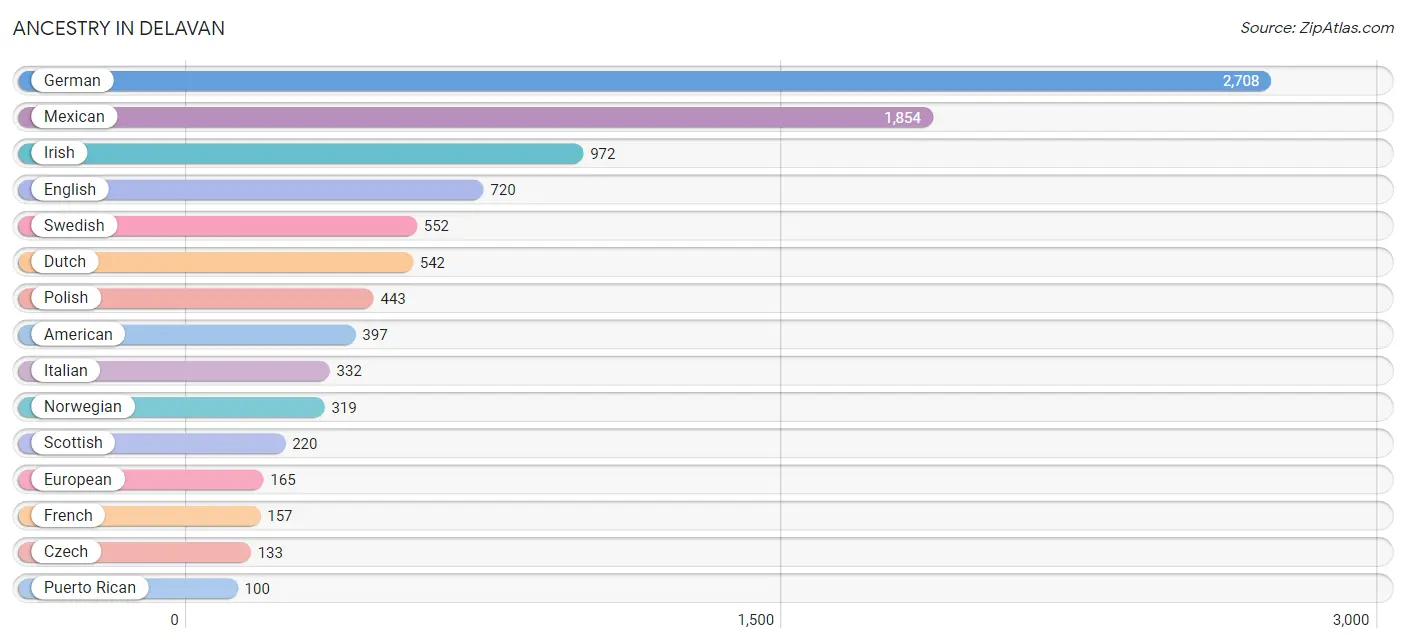
Ancestry in Delavan
The most populous ancestries reported in Delavan are German (2,708 | 31.8%), Mexican (1,854 | 21.8%), Irish (972 | 11.4%), English (720 | 8.5%), and Swedish (552 | 6.5%), together accounting for 79.9% of all Delavan residents.
| Ancestry | # Population | % Population |
| American | 397 | 4.7% |
| Bangladeshi | 53 | 0.6% |
| Belgian | 18 | 0.2% |
| Bhutanese | 31 | 0.4% |
| British | 41 | 0.5% |
| Bulgarian | 12 | 0.1% |
| Central American | 40 | 0.5% |
| Chippewa | 29 | 0.3% |
| Croatian | 17 | 0.2% |
| Cuban | 6 | 0.1% |
| Czech | 133 | 1.6% |
| Danish | 31 | 0.4% |
| Dutch | 542 | 6.4% |
| Eastern European | 13 | 0.2% |
| English | 720 | 8.5% |
| European | 165 | 1.9% |
| French | 157 | 1.8% |
| French Canadian | 4 | 0.1% |
| German | 2,708 | 31.8% |
| Guatemalan | 35 | 0.4% |
| Honduran | 5 | 0.1% |
| Inupiat | 20 | 0.2% |
| Irish | 972 | 11.4% |
| Italian | 332 | 3.9% |
| Latvian | 10 | 0.1% |
| Lithuanian | 61 | 0.7% |
| Mexican | 1,854 | 21.8% |
| Native Hawaiian | 20 | 0.2% |
| Northern European | 9 | 0.1% |
| Norwegian | 319 | 3.7% |
| Pennsylvania German | 27 | 0.3% |
| Polish | 443 | 5.2% |
| Puerto Rican | 100 | 1.2% |
| Romanian | 9 | 0.1% |
| Russian | 62 | 0.7% |
| Samoan | 20 | 0.2% |
| Scotch-Irish | 24 | 0.3% |
| Scottish | 220 | 2.6% |
| Slovak | 12 | 0.1% |
| Slovene | 13 | 0.2% |
| South African | 9 | 0.1% |
| Spaniard | 24 | 0.3% |
| Spanish | 17 | 0.2% |
| Sri Lankan | 9 | 0.1% |
| Subsaharan African | 9 | 0.1% |
| Swedish | 552 | 6.5% |
| Swiss | 69 | 0.8% |
| Thai | 20 | 0.2% |
| Ukrainian | 9 | 0.1% |
| Welsh | 77 | 0.9% |
| Yugoslavian | 10 | 0.1% | View All 51 Rows |
Immigrants in Delavan
The most numerous immigrant groups reported in Delavan came from Central America (560 | 6.6%), Latin America (560 | 6.6%), Mexico (531 | 6.2%), Europe (57 | 0.7%), and Northern Europe (27 | 0.3%), together accounting for 20.4% of all Delavan residents.
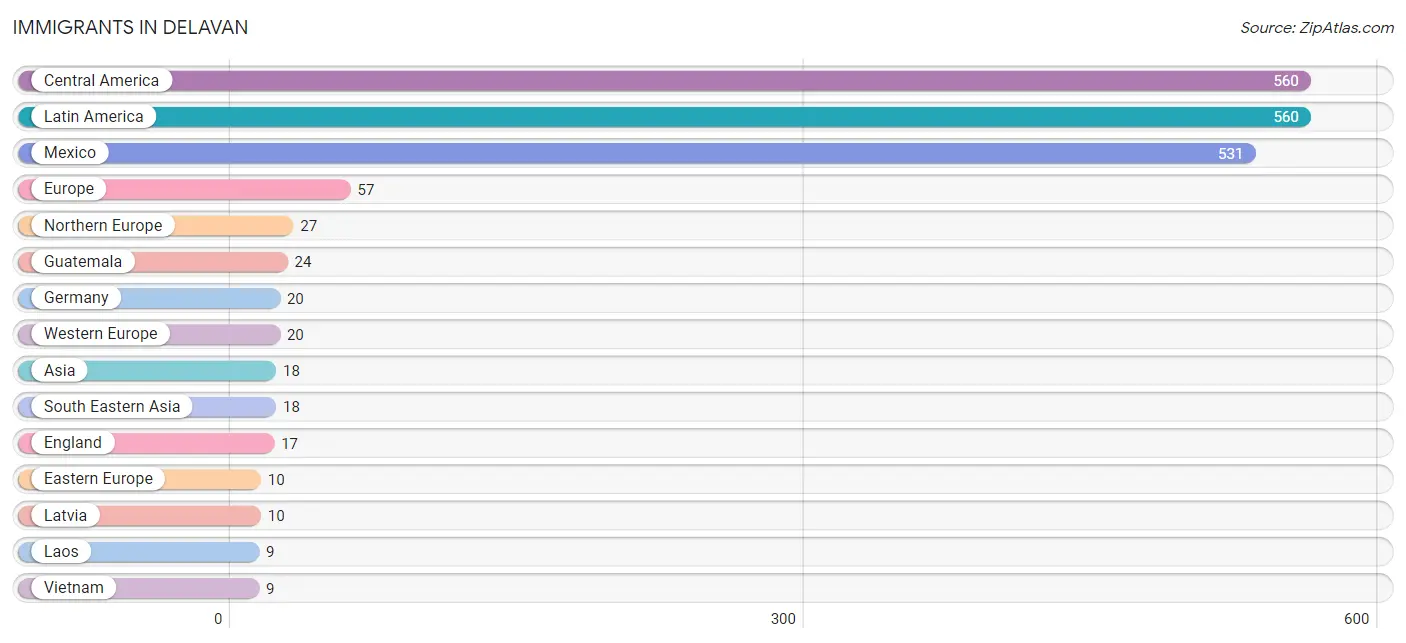
| Immigration Origin | # Population | % Population |
| Asia | 18 | 0.2% |
| Central America | 560 | 6.6% |
| Eastern Europe | 10 | 0.1% |
| England | 17 | 0.2% |
| Europe | 57 | 0.7% |
| Germany | 20 | 0.2% |
| Guatemala | 24 | 0.3% |
| Honduras | 5 | 0.1% |
| Laos | 9 | 0.1% |
| Latin America | 560 | 6.6% |
| Latvia | 10 | 0.1% |
| Mexico | 531 | 6.2% |
| Northern Europe | 27 | 0.3% |
| South Eastern Asia | 18 | 0.2% |
| Vietnam | 9 | 0.1% |
| Western Europe | 20 | 0.2% | View All 16 Rows |
Sex and Age in Delavan
Sex and Age in Delavan
The most populous age groups in Delavan are 25 to 29 Years (525 | 12.0%) for men and 35 to 39 Years (401 | 9.7%) for women.
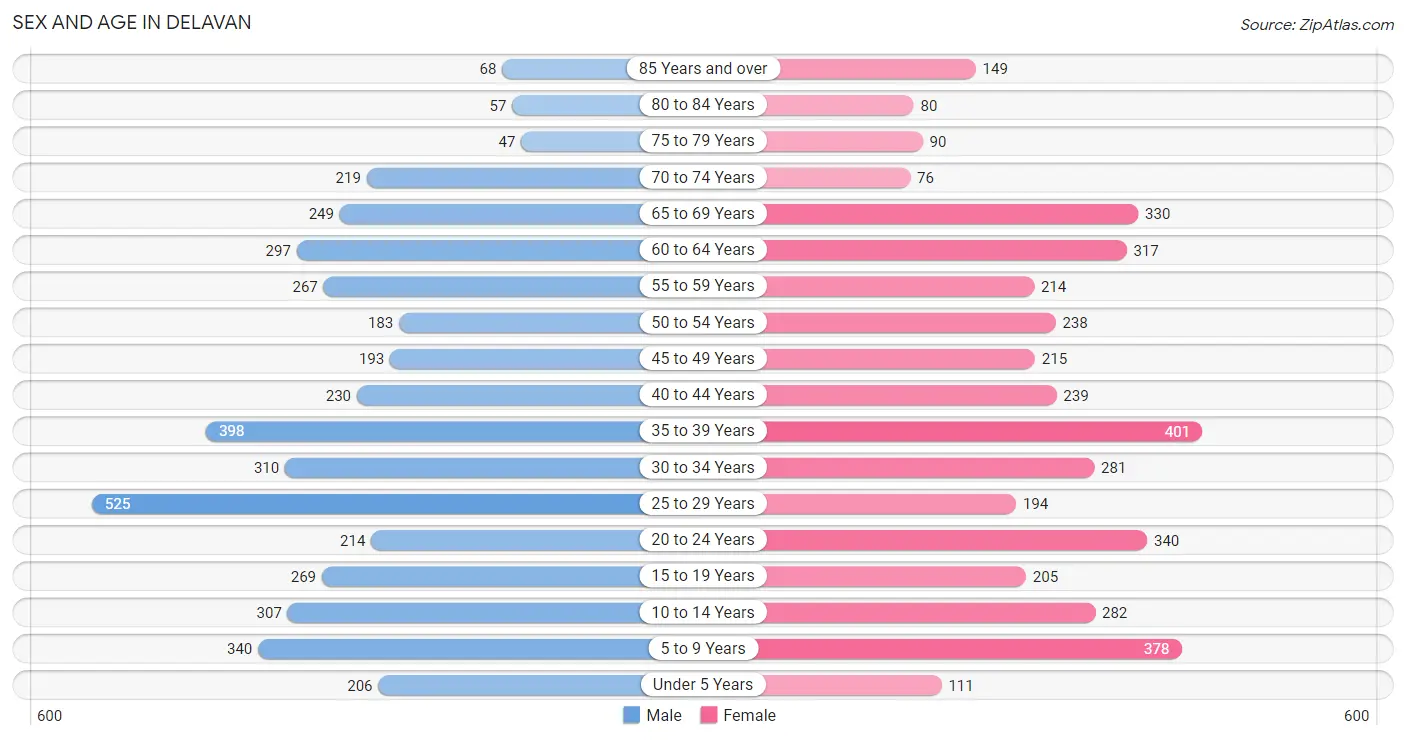
| Age Bracket | Male | Female |
| Under 5 Years | 206 (4.7%) | 111 (2.7%) |
| 5 to 9 Years | 340 (7.8%) | 378 (9.1%) |
| 10 to 14 Years | 307 (7.0%) | 282 (6.8%) |
| 15 to 19 Years | 269 (6.1%) | 205 (5.0%) |
| 20 to 24 Years | 214 (4.9%) | 340 (8.2%) |
| 25 to 29 Years | 525 (12.0%) | 194 (4.7%) |
| 30 to 34 Years | 310 (7.1%) | 281 (6.8%) |
| 35 to 39 Years | 398 (9.1%) | 401 (9.7%) |
| 40 to 44 Years | 230 (5.2%) | 239 (5.8%) |
| 45 to 49 Years | 193 (4.4%) | 215 (5.2%) |
| 50 to 54 Years | 183 (4.2%) | 238 (5.8%) |
| 55 to 59 Years | 267 (6.1%) | 214 (5.2%) |
| 60 to 64 Years | 297 (6.8%) | 317 (7.7%) |
| 65 to 69 Years | 249 (5.7%) | 330 (8.0%) |
| 70 to 74 Years | 219 (5.0%) | 76 (1.8%) |
| 75 to 79 Years | 47 (1.1%) | 90 (2.2%) |
| 80 to 84 Years | 57 (1.3%) | 80 (1.9%) |
| 85 Years and over | 68 (1.5%) | 149 (3.6%) |
| Total | 4,379 (100.0%) | 4,140 (100.0%) |
Families and Households in Delavan
Median Family Size in Delavan
The median family size in Delavan is 2.92 persons per family, with single female/mother families (335 | 14.7%) accounting for the largest median family size of 3.07 persons per family. On the other hand, single male/father families (377 | 16.5%) represent the smallest median family size with 2.42 persons per family.
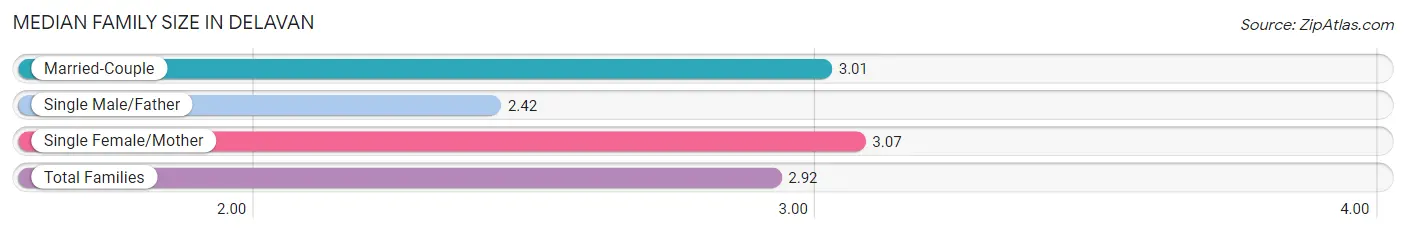
| Family Type | # Families | Family Size |
| Married-Couple | 1,567 (68.8%) | 3.01 |
| Single Male/Father | 377 (16.5%) | 2.42 |
| Single Female/Mother | 335 (14.7%) | 3.07 |
| Total Families | 2,279 (100.0%) | 2.92 |
Median Household Size in Delavan
The median household size in Delavan is 2.39 persons per household, with single female/mother households (335 | 9.5%) accounting for the largest median household size of 3.27 persons per household. non-family households (1,260 | 35.6%) represent the smallest median household size with 1.18 persons per household.
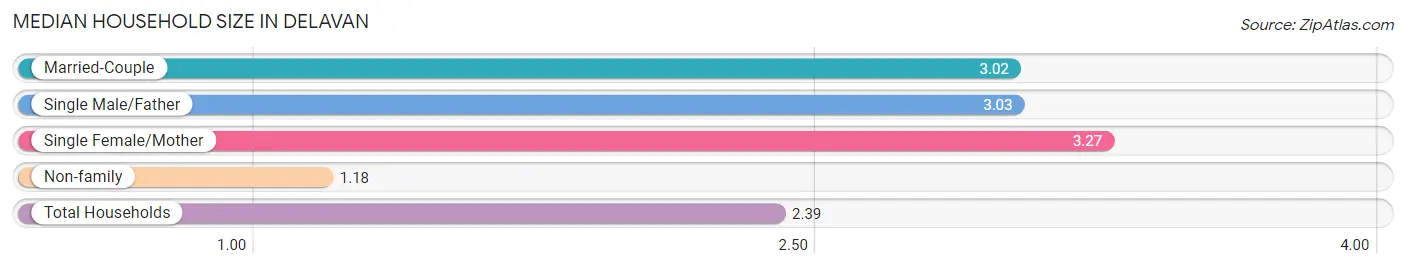
| Household Type | # Households | Household Size |
| Married-Couple | 1,567 (44.3%) | 3.02 |
| Single Male/Father | 377 (10.6%) | 3.03 |
| Single Female/Mother | 335 (9.5%) | 3.27 |
| Non-family | 1,260 (35.6%) | 1.18 |
| Total Households | 3,539 (100.0%) | 2.39 |
Household Size by Marriage Status in Delavan
Out of a total of 3,539 households in Delavan, 2,279 (64.4%) are family households, while 1,260 (35.6%) are nonfamily households. The most numerous type of family households are 2-person households, comprising 1,046, and the most common type of nonfamily households are 1-person households, comprising 1,067.
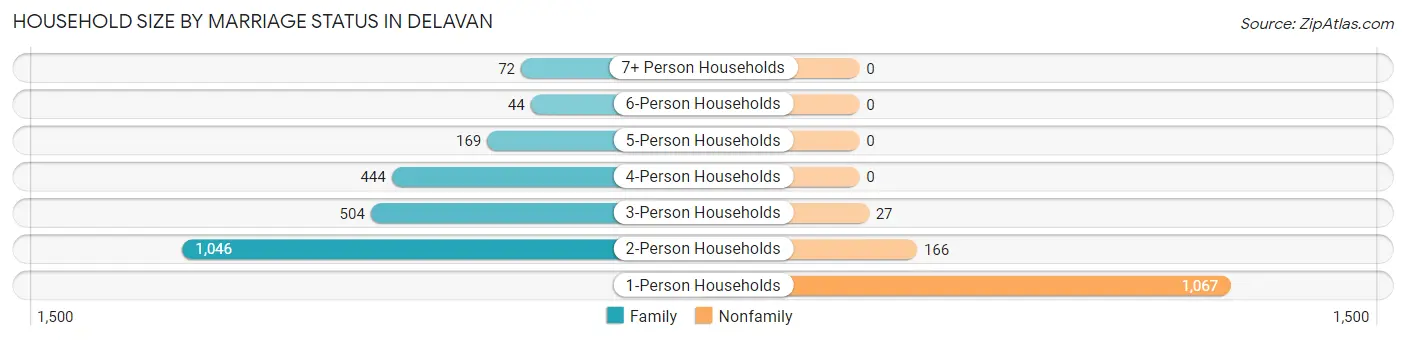
| Household Size | Family Households | Nonfamily Households |
| 1-Person Households | - | 1,067 (30.1%) |
| 2-Person Households | 1,046 (29.6%) | 166 (4.7%) |
| 3-Person Households | 504 (14.2%) | 27 (0.8%) |
| 4-Person Households | 444 (12.6%) | 0 (0.0%) |
| 5-Person Households | 169 (4.8%) | 0 (0.0%) |
| 6-Person Households | 44 (1.2%) | 0 (0.0%) |
| 7+ Person Households | 72 (2.0%) | 0 (0.0%) |
| Total | 2,279 (64.4%) | 1,260 (35.6%) |
Female Fertility in Delavan
Fertility by Age in Delavan
Average fertility rate in Delavan is 6.0 births per 1,000 women. Women in the age bracket of 20 to 34 years have the highest fertility rate with 15.0 births per 1,000 women. Women in the age bracket of 20 to 34 years acount for 100.0% of all women with births.
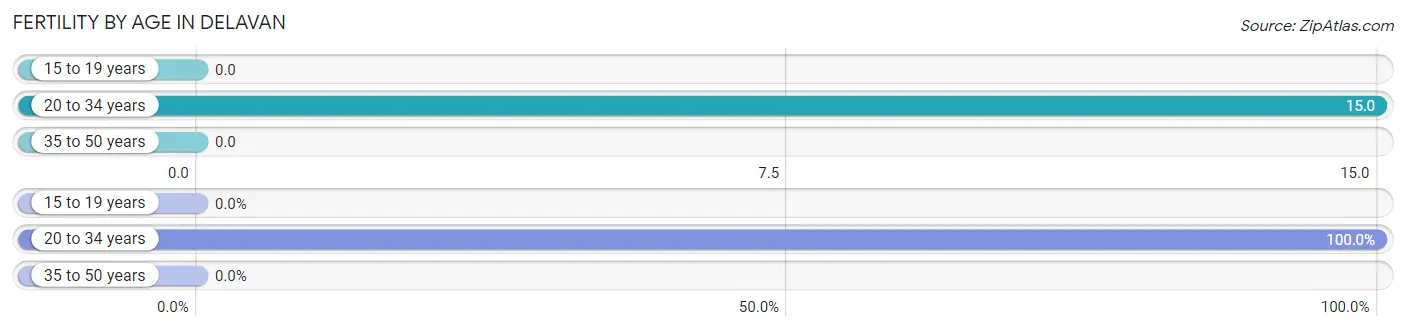
| Age Bracket | Women with Births | Births / 1,000 Women |
| 15 to 19 years | 0 (0.0%) | 0.0 |
| 20 to 34 years | 12 (100.0%) | 15.0 |
| 35 to 50 years | 0 (0.0%) | 0.0 |
| Total | 12 (100.0%) | 6.0 |
Fertility by Age by Marriage Status in Delavan
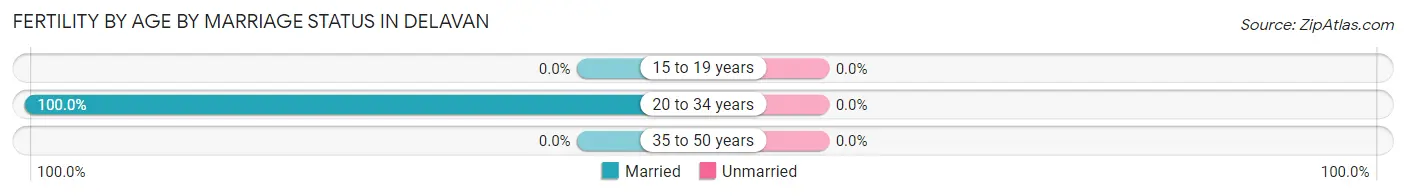
| Age Bracket | Married | Unmarried |
| 15 to 19 years | 0 (0.0%) | 0 (0.0%) |
| 20 to 34 years | 12 (100.0%) | 0 (0.0%) |
| 35 to 50 years | 0 (0.0%) | 0 (0.0%) |
| Total | 12 (100.0%) | 0 (0.0%) |
Fertility by Education in Delavan
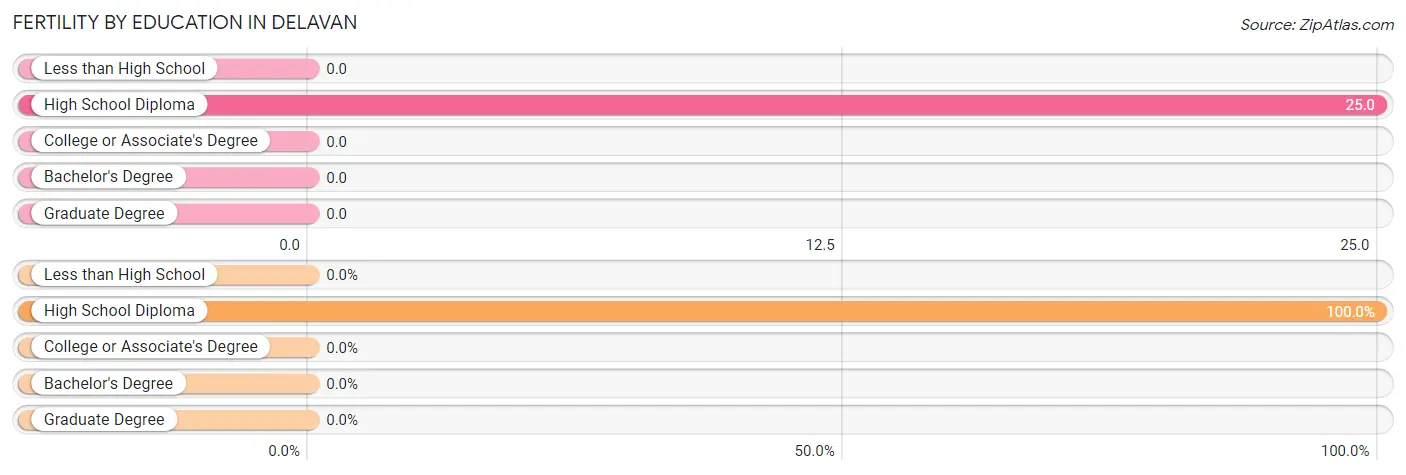
| Educational Attainment | Women with Births | Births / 1,000 Women |
| Less than High School | 0 (0.0%) | 0.0 |
| High School Diploma | 12 (100.0%) | 25.0 |
| College or Associate's Degree | 0 (0.0%) | 0.0 |
| Bachelor's Degree | 0 (0.0%) | 0.0 |
| Graduate Degree | 0 (0.0%) | 0.0 |
| Total | 12 (100.0%) | 6.0 |
Fertility by Education by Marriage Status in Delavan
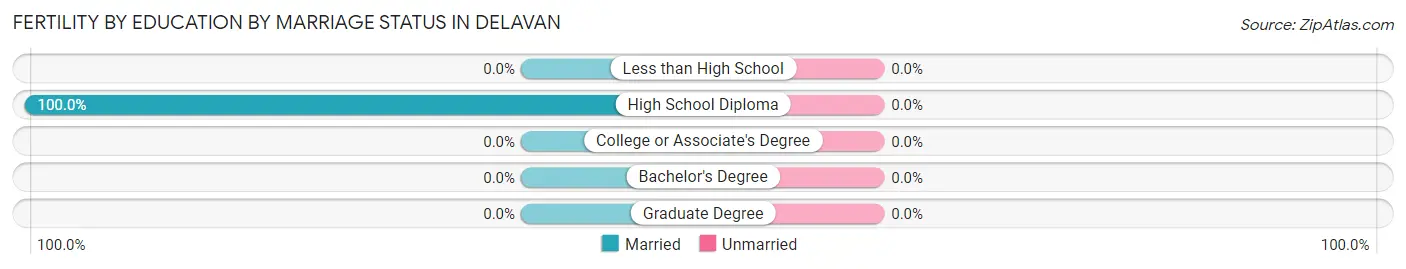
| Educational Attainment | Married | Unmarried |
| Less than High School | 0 (0.0%) | 0 (0.0%) |
| High School Diploma | 12 (100.0%) | 0 (0.0%) |
| College or Associate's Degree | 0 (0.0%) | 0 (0.0%) |
| Bachelor's Degree | 0 (0.0%) | 0 (0.0%) |
| Graduate Degree | 0 (0.0%) | 0 (0.0%) |
| Total | 12 (100.0%) | 0 (0.0%) |
Employment Characteristics in Delavan
Employment by Class of Employer in Delavan
Among the 4,372 employed individuals in Delavan, private company employees (3,262 | 74.6%), not-for-profit organizations (370 | 8.5%), and local government employees (221 | 5.1%) make up the most common classes of employment.
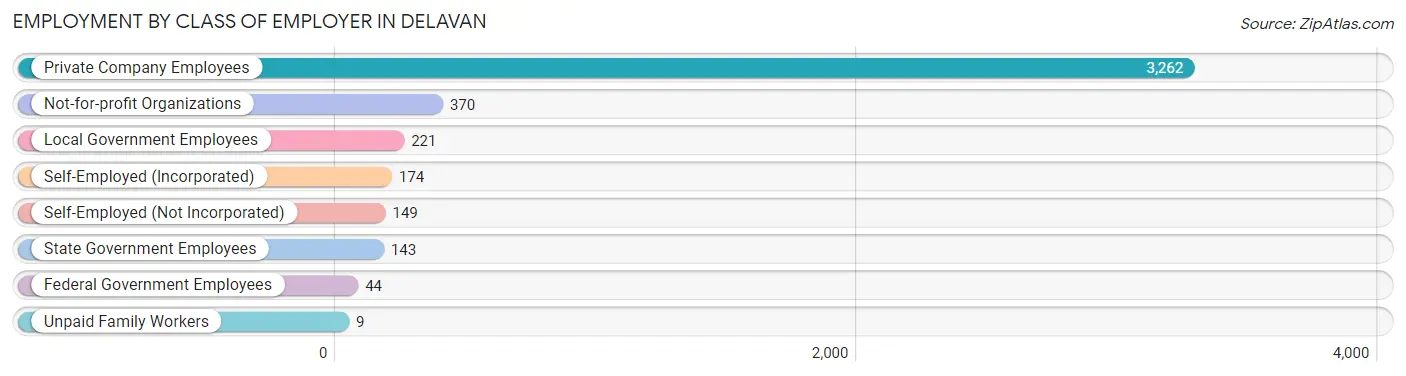
| Employer Class | # Employees | % Employees |
| Private Company Employees | 3,262 | 74.6% |
| Self-Employed (Incorporated) | 174 | 4.0% |
| Self-Employed (Not Incorporated) | 149 | 3.4% |
| Not-for-profit Organizations | 370 | 8.5% |
| Local Government Employees | 221 | 5.1% |
| State Government Employees | 143 | 3.3% |
| Federal Government Employees | 44 | 1.0% |
| Unpaid Family Workers | 9 | 0.2% |
| Total | 4,372 | 100.0% |
Employment Status by Age in Delavan
According to the labor force statistics for Delavan, out of the total population over 16 years of age (6,750), 68.9% or 4,651 individuals are in the labor force, with 4.3% or 200 of them unemployed. The age group with the highest labor force participation rate is 25 to 29 years, with 94.0% or 676 individuals in the labor force. Within the labor force, the 65 to 74 years age range has the highest percentage of unemployed individuals, with 17.0% or 41 of them being unemployed.
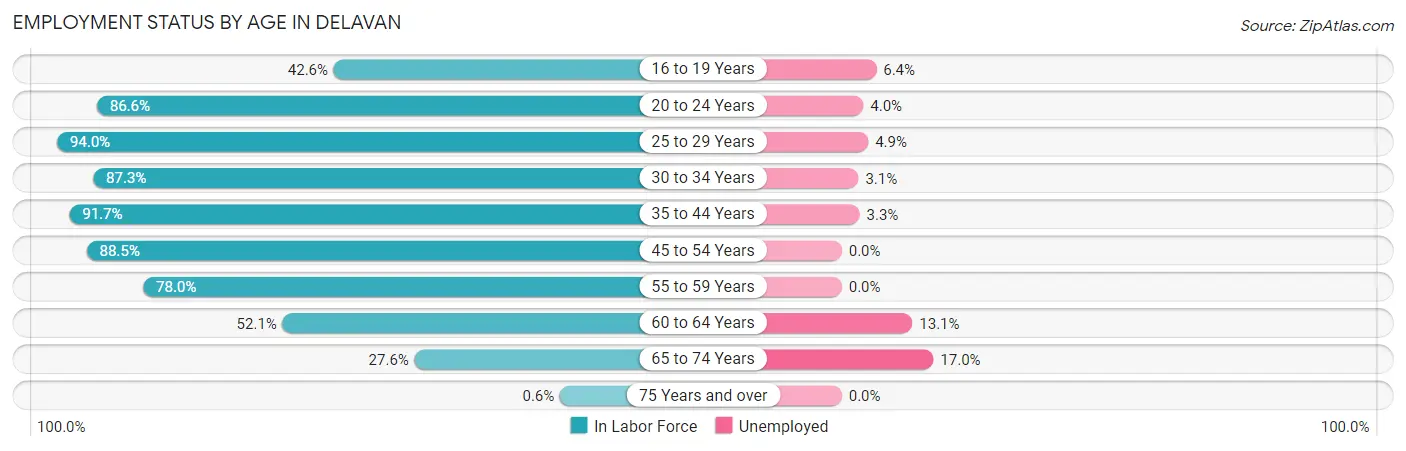
| Age Bracket | In Labor Force | Unemployed |
| 16 to 19 Years | 140 (42.6%) | 9 (6.4%) |
| 20 to 24 Years | 480 (86.6%) | 19 (4.0%) |
| 25 to 29 Years | 676 (94.0%) | 33 (4.9%) |
| 30 to 34 Years | 516 (87.3%) | 16 (3.1%) |
| 35 to 44 Years | 1,163 (91.7%) | 38 (3.3%) |
| 45 to 54 Years | 734 (88.5%) | 0 (0.0%) |
| 55 to 59 Years | 375 (78.0%) | 0 (0.0%) |
| 60 to 64 Years | 320 (52.1%) | 42 (13.1%) |
| 65 to 74 Years | 241 (27.6%) | 41 (17.0%) |
| 75 Years and over | 3 (0.6%) | 0 (0.0%) |
| Total | 4,651 (68.9%) | 200 (4.3%) |
Employment Status by Educational Attainment in Delavan
According to labor force statistics for Delavan, 84.1% of individuals (3,786) out of the total population between 25 and 64 years of age (4,502) are in the labor force, with 3.4% or 129 of them being unemployed. The group with the highest labor force participation rate are those with the educational attainment of bachelor's degree or higher, with 90.0% or 1,121 individuals in the labor force. Within the labor force, individuals with high school diploma education have the highest percentage of unemployment, with 6.4% or 82 of them being unemployed.
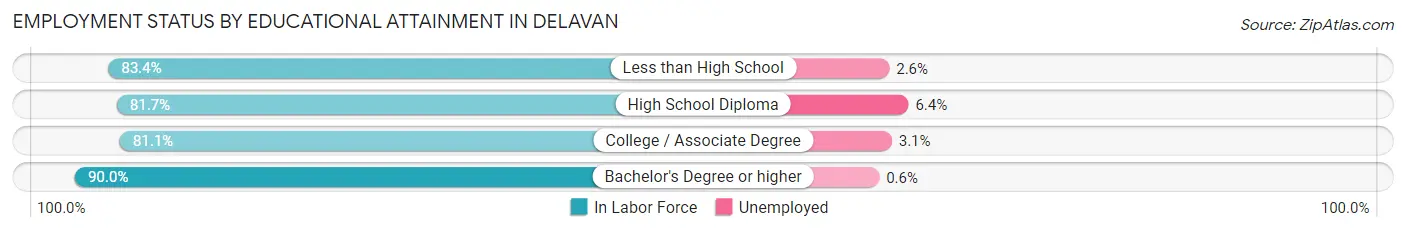
| Educational Attainment | In Labor Force | Unemployed |
| Less than High School | 458 (83.4%) | 14 (2.6%) |
| High School Diploma | 1,275 (81.7%) | 100 (6.4%) |
| College / Associate Degree | 930 (81.1%) | 36 (3.1%) |
| Bachelor's Degree or higher | 1,121 (90.0%) | 7 (0.6%) |
| Total | 3,786 (84.1%) | 153 (3.4%) |
Employment Occupations by Sex in Delavan
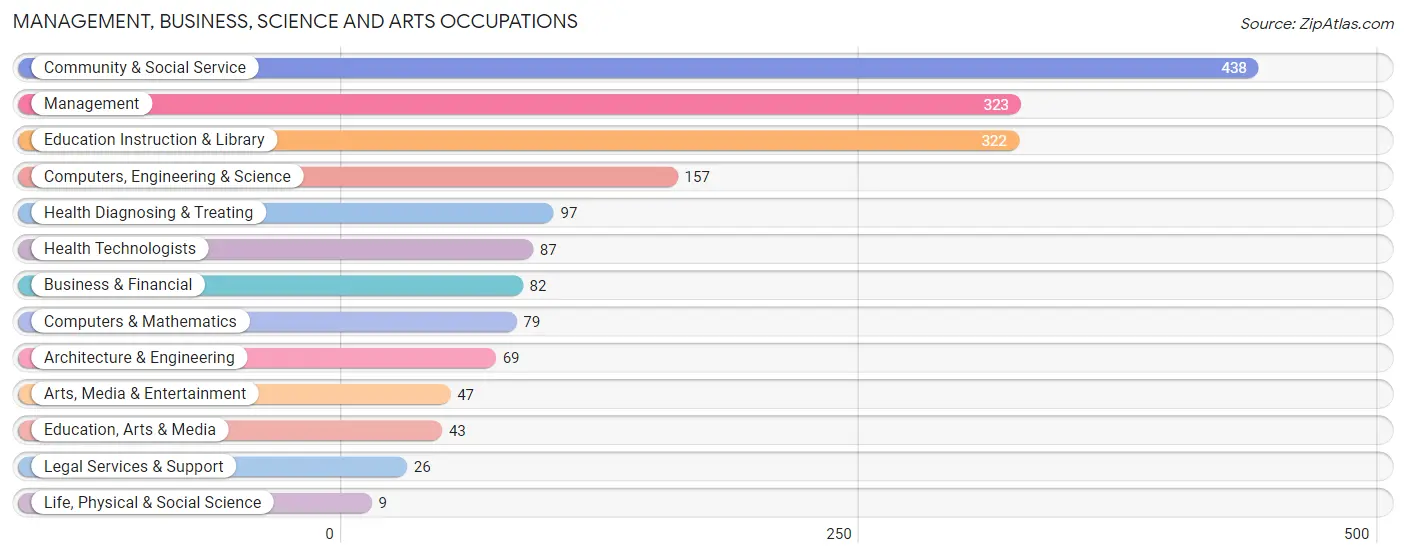
Management, Business, Science and Arts Occupations
The most common Management, Business, Science and Arts occupations in Delavan are Community & Social Service (438 | 9.8%), Management (323 | 7.3%), Education Instruction & Library (322 | 7.2%), Computers, Engineering & Science (157 | 3.5%), and Health Diagnosing & Treating (97 | 2.2%).
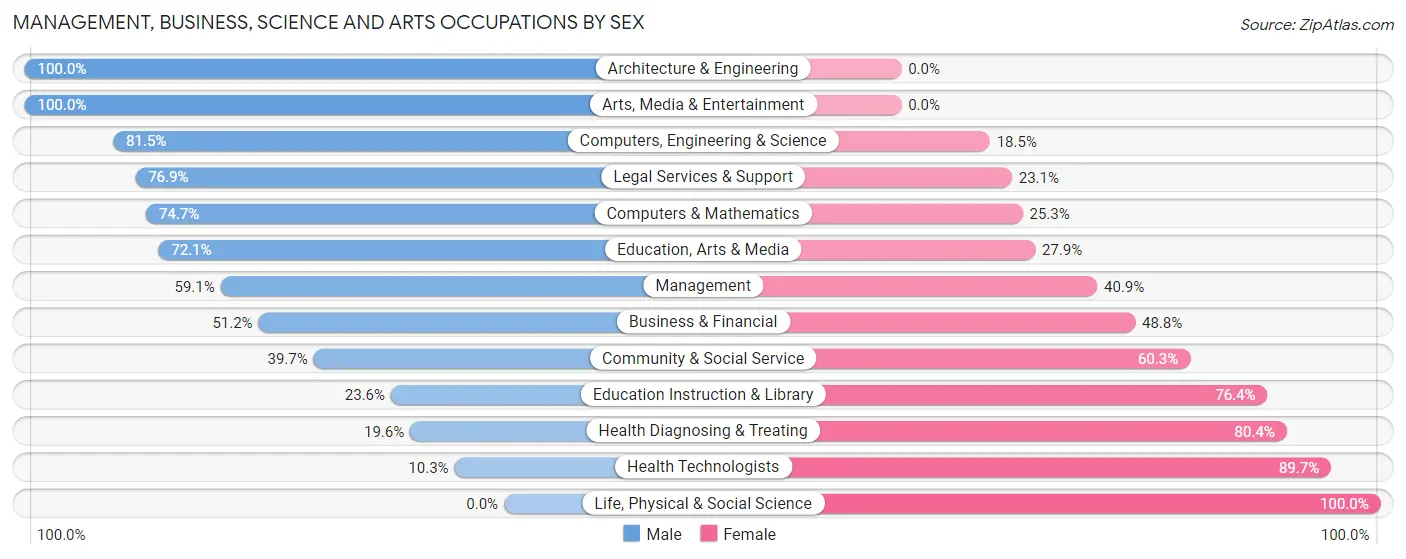
Management, Business, Science and Arts Occupations by Sex
Within the Management, Business, Science and Arts occupations in Delavan, the most male-oriented occupations are Architecture & Engineering (100.0%), Arts, Media & Entertainment (100.0%), and Computers, Engineering & Science (81.5%), while the most female-oriented occupations are Life, Physical & Social Science (100.0%), Health Technologists (89.7%), and Health Diagnosing & Treating (80.4%).
| Occupation | Male | Female |
| Management | 191 (59.1%) | 132 (40.9%) |
| Business & Financial | 42 (51.2%) | 40 (48.8%) |
| Computers, Engineering & Science | 128 (81.5%) | 29 (18.5%) |
| Computers & Mathematics | 59 (74.7%) | 20 (25.3%) |
| Architecture & Engineering | 69 (100.0%) | 0 (0.0%) |
| Life, Physical & Social Science | 0 (0.0%) | 9 (100.0%) |
| Community & Social Service | 174 (39.7%) | 264 (60.3%) |
| Education, Arts & Media | 31 (72.1%) | 12 (27.9%) |
| Legal Services & Support | 20 (76.9%) | 6 (23.1%) |
| Education Instruction & Library | 76 (23.6%) | 246 (76.4%) |
| Arts, Media & Entertainment | 47 (100.0%) | 0 (0.0%) |
| Health Diagnosing & Treating | 19 (19.6%) | 78 (80.4%) |
| Health Technologists | 9 (10.3%) | 78 (89.7%) |
| Total (Category) | 554 (50.5%) | 543 (49.5%) |
| Total (Overall) | 2,462 (55.3%) | 1,988 (44.7%) |
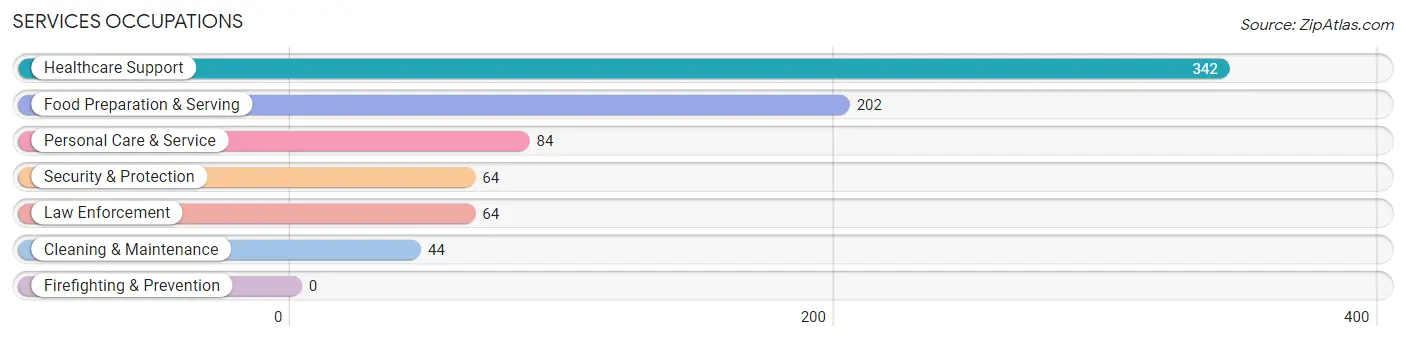
Services Occupations
The most common Services occupations in Delavan are Healthcare Support (342 | 7.7%), Food Preparation & Serving (202 | 4.5%), Personal Care & Service (84 | 1.9%), Security & Protection (64 | 1.4%), and Law Enforcement (64 | 1.4%).
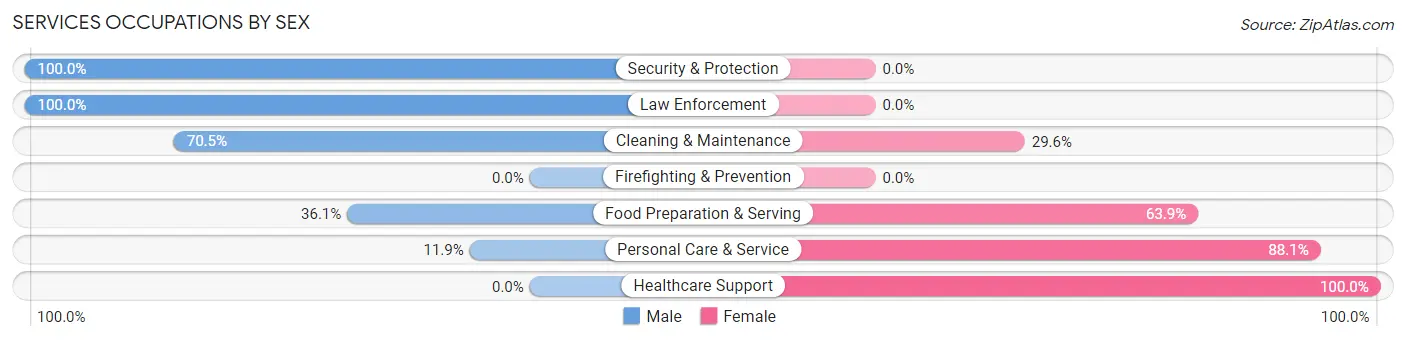
Services Occupations by Sex
Within the Services occupations in Delavan, the most male-oriented occupations are Security & Protection (100.0%), Law Enforcement (100.0%), and Cleaning & Maintenance (70.5%), while the most female-oriented occupations are Healthcare Support (100.0%), Personal Care & Service (88.1%), and Food Preparation & Serving (63.9%).
| Occupation | Male | Female |
| Healthcare Support | 0 (0.0%) | 342 (100.0%) |
| Security & Protection | 64 (100.0%) | 0 (0.0%) |
| Firefighting & Prevention | 0 (0.0%) | 0 (0.0%) |
| Law Enforcement | 64 (100.0%) | 0 (0.0%) |
| Food Preparation & Serving | 73 (36.1%) | 129 (63.9%) |
| Cleaning & Maintenance | 31 (70.5%) | 13 (29.5%) |
| Personal Care & Service | 10 (11.9%) | 74 (88.1%) |
| Total (Category) | 178 (24.2%) | 558 (75.8%) |
| Total (Overall) | 2,462 (55.3%) | 1,988 (44.7%) |
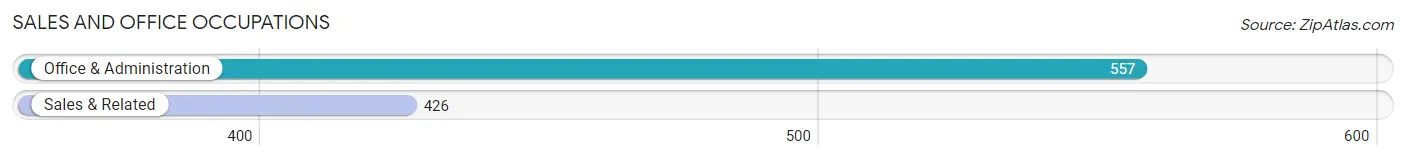
Sales and Office Occupations
The most common Sales and Office occupations in Delavan are Office & Administration (557 | 12.5%), and Sales & Related (426 | 9.6%).
Sales and Office Occupations by Sex
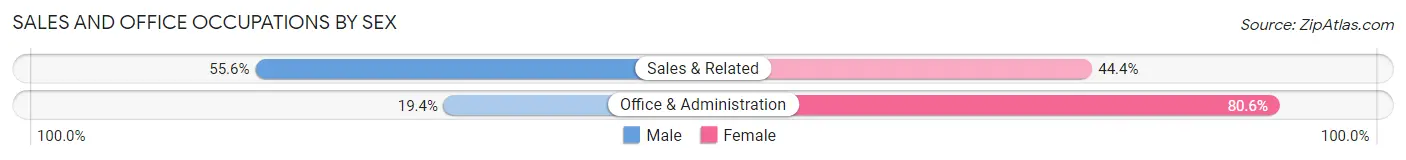
| Occupation | Male | Female |
| Sales & Related | 237 (55.6%) | 189 (44.4%) |
| Office & Administration | 108 (19.4%) | 449 (80.6%) |
| Total (Category) | 345 (35.1%) | 638 (64.9%) |
| Total (Overall) | 2,462 (55.3%) | 1,988 (44.7%) |
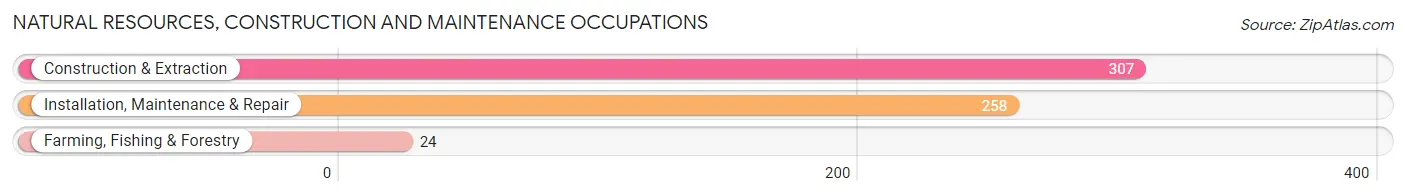
Natural Resources, Construction and Maintenance Occupations
The most common Natural Resources, Construction and Maintenance occupations in Delavan are Construction & Extraction (307 | 6.9%), Installation, Maintenance & Repair (258 | 5.8%), and Farming, Fishing & Forestry (24 | 0.5%).
Natural Resources, Construction and Maintenance Occupations by Sex
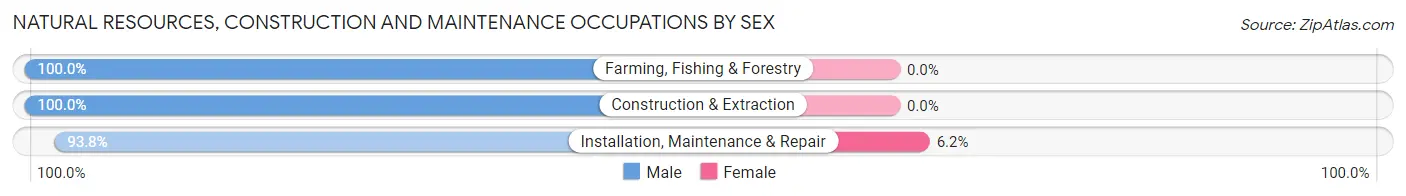
| Occupation | Male | Female |
| Farming, Fishing & Forestry | 24 (100.0%) | 0 (0.0%) |
| Construction & Extraction | 307 (100.0%) | 0 (0.0%) |
| Installation, Maintenance & Repair | 242 (93.8%) | 16 (6.2%) |
| Total (Category) | 573 (97.3%) | 16 (2.7%) |
| Total (Overall) | 2,462 (55.3%) | 1,988 (44.7%) |
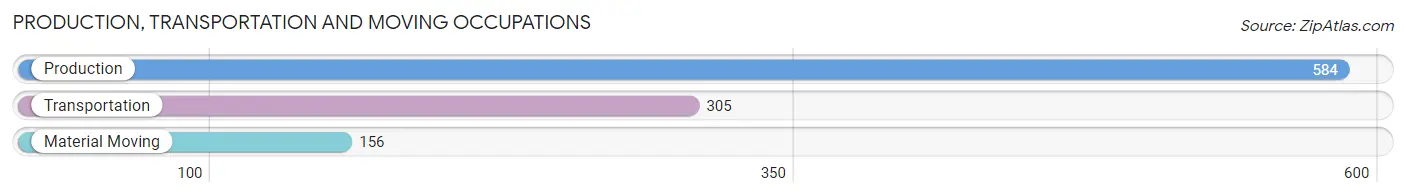
Production, Transportation and Moving Occupations
The most common Production, Transportation and Moving occupations in Delavan are Production (584 | 13.1%), Transportation (305 | 6.9%), and Material Moving (156 | 3.5%).
Production, Transportation and Moving Occupations by Sex
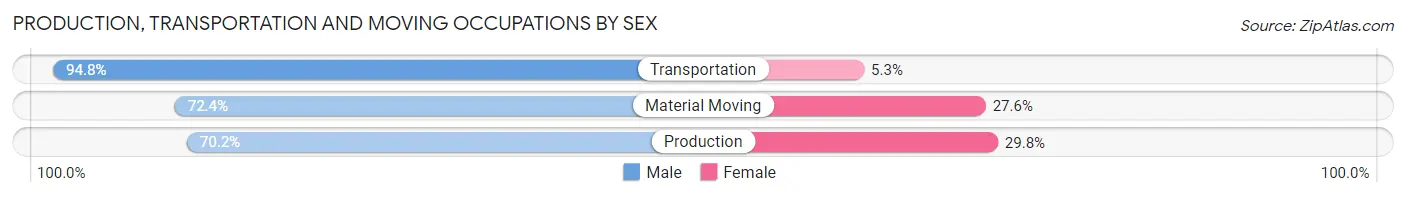
| Occupation | Male | Female |
| Production | 410 (70.2%) | 174 (29.8%) |
| Transportation | 289 (94.8%) | 16 (5.2%) |
| Material Moving | 113 (72.4%) | 43 (27.6%) |
| Total (Category) | 812 (77.7%) | 233 (22.3%) |
| Total (Overall) | 2,462 (55.3%) | 1,988 (44.7%) |
Employment Industries by Sex in Delavan
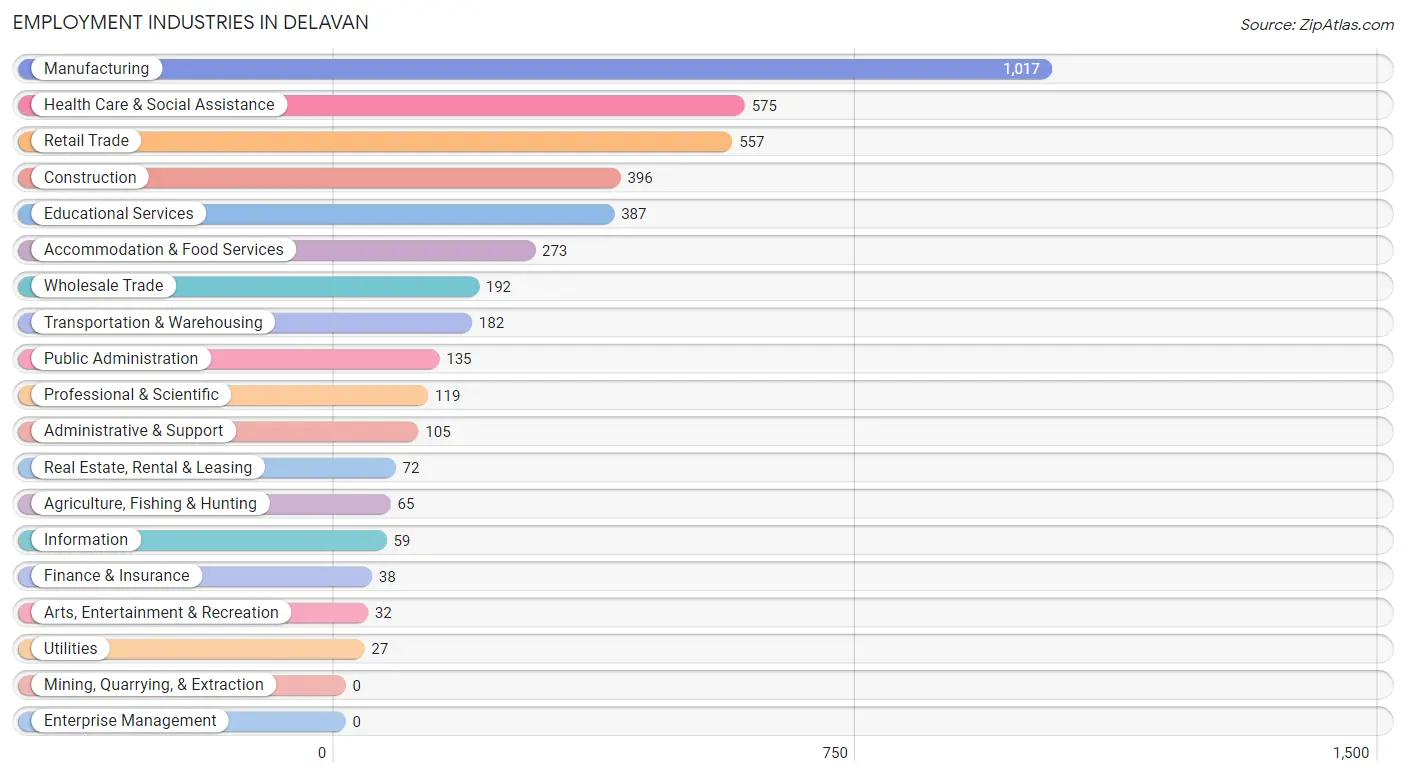
Employment Industries in Delavan
The major employment industries in Delavan include Manufacturing (1,017 | 22.9%), Health Care & Social Assistance (575 | 12.9%), Retail Trade (557 | 12.5%), Construction (396 | 8.9%), and Educational Services (387 | 8.7%).
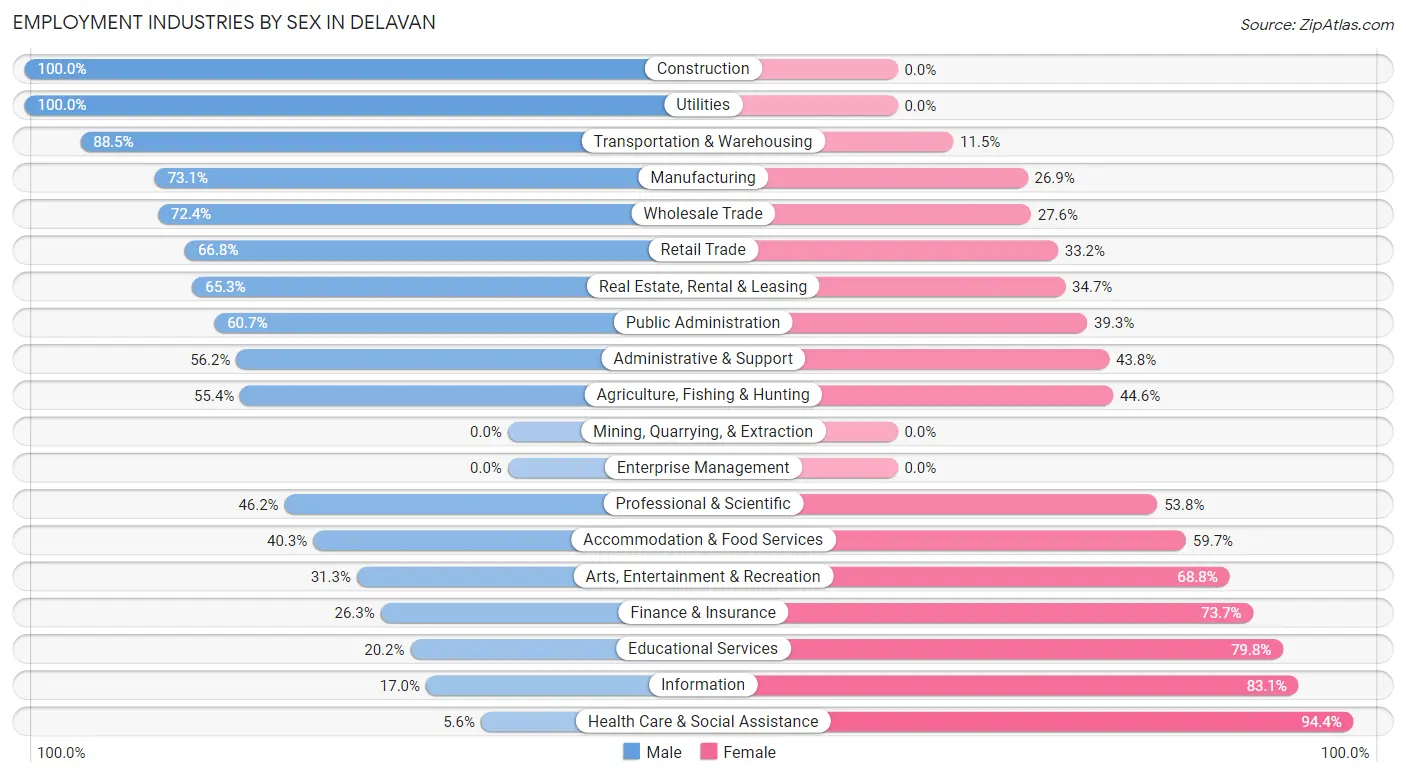
Employment Industries by Sex in Delavan
The Delavan industries that see more men than women are Construction (100.0%), Utilities (100.0%), and Transportation & Warehousing (88.5%), whereas the industries that tend to have a higher number of women are Health Care & Social Assistance (94.4%), Information (83.1%), and Educational Services (79.8%).
| Industry | Male | Female |
| Agriculture, Fishing & Hunting | 36 (55.4%) | 29 (44.6%) |
| Mining, Quarrying, & Extraction | 0 (0.0%) | 0 (0.0%) |
| Construction | 396 (100.0%) | 0 (0.0%) |
| Manufacturing | 743 (73.1%) | 274 (26.9%) |
| Wholesale Trade | 139 (72.4%) | 53 (27.6%) |
| Retail Trade | 372 (66.8%) | 185 (33.2%) |
| Transportation & Warehousing | 161 (88.5%) | 21 (11.5%) |
| Utilities | 27 (100.0%) | 0 (0.0%) |
| Information | 10 (17.0%) | 49 (83.1%) |
| Finance & Insurance | 10 (26.3%) | 28 (73.7%) |
| Real Estate, Rental & Leasing | 47 (65.3%) | 25 (34.7%) |
| Professional & Scientific | 55 (46.2%) | 64 (53.8%) |
| Enterprise Management | 0 (0.0%) | 0 (0.0%) |
| Administrative & Support | 59 (56.2%) | 46 (43.8%) |
| Educational Services | 78 (20.2%) | 309 (79.8%) |
| Health Care & Social Assistance | 32 (5.6%) | 543 (94.4%) |
| Arts, Entertainment & Recreation | 10 (31.2%) | 22 (68.8%) |
| Accommodation & Food Services | 110 (40.3%) | 163 (59.7%) |
| Public Administration | 82 (60.7%) | 53 (39.3%) |
| Total | 2,462 (55.3%) | 1,988 (44.7%) |
Education in Delavan
School Enrollment in Delavan
The most common levels of schooling among the 2,111 students in Delavan are middle school (553 | 26.2%), high school (484 | 22.9%), and elementary school (437 | 20.7%).
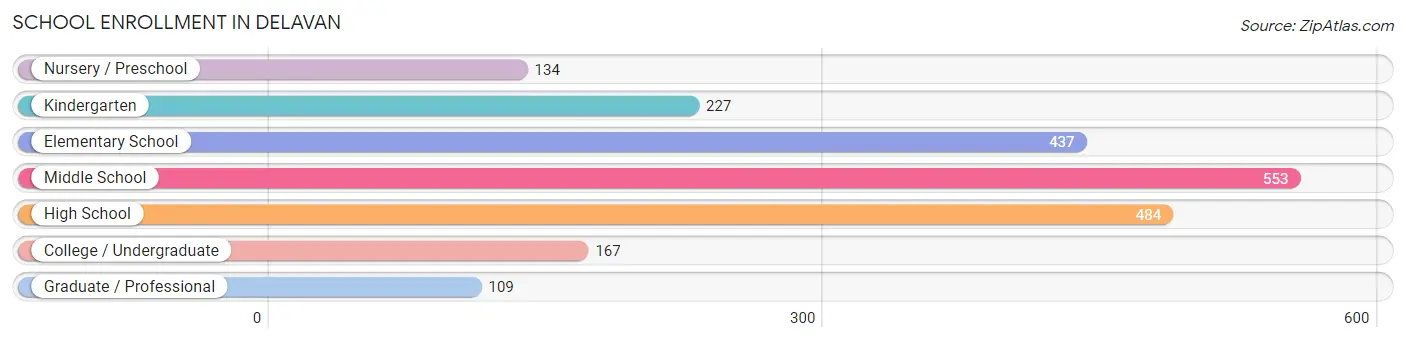
| School Level | # Students | % Students |
| Nursery / Preschool | 134 | 6.4% |
| Kindergarten | 227 | 10.7% |
| Elementary School | 437 | 20.7% |
| Middle School | 553 | 26.2% |
| High School | 484 | 22.9% |
| College / Undergraduate | 167 | 7.9% |
| Graduate / Professional | 109 | 5.2% |
| Total | 2,111 | 100.0% |
School Enrollment by Age by Funding Source in Delavan
Out of a total of 2,111 students who are enrolled in schools in Delavan, 338 (16.0%) attend a private institution, while the remaining 1,773 (84.0%) are enrolled in public schools. The age group of 20 to 24 year olds has the highest likelihood of being enrolled in private schools, with 53 (37.9% in the age bracket) enrolled. Conversely, the age group of 3 to 4 year olds has the lowest likelihood of being enrolled in a private school, with 90 (100.0% in the age bracket) attending a public institution.
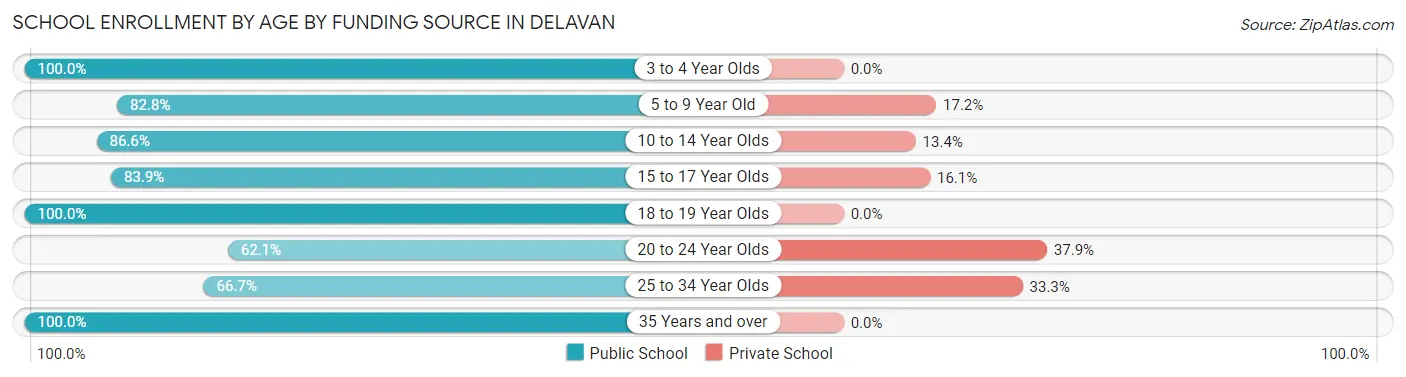
| Age Bracket | Public School | Private School |
| 3 to 4 Year Olds | 90 (100.0%) | 0 (0.0%) |
| 5 to 9 Year Old | 553 (82.8%) | 115 (17.2%) |
| 10 to 14 Year Olds | 497 (86.6%) | 77 (13.4%) |
| 15 to 17 Year Olds | 318 (83.9%) | 61 (16.1%) |
| 18 to 19 Year Olds | 58 (100.0%) | 0 (0.0%) |
| 20 to 24 Year Olds | 87 (62.1%) | 53 (37.9%) |
| 25 to 34 Year Olds | 64 (66.7%) | 32 (33.3%) |
| 35 Years and over | 106 (100.0%) | 0 (0.0%) |
| Total | 1,773 (84.0%) | 338 (16.0%) |
Educational Attainment by Field of Study in Delavan
Business (334 | 19.3%), education (315 | 18.2%), science & technology (182 | 10.5%), arts & humanities (142 | 8.2%), and social sciences (134 | 7.7%) are the most common fields of study among 1,731 individuals in Delavan who have obtained a bachelor's degree or higher.
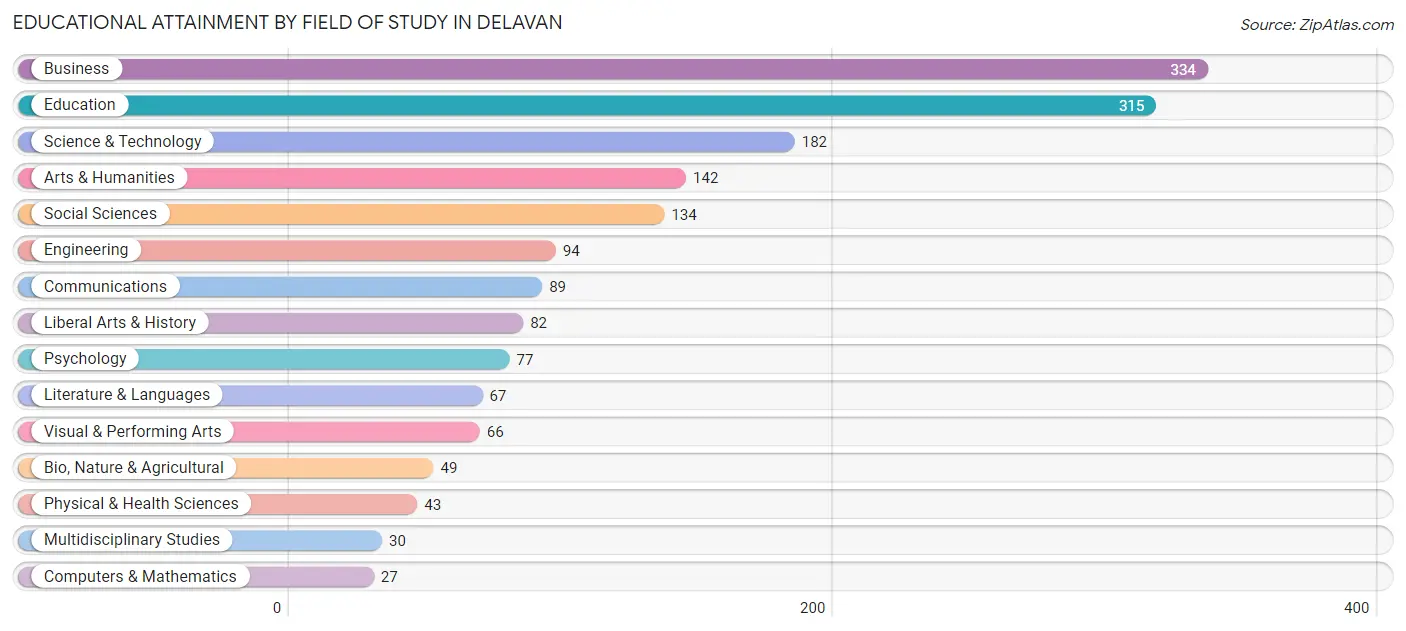
| Field of Study | # Graduates | % Graduates |
| Computers & Mathematics | 27 | 1.6% |
| Bio, Nature & Agricultural | 49 | 2.8% |
| Physical & Health Sciences | 43 | 2.5% |
| Psychology | 77 | 4.4% |
| Social Sciences | 134 | 7.7% |
| Engineering | 94 | 5.4% |
| Multidisciplinary Studies | 30 | 1.7% |
| Science & Technology | 182 | 10.5% |
| Business | 334 | 19.3% |
| Education | 315 | 18.2% |
| Literature & Languages | 67 | 3.9% |
| Liberal Arts & History | 82 | 4.7% |
| Visual & Performing Arts | 66 | 3.8% |
| Communications | 89 | 5.1% |
| Arts & Humanities | 142 | 8.2% |
| Total | 1,731 | 100.0% |
Transportation & Commute in Delavan
Vehicle Availability by Sex in Delavan
The most prevalent vehicle ownership categories in Delavan are males with 2 vehicles (1,136, accounting for 46.6%) and females with 2 vehicles (762, making up 59.1%).
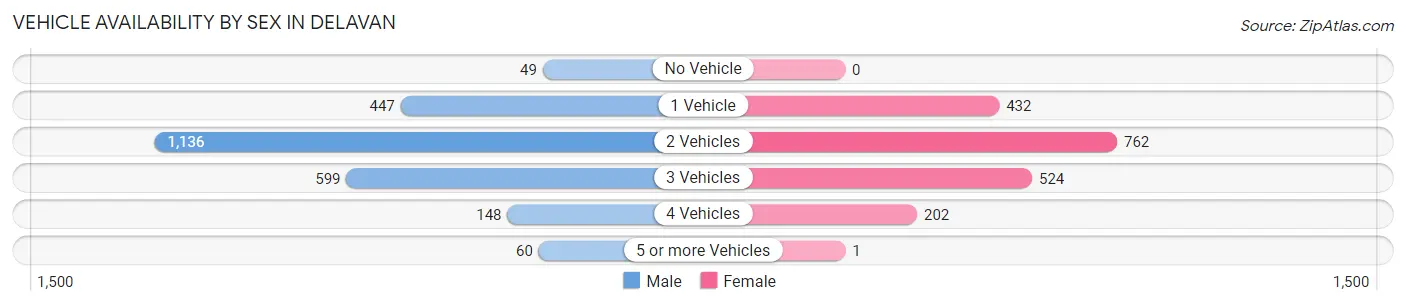
| Vehicles Available | Male | Female |
| No Vehicle | 49 (2.0%) | 0 (0.0%) |
| 1 Vehicle | 447 (18.3%) | 432 (22.5%) |
| 2 Vehicles | 1,136 (46.6%) | 762 (39.7%) |
| 3 Vehicles | 599 (24.6%) | 524 (27.3%) |
| 4 Vehicles | 148 (6.1%) | 202 (10.5%) |
| 5 or more Vehicles | 60 (2.5%) | 1 (0.1%) |
| Total | 2,439 (100.0%) | 1,921 (100.0%) |
Commute Time in Delavan
The most frequently occuring commute durations in Delavan are 10 to 14 minutes (848 commuters, 20.5%), 5 to 9 minutes (786 commuters, 19.1%), and 15 to 19 minutes (445 commuters, 10.8%).
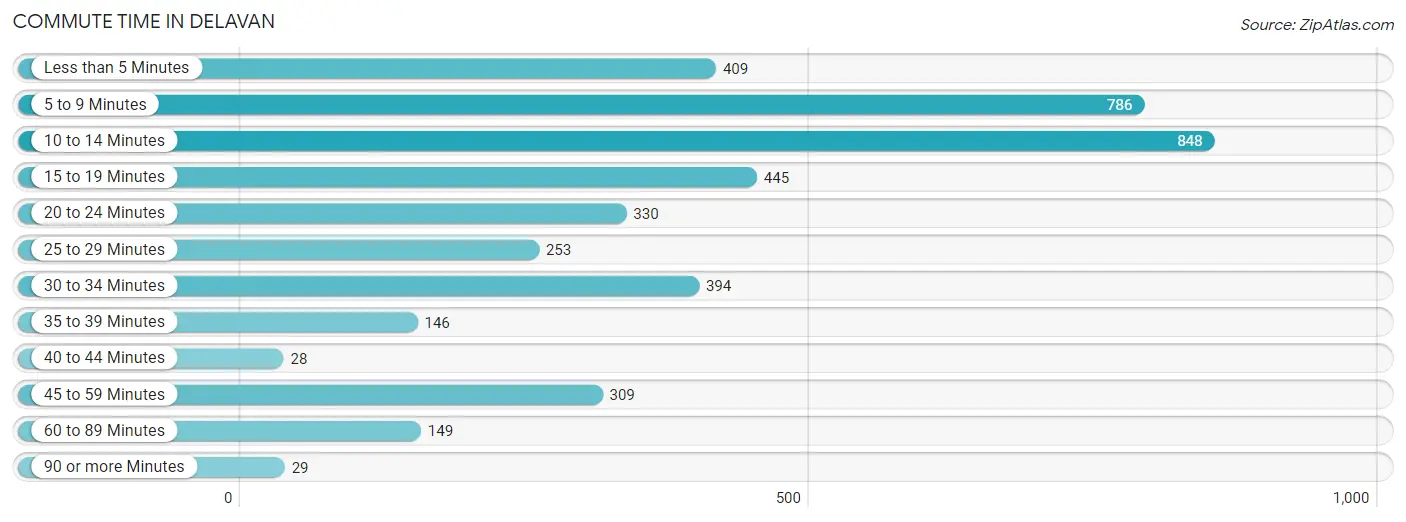
| Commute Time | # Commuters | % Commuters |
| Less than 5 Minutes | 409 | 9.9% |
| 5 to 9 Minutes | 786 | 19.1% |
| 10 to 14 Minutes | 848 | 20.5% |
| 15 to 19 Minutes | 445 | 10.8% |
| 20 to 24 Minutes | 330 | 8.0% |
| 25 to 29 Minutes | 253 | 6.1% |
| 30 to 34 Minutes | 394 | 9.6% |
| 35 to 39 Minutes | 146 | 3.5% |
| 40 to 44 Minutes | 28 | 0.7% |
| 45 to 59 Minutes | 309 | 7.5% |
| 60 to 89 Minutes | 149 | 3.6% |
| 90 or more Minutes | 29 | 0.7% |
Commute Time by Sex in Delavan
The most common commute times in Delavan are 10 to 14 minutes (521 commuters, 22.6%) for males and 5 to 9 minutes (475 commuters, 26.1%) for females.
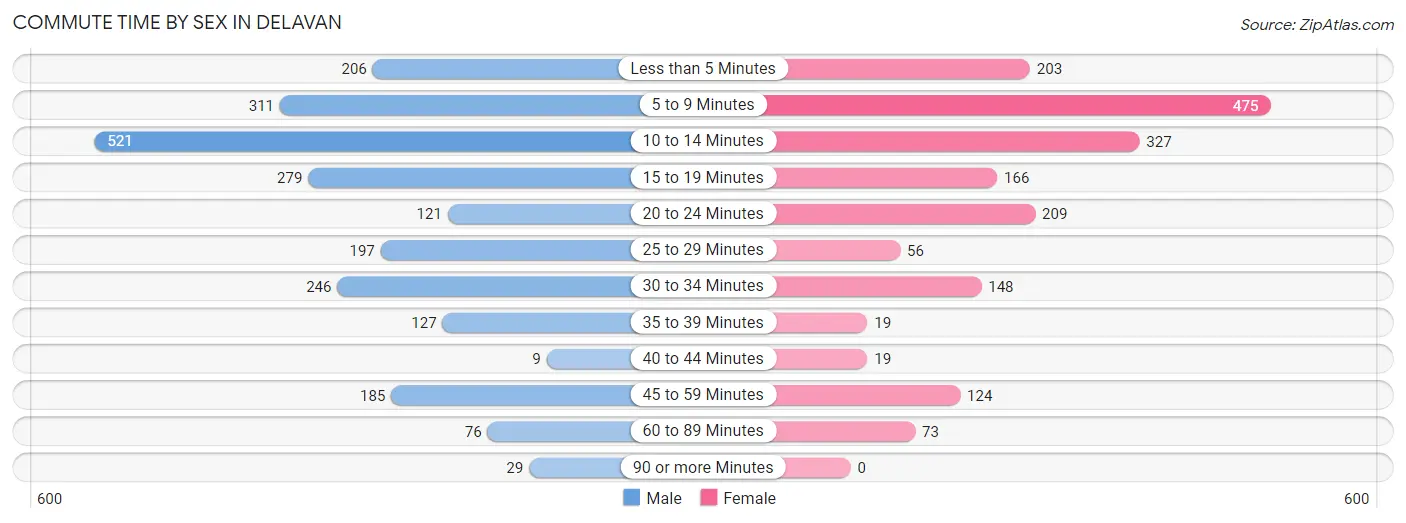
| Commute Time | Male | Female |
| Less than 5 Minutes | 206 (8.9%) | 203 (11.2%) |
| 5 to 9 Minutes | 311 (13.5%) | 475 (26.1%) |
| 10 to 14 Minutes | 521 (22.6%) | 327 (18.0%) |
| 15 to 19 Minutes | 279 (12.1%) | 166 (9.1%) |
| 20 to 24 Minutes | 121 (5.2%) | 209 (11.5%) |
| 25 to 29 Minutes | 197 (8.5%) | 56 (3.1%) |
| 30 to 34 Minutes | 246 (10.7%) | 148 (8.1%) |
| 35 to 39 Minutes | 127 (5.5%) | 19 (1.0%) |
| 40 to 44 Minutes | 9 (0.4%) | 19 (1.0%) |
| 45 to 59 Minutes | 185 (8.0%) | 124 (6.8%) |
| 60 to 89 Minutes | 76 (3.3%) | 73 (4.0%) |
| 90 or more Minutes | 29 (1.3%) | 0 (0.0%) |
Time of Departure to Work by Sex in Delavan
The most frequent times of departure to work in Delavan are 6:30 AM to 6:59 AM (393, 17.0%) for males and 7:00 AM to 7:29 AM (349, 19.2%) for females.
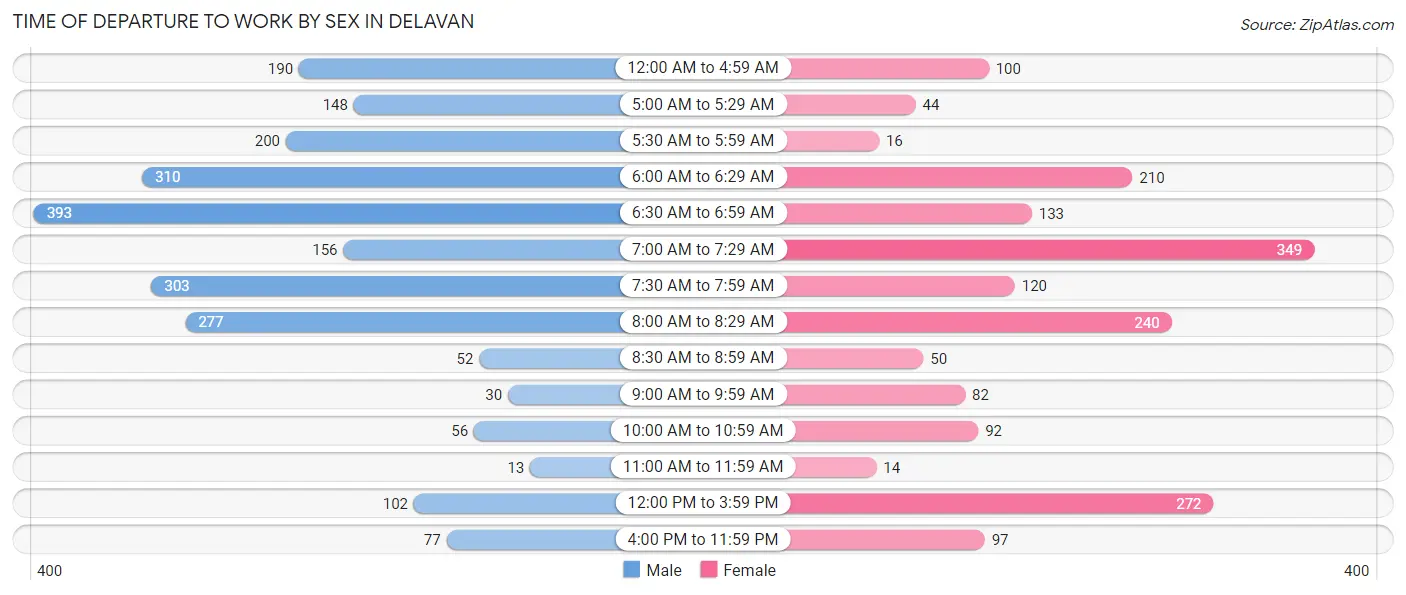
| Time of Departure | Male | Female |
| 12:00 AM to 4:59 AM | 190 (8.2%) | 100 (5.5%) |
| 5:00 AM to 5:29 AM | 148 (6.4%) | 44 (2.4%) |
| 5:30 AM to 5:59 AM | 200 (8.7%) | 16 (0.9%) |
| 6:00 AM to 6:29 AM | 310 (13.4%) | 210 (11.5%) |
| 6:30 AM to 6:59 AM | 393 (17.0%) | 133 (7.3%) |
| 7:00 AM to 7:29 AM | 156 (6.8%) | 349 (19.2%) |
| 7:30 AM to 7:59 AM | 303 (13.1%) | 120 (6.6%) |
| 8:00 AM to 8:29 AM | 277 (12.0%) | 240 (13.2%) |
| 8:30 AM to 8:59 AM | 52 (2.2%) | 50 (2.8%) |
| 9:00 AM to 9:59 AM | 30 (1.3%) | 82 (4.5%) |
| 10:00 AM to 10:59 AM | 56 (2.4%) | 92 (5.1%) |
| 11:00 AM to 11:59 AM | 13 (0.6%) | 14 (0.8%) |
| 12:00 PM to 3:59 PM | 102 (4.4%) | 272 (14.9%) |
| 4:00 PM to 11:59 PM | 77 (3.3%) | 97 (5.3%) |
| Total | 2,307 (100.0%) | 1,819 (100.0%) |
Housing Occupancy in Delavan
Occupancy by Ownership in Delavan
Of the total 3,539 dwellings in Delavan, owner-occupied units account for 2,169 (61.3%), while renter-occupied units make up 1,370 (38.7%).
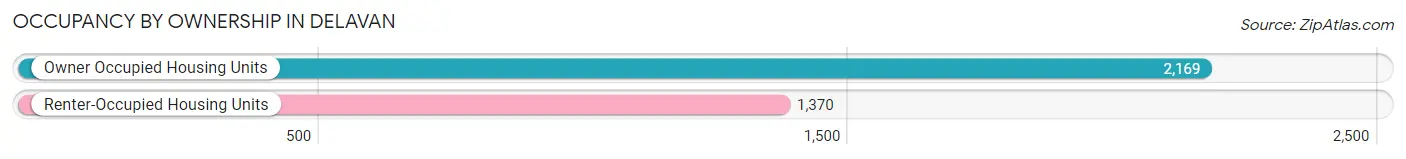
| Occupancy | # Housing Units | % Housing Units |
| Owner Occupied Housing Units | 2,169 | 61.3% |
| Renter-Occupied Housing Units | 1,370 | 38.7% |
| Total Occupied Housing Units | 3,539 | 100.0% |
Occupancy by Household Size in Delavan
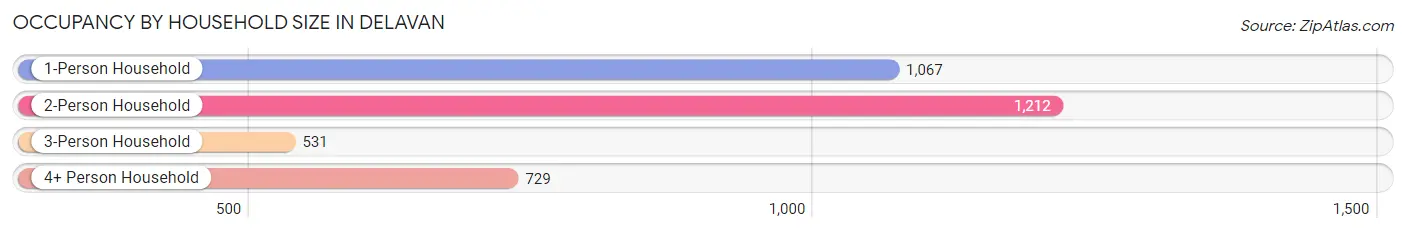
| Household Size | # Housing Units | % Housing Units |
| 1-Person Household | 1,067 | 30.1% |
| 2-Person Household | 1,212 | 34.3% |
| 3-Person Household | 531 | 15.0% |
| 4+ Person Household | 729 | 20.6% |
| Total Housing Units | 3,539 | 100.0% |
Occupancy by Ownership by Household Size in Delavan
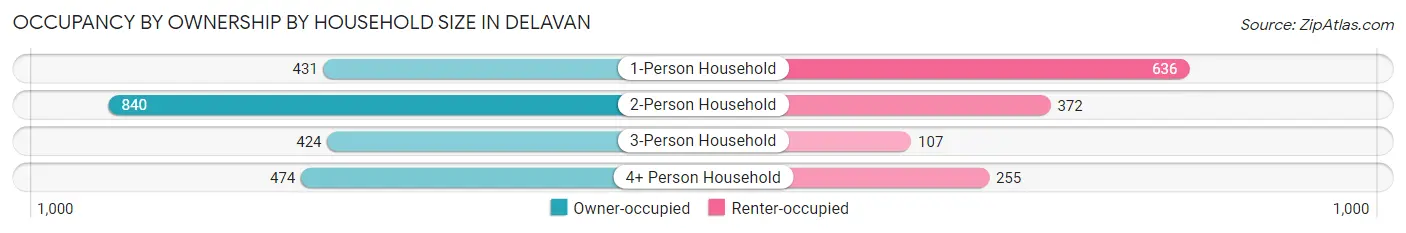
| Household Size | Owner-occupied | Renter-occupied |
| 1-Person Household | 431 (40.4%) | 636 (59.6%) |
| 2-Person Household | 840 (69.3%) | 372 (30.7%) |
| 3-Person Household | 424 (79.8%) | 107 (20.2%) |
| 4+ Person Household | 474 (65.0%) | 255 (35.0%) |
| Total Housing Units | 2,169 (61.3%) | 1,370 (38.7%) |
Occupancy by Educational Attainment in Delavan
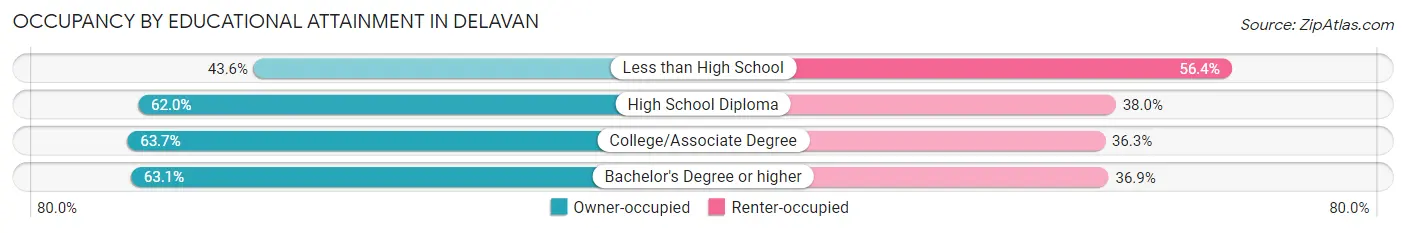
| Household Size | Owner-occupied | Renter-occupied |
| Less than High School | 127 (43.6%) | 164 (56.4%) |
| High School Diploma | 793 (62.0%) | 486 (38.0%) |
| College/Associate Degree | 646 (63.7%) | 368 (36.3%) |
| Bachelor's Degree or higher | 603 (63.1%) | 352 (36.9%) |
Occupancy by Age of Householder in Delavan
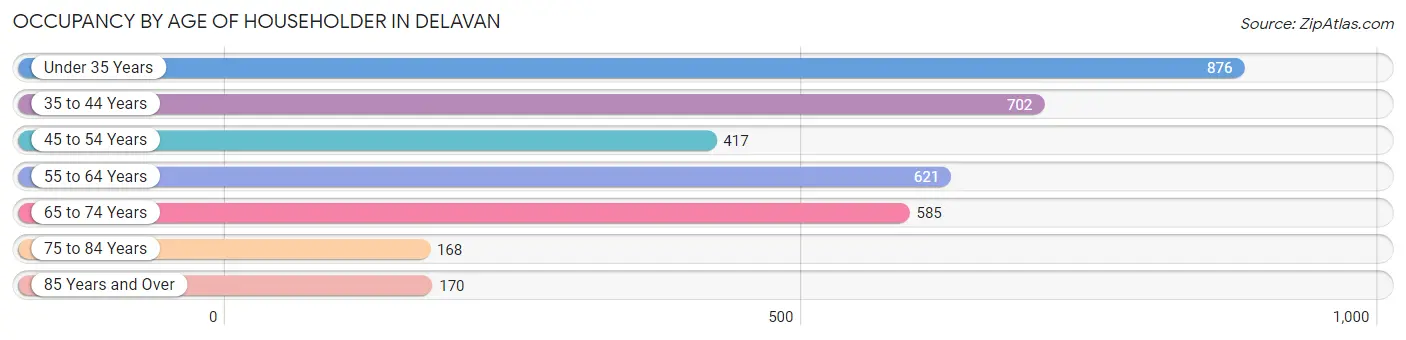
| Age Bracket | # Households | % Households |
| Under 35 Years | 876 | 24.7% |
| 35 to 44 Years | 702 | 19.8% |
| 45 to 54 Years | 417 | 11.8% |
| 55 to 64 Years | 621 | 17.5% |
| 65 to 74 Years | 585 | 16.5% |
| 75 to 84 Years | 168 | 4.8% |
| 85 Years and Over | 170 | 4.8% |
| Total | 3,539 | 100.0% |
Housing Finances in Delavan
Median Income by Occupancy in Delavan
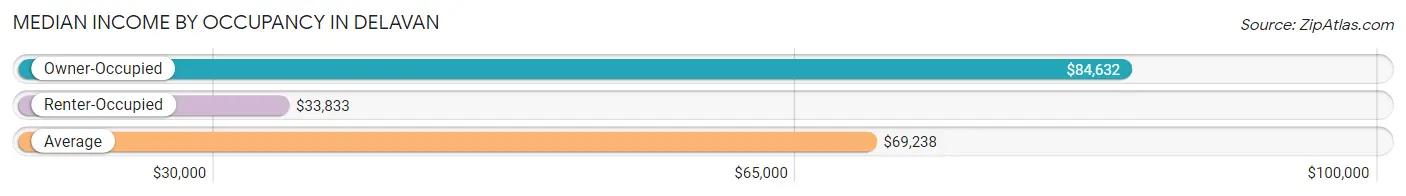
| Occupancy Type | # Households | Median Income |
| Owner-Occupied | 2,169 (61.3%) | $84,632 |
| Renter-Occupied | 1,370 (38.7%) | $33,833 |
| Average | 3,539 (100.0%) | $69,238 |
Occupancy by Householder Income Bracket in Delavan
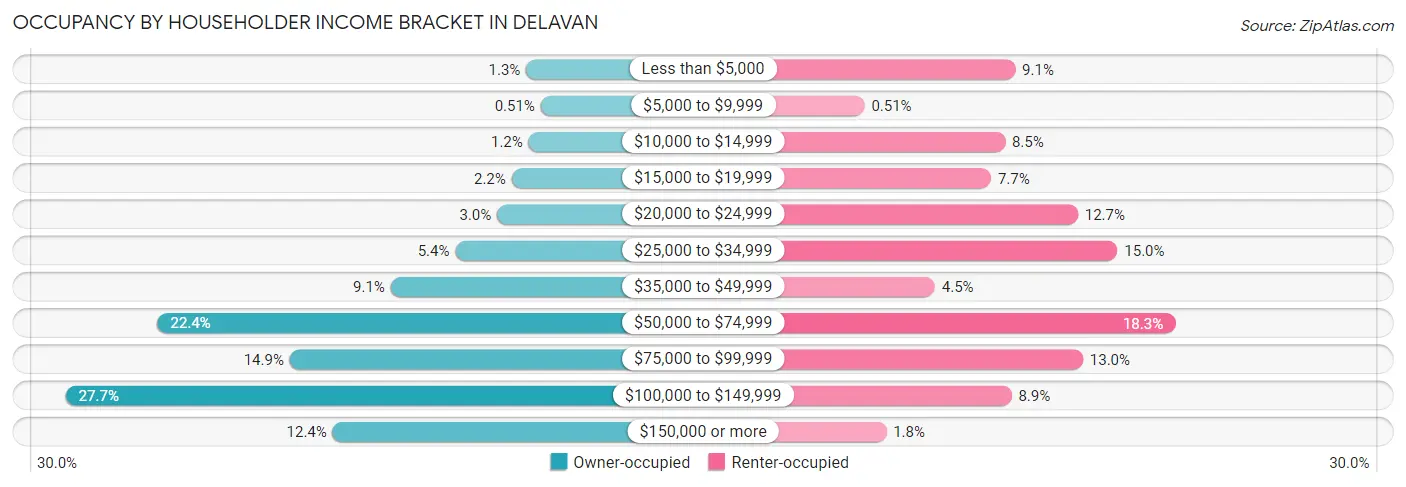
| Income Bracket | Owner-occupied | Renter-occupied |
| Less than $5,000 | 29 (1.3%) | 125 (9.1%) |
| $5,000 to $9,999 | 11 (0.5%) | 7 (0.5%) |
| $10,000 to $14,999 | 26 (1.2%) | 117 (8.5%) |
| $15,000 to $19,999 | 47 (2.2%) | 106 (7.7%) |
| $20,000 to $24,999 | 65 (3.0%) | 174 (12.7%) |
| $25,000 to $34,999 | 117 (5.4%) | 205 (15.0%) |
| $35,000 to $49,999 | 197 (9.1%) | 62 (4.5%) |
| $50,000 to $74,999 | 486 (22.4%) | 250 (18.2%) |
| $75,000 to $99,999 | 322 (14.8%) | 178 (13.0%) |
| $100,000 to $149,999 | 600 (27.7%) | 122 (8.9%) |
| $150,000 or more | 269 (12.4%) | 24 (1.8%) |
| Total | 2,169 (100.0%) | 1,370 (100.0%) |
Monthly Housing Cost Tiers in Delavan
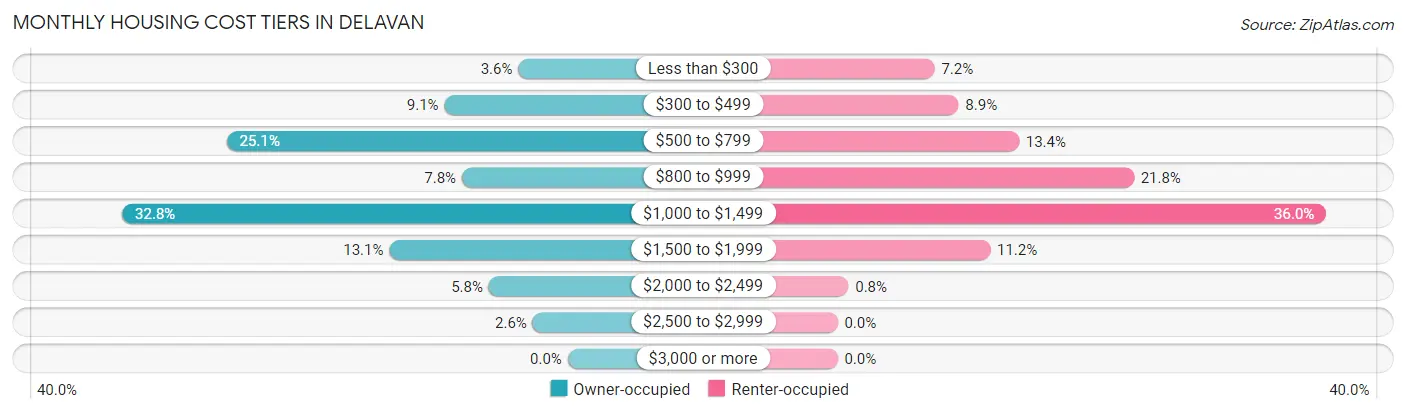
| Monthly Cost | Owner-occupied | Renter-occupied |
| Less than $300 | 79 (3.6%) | 98 (7.1%) |
| $300 to $499 | 197 (9.1%) | 122 (8.9%) |
| $500 to $799 | 545 (25.1%) | 183 (13.4%) |
| $800 to $999 | 169 (7.8%) | 299 (21.8%) |
| $1,000 to $1,499 | 712 (32.8%) | 493 (36.0%) |
| $1,500 to $1,999 | 285 (13.1%) | 154 (11.2%) |
| $2,000 to $2,499 | 126 (5.8%) | 11 (0.8%) |
| $2,500 to $2,999 | 56 (2.6%) | 0 (0.0%) |
| $3,000 or more | 0 (0.0%) | 0 (0.0%) |
| Total | 2,169 (100.0%) | 1,370 (100.0%) |
Physical Housing Characteristics in Delavan
Housing Structures in Delavan
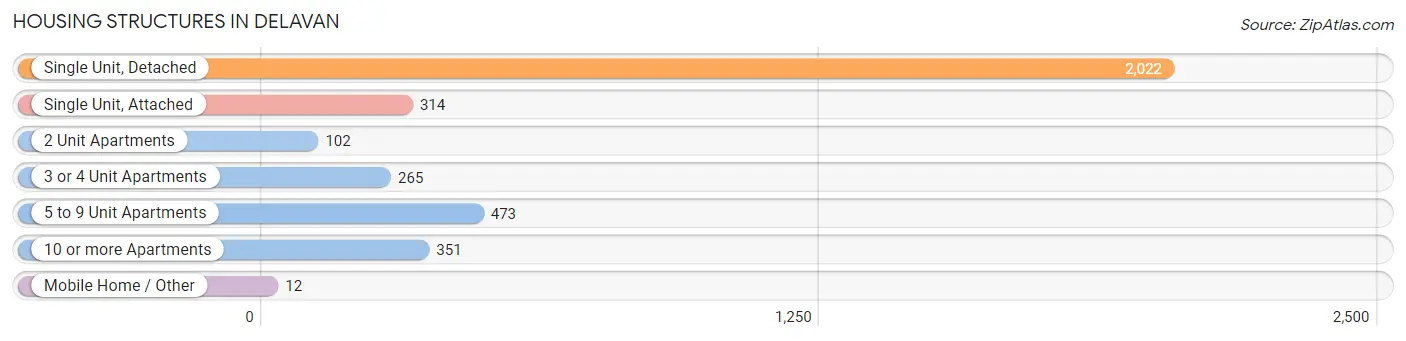
| Structure Type | # Housing Units | % Housing Units |
| Single Unit, Detached | 2,022 | 57.1% |
| Single Unit, Attached | 314 | 8.9% |
| 2 Unit Apartments | 102 | 2.9% |
| 3 or 4 Unit Apartments | 265 | 7.5% |
| 5 to 9 Unit Apartments | 473 | 13.4% |
| 10 or more Apartments | 351 | 9.9% |
| Mobile Home / Other | 12 | 0.3% |
| Total | 3,539 | 100.0% |
Housing Structures by Occupancy in Delavan
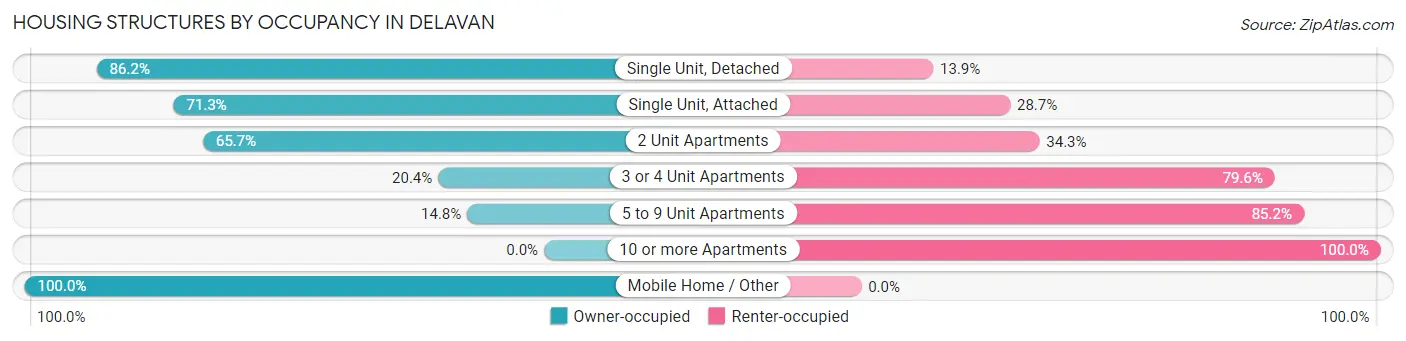
| Structure Type | Owner-occupied | Renter-occupied |
| Single Unit, Detached | 1,742 (86.2%) | 280 (13.9%) |
| Single Unit, Attached | 224 (71.3%) | 90 (28.7%) |
| 2 Unit Apartments | 67 (65.7%) | 35 (34.3%) |
| 3 or 4 Unit Apartments | 54 (20.4%) | 211 (79.6%) |
| 5 to 9 Unit Apartments | 70 (14.8%) | 403 (85.2%) |
| 10 or more Apartments | 0 (0.0%) | 351 (100.0%) |
| Mobile Home / Other | 12 (100.0%) | 0 (0.0%) |
| Total | 2,169 (61.3%) | 1,370 (38.7%) |
Housing Structures by Number of Rooms in Delavan
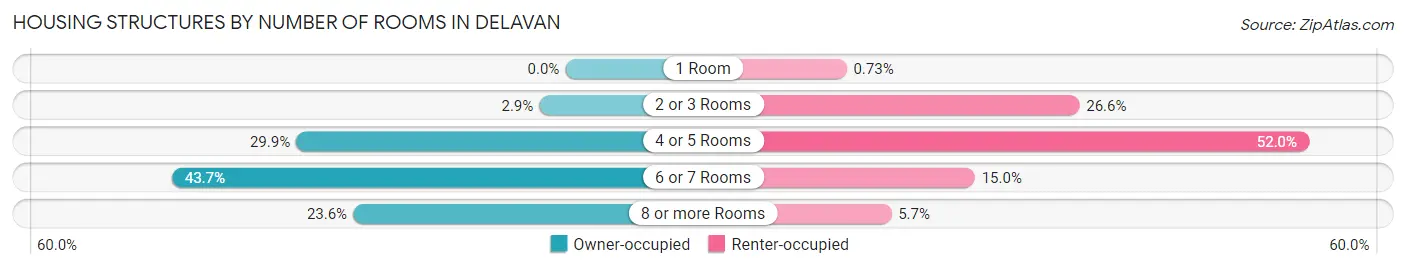
| Number of Rooms | Owner-occupied | Renter-occupied |
| 1 Room | 0 (0.0%) | 10 (0.7%) |
| 2 or 3 Rooms | 63 (2.9%) | 364 (26.6%) |
| 4 or 5 Rooms | 648 (29.9%) | 713 (52.0%) |
| 6 or 7 Rooms | 947 (43.7%) | 205 (15.0%) |
| 8 or more Rooms | 511 (23.6%) | 78 (5.7%) |
| Total | 2,169 (100.0%) | 1,370 (100.0%) |
Housing Structure by Heating Type in Delavan
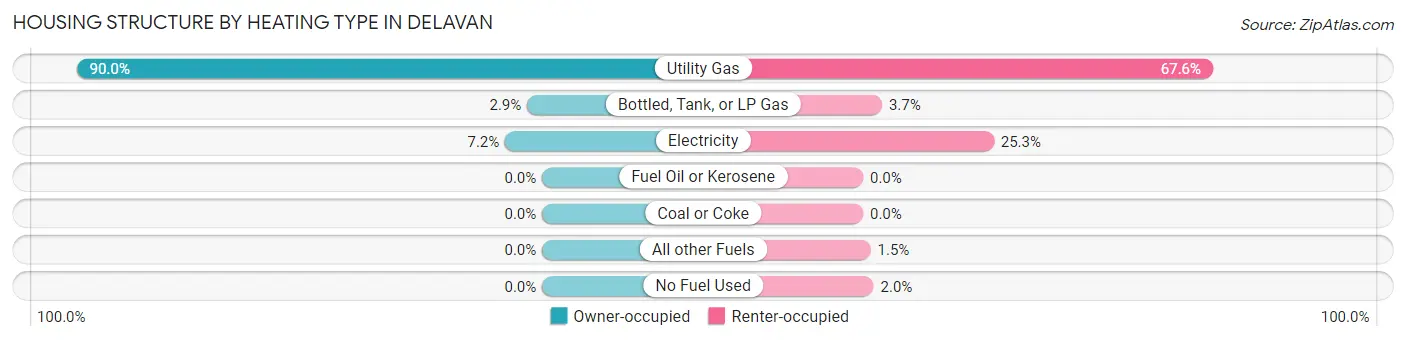
| Heating Type | Owner-occupied | Renter-occupied |
| Utility Gas | 1,951 (89.9%) | 926 (67.6%) |
| Bottled, Tank, or LP Gas | 63 (2.9%) | 50 (3.6%) |
| Electricity | 155 (7.1%) | 346 (25.3%) |
| Fuel Oil or Kerosene | 0 (0.0%) | 0 (0.0%) |
| Coal or Coke | 0 (0.0%) | 0 (0.0%) |
| All other Fuels | 0 (0.0%) | 20 (1.5%) |
| No Fuel Used | 0 (0.0%) | 28 (2.0%) |
| Total | 2,169 (100.0%) | 1,370 (100.0%) |
Household Vehicle Usage in Delavan
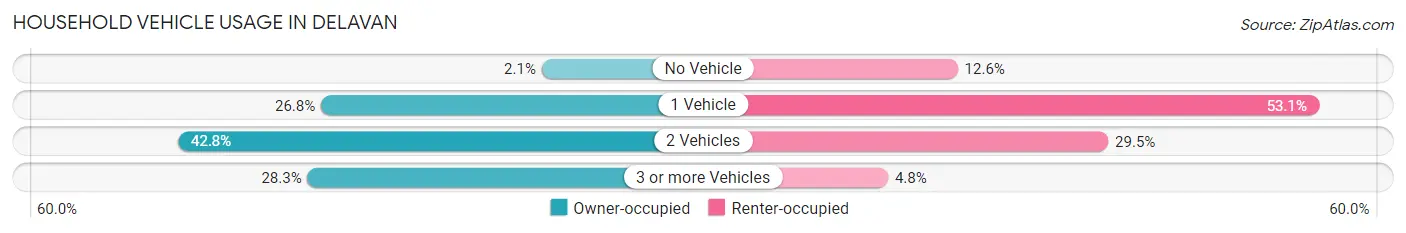
| Vehicles per Household | Owner-occupied | Renter-occupied |
| No Vehicle | 45 (2.1%) | 173 (12.6%) |
| 1 Vehicle | 581 (26.8%) | 727 (53.1%) |
| 2 Vehicles | 929 (42.8%) | 404 (29.5%) |
| 3 or more Vehicles | 614 (28.3%) | 66 (4.8%) |
| Total | 2,169 (100.0%) | 1,370 (100.0%) |
Real Estate & Mortgages in Delavan
Real Estate and Mortgage Overview in Delavan
| Characteristic | Without Mortgage | With Mortgage |
| Housing Units | 889 | 1,280 |
| Median Property Value | $180,000 | $184,000 |
| Median Household Income | $63,326 | $233 |
| Monthly Housing Costs | $613 | $0 |
| Real Estate Taxes | $3,346 | $6 |
Property Value by Mortgage Status in Delavan
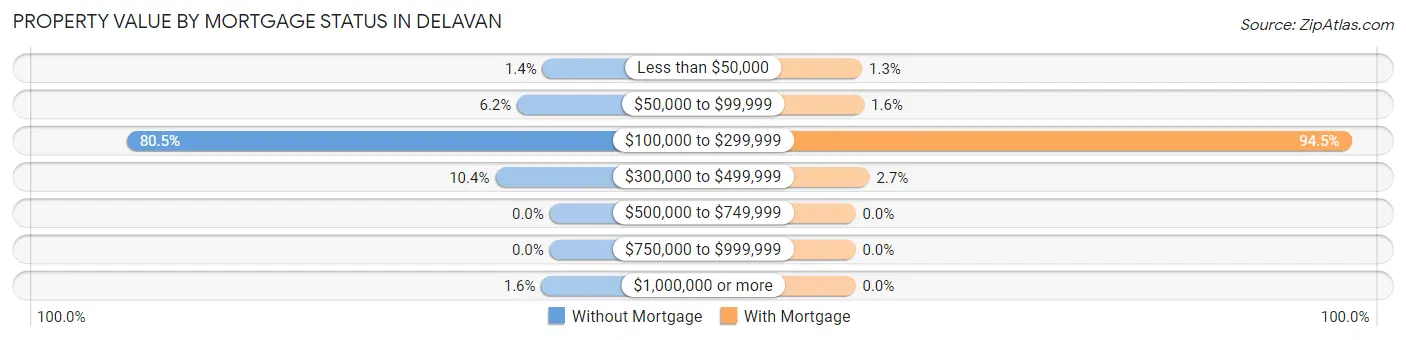
| Property Value | Without Mortgage | With Mortgage |
| Less than $50,000 | 12 (1.3%) | 16 (1.3%) |
| $50,000 to $99,999 | 55 (6.2%) | 21 (1.6%) |
| $100,000 to $299,999 | 716 (80.5%) | 1,209 (94.5%) |
| $300,000 to $499,999 | 92 (10.3%) | 34 (2.7%) |
| $500,000 to $749,999 | 0 (0.0%) | 0 (0.0%) |
| $750,000 to $999,999 | 0 (0.0%) | 0 (0.0%) |
| $1,000,000 or more | 14 (1.6%) | 0 (0.0%) |
| Total | 889 (100.0%) | 1,280 (100.0%) |
Household Income by Mortgage Status in Delavan
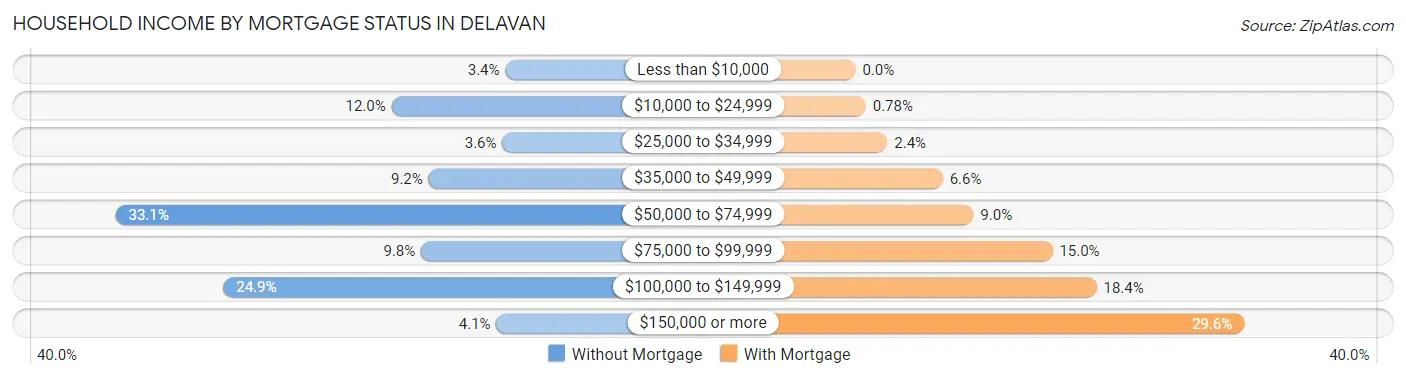
| Household Income | Without Mortgage | With Mortgage |
| Less than $10,000 | 30 (3.4%) | 0 (0.0%) |
| $10,000 to $24,999 | 107 (12.0%) | 10 (0.8%) |
| $25,000 to $34,999 | 32 (3.6%) | 31 (2.4%) |
| $35,000 to $49,999 | 82 (9.2%) | 85 (6.6%) |
| $50,000 to $74,999 | 294 (33.1%) | 115 (9.0%) |
| $75,000 to $99,999 | 87 (9.8%) | 192 (15.0%) |
| $100,000 to $149,999 | 221 (24.9%) | 235 (18.4%) |
| $150,000 or more | 36 (4.1%) | 379 (29.6%) |
| Total | 889 (100.0%) | 1,280 (100.0%) |
Property Value to Household Income Ratio in Delavan
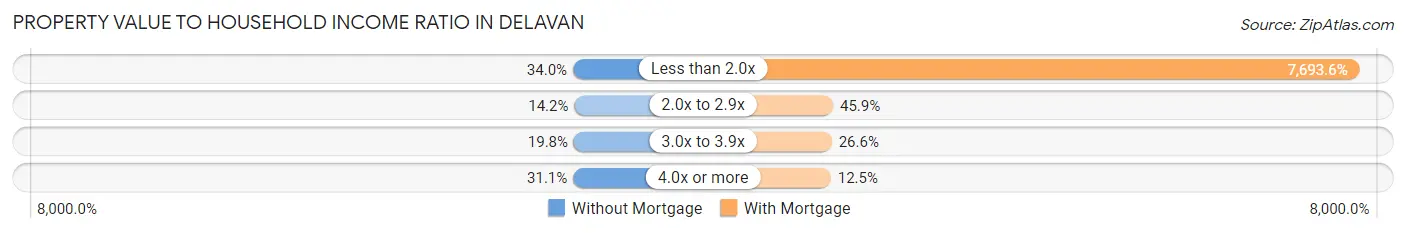
| Value-to-Income Ratio | Without Mortgage | With Mortgage |
| Less than 2.0x | 302 (34.0%) | 98,478 (7,693.6%) |
| 2.0x to 2.9x | 126 (14.2%) | 588 (45.9%) |
| 3.0x to 3.9x | 176 (19.8%) | 340 (26.6%) |
| 4.0x or more | 276 (31.0%) | 160 (12.5%) |
| Total | 889 (100.0%) | 1,280 (100.0%) |
Real Estate Taxes by Mortgage Status in Delavan
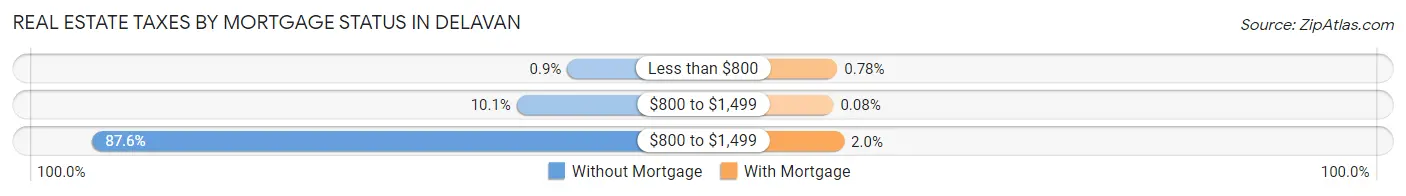
| Property Taxes | Without Mortgage | With Mortgage |
| Less than $800 | 8 (0.9%) | 10 (0.8%) |
| $800 to $1,499 | 90 (10.1%) | 1 (0.1%) |
| $800 to $1,499 | 779 (87.6%) | 26 (2.0%) |
| Total | 889 (100.0%) | 1,280 (100.0%) |
Health & Disability in Delavan
Health Insurance Coverage by Age in Delavan
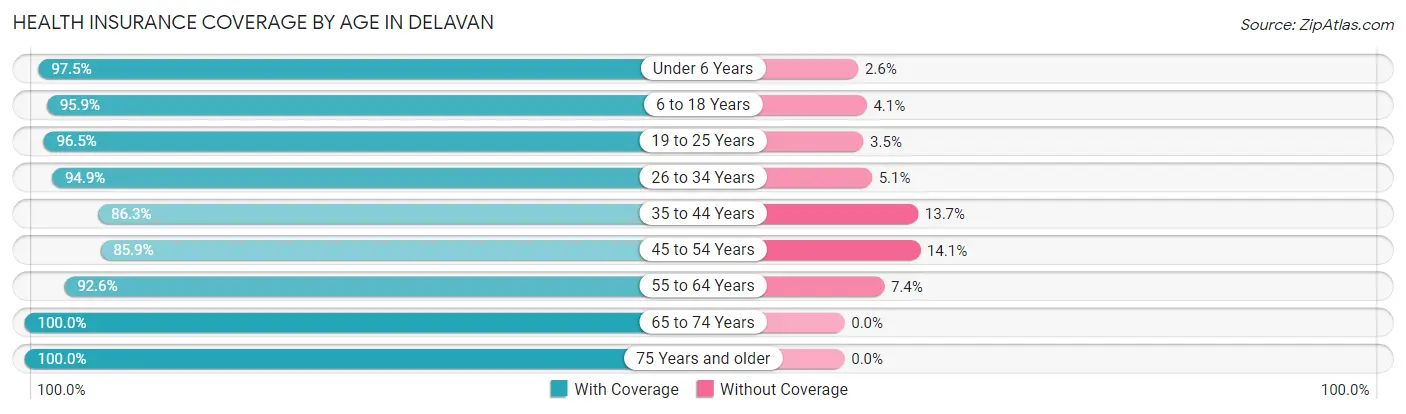
| Age Bracket | With Coverage | Without Coverage |
| Under 6 Years | 420 (97.5%) | 11 (2.5%) |
| 6 to 18 Years | 1,580 (95.9%) | 68 (4.1%) |
| 19 to 25 Years | 740 (96.5%) | 27 (3.5%) |
| 26 to 34 Years | 1,059 (94.9%) | 57 (5.1%) |
| 35 to 44 Years | 1,094 (86.3%) | 174 (13.7%) |
| 45 to 54 Years | 712 (85.9%) | 117 (14.1%) |
| 55 to 64 Years | 1,014 (92.6%) | 81 (7.4%) |
| 65 to 74 Years | 874 (100.0%) | 0 (0.0%) |
| 75 Years and older | 468 (100.0%) | 0 (0.0%) |
| Total | 7,961 (93.7%) | 535 (6.3%) |
Health Insurance Coverage by Citizenship Status in Delavan
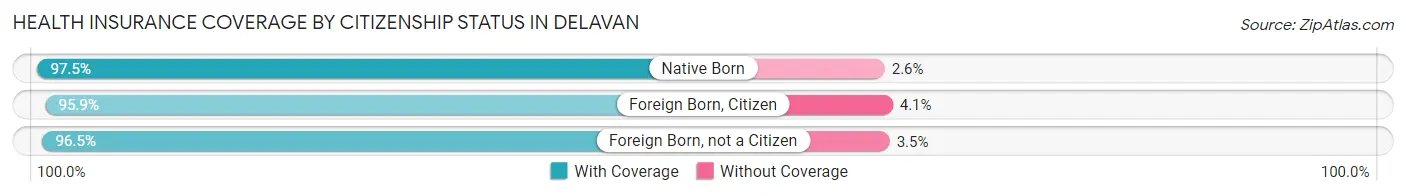
| Citizenship Status | With Coverage | Without Coverage |
| Native Born | 420 (97.5%) | 11 (2.5%) |
| Foreign Born, Citizen | 1,580 (95.9%) | 68 (4.1%) |
| Foreign Born, not a Citizen | 740 (96.5%) | 27 (3.5%) |
Health Insurance Coverage by Household Income in Delavan
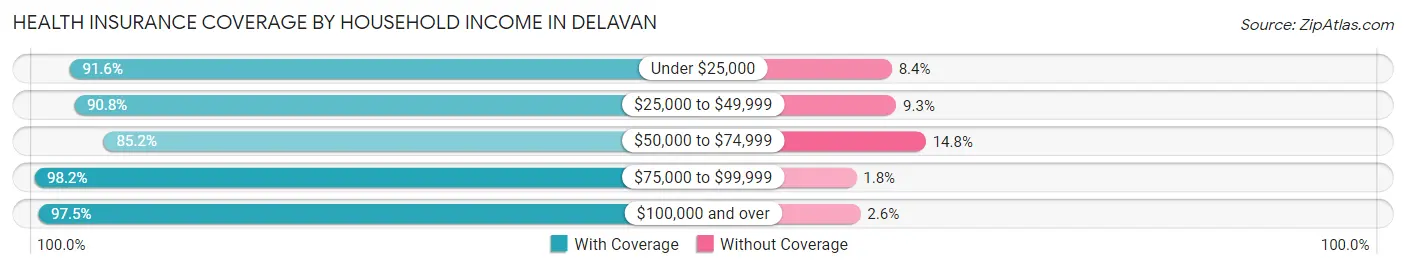
| Household Income | With Coverage | Without Coverage |
| Under $25,000 | 870 (91.6%) | 80 (8.4%) |
| $25,000 to $49,999 | 971 (90.7%) | 99 (9.2%) |
| $50,000 to $74,999 | 1,383 (85.2%) | 240 (14.8%) |
| $75,000 to $99,999 | 1,536 (98.2%) | 28 (1.8%) |
| $100,000 and over | 3,170 (97.5%) | 83 (2.5%) |
Public vs Private Health Insurance Coverage by Age in Delavan
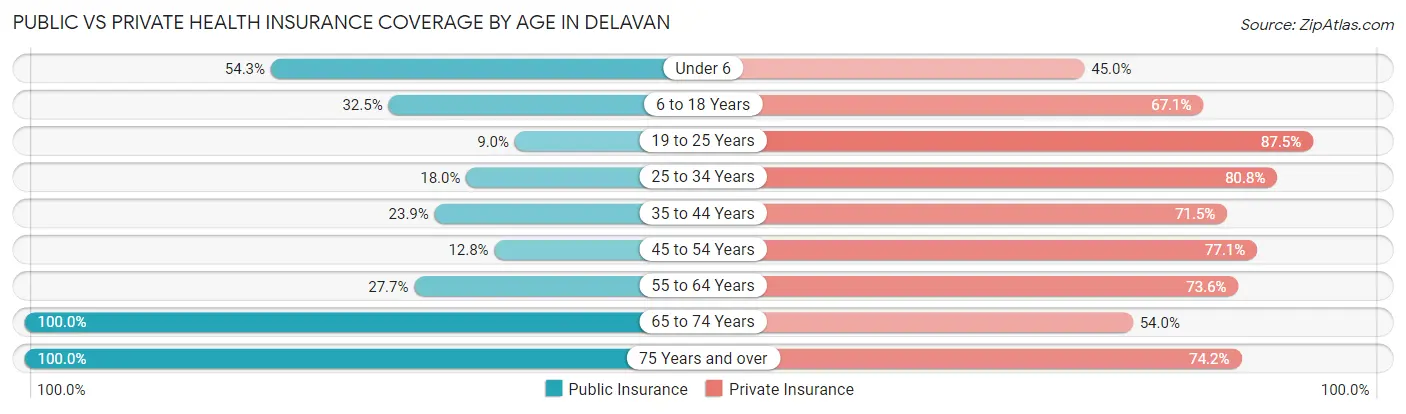
| Age Bracket | Public Insurance | Private Insurance |
| Under 6 | 234 (54.3%) | 194 (45.0%) |
| 6 to 18 Years | 535 (32.5%) | 1,106 (67.1%) |
| 19 to 25 Years | 69 (9.0%) | 671 (87.5%) |
| 25 to 34 Years | 201 (18.0%) | 902 (80.8%) |
| 35 to 44 Years | 303 (23.9%) | 907 (71.5%) |
| 45 to 54 Years | 106 (12.8%) | 639 (77.1%) |
| 55 to 64 Years | 303 (27.7%) | 806 (73.6%) |
| 65 to 74 Years | 874 (100.0%) | 472 (54.0%) |
| 75 Years and over | 468 (100.0%) | 347 (74.2%) |
| Total | 3,093 (36.4%) | 6,044 (71.1%) |
Disability Status by Sex by Age in Delavan
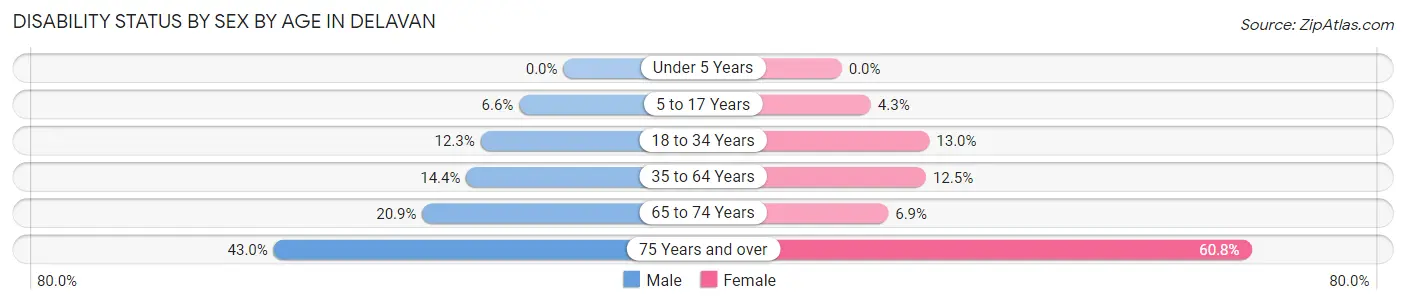
| Age Bracket | Male | Female |
| Under 5 Years | 0 (0.0%) | 0 (0.0%) |
| 5 to 17 Years | 58 (6.6%) | 35 (4.3%) |
| 18 to 34 Years | 133 (12.3%) | 113 (13.0%) |
| 35 to 64 Years | 226 (14.4%) | 203 (12.5%) |
| 65 to 74 Years | 98 (20.9%) | 28 (6.9%) |
| 75 Years and over | 74 (43.0%) | 180 (60.8%) |
Disability Class by Sex by Age in Delavan
Disability Class: Hearing Difficulty
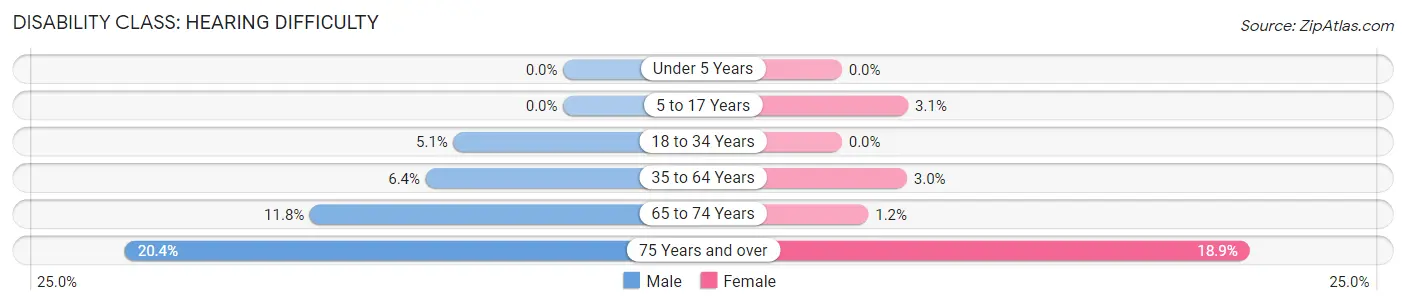
| Age Bracket | Male | Female |
| Under 5 Years | 0 (0.0%) | 0 (0.0%) |
| 5 to 17 Years | 0 (0.0%) | 25 (3.1%) |
| 18 to 34 Years | 55 (5.1%) | 0 (0.0%) |
| 35 to 64 Years | 100 (6.4%) | 49 (3.0%) |
| 65 to 74 Years | 55 (11.7%) | 5 (1.2%) |
| 75 Years and over | 35 (20.3%) | 56 (18.9%) |
Disability Class: Vision Difficulty
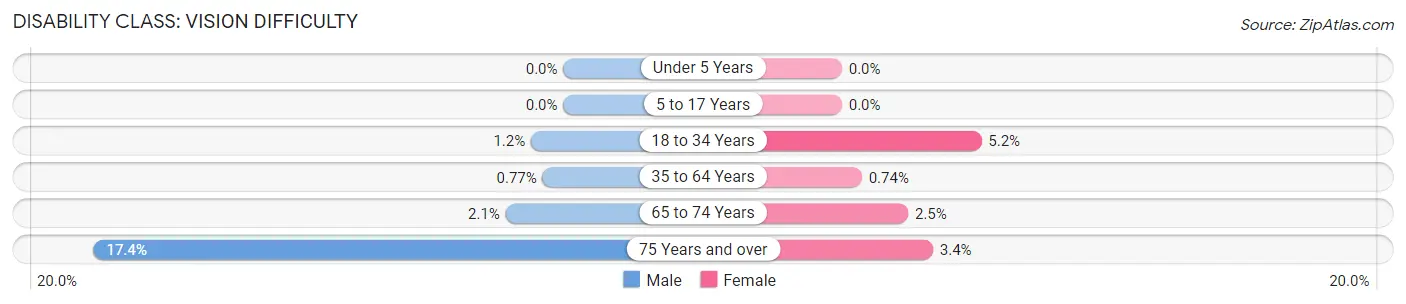
| Age Bracket | Male | Female |
| Under 5 Years | 0 (0.0%) | 0 (0.0%) |
| 5 to 17 Years | 0 (0.0%) | 0 (0.0%) |
| 18 to 34 Years | 13 (1.2%) | 45 (5.2%) |
| 35 to 64 Years | 12 (0.8%) | 12 (0.7%) |
| 65 to 74 Years | 10 (2.1%) | 10 (2.5%) |
| 75 Years and over | 30 (17.4%) | 10 (3.4%) |
Disability Class: Cognitive Difficulty
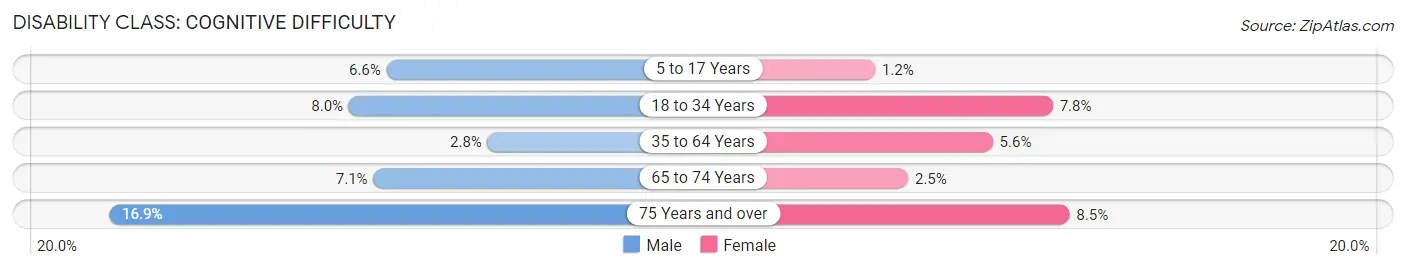
| Age Bracket | Male | Female |
| 5 to 17 Years | 58 (6.6%) | 10 (1.2%) |
| 18 to 34 Years | 86 (8.0%) | 68 (7.8%) |
| 35 to 64 Years | 44 (2.8%) | 91 (5.6%) |
| 65 to 74 Years | 33 (7.0%) | 10 (2.5%) |
| 75 Years and over | 29 (16.9%) | 25 (8.5%) |
Disability Class: Ambulatory Difficulty
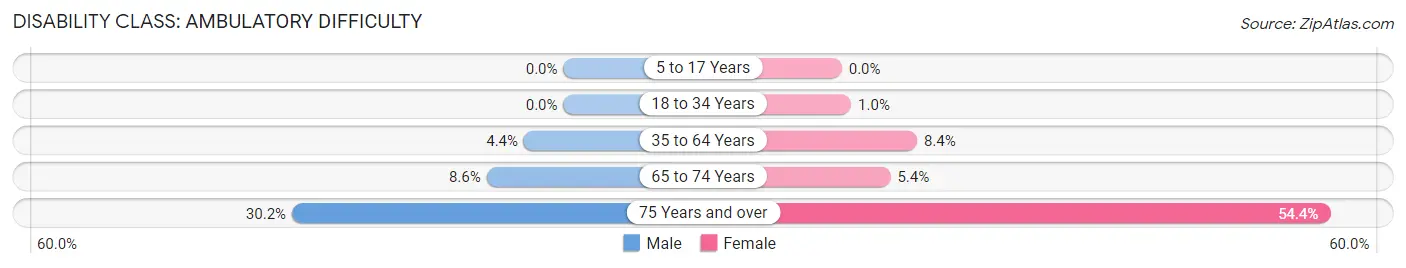
| Age Bracket | Male | Female |
| 5 to 17 Years | 0 (0.0%) | 0 (0.0%) |
| 18 to 34 Years | 0 (0.0%) | 9 (1.0%) |
| 35 to 64 Years | 69 (4.4%) | 136 (8.4%) |
| 65 to 74 Years | 40 (8.6%) | 22 (5.4%) |
| 75 Years and over | 52 (30.2%) | 161 (54.4%) |
Disability Class: Self-Care Difficulty
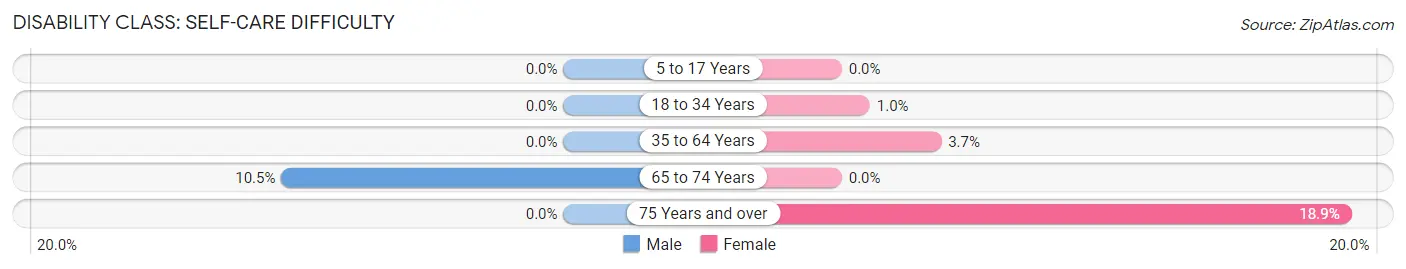
| Age Bracket | Male | Female |
| 5 to 17 Years | 0 (0.0%) | 0 (0.0%) |
| 18 to 34 Years | 0 (0.0%) | 9 (1.0%) |
| 35 to 64 Years | 0 (0.0%) | 60 (3.7%) |
| 65 to 74 Years | 49 (10.5%) | 0 (0.0%) |
| 75 Years and over | 0 (0.0%) | 56 (18.9%) |
Technology Access in Delavan
Computing Device Access in Delavan
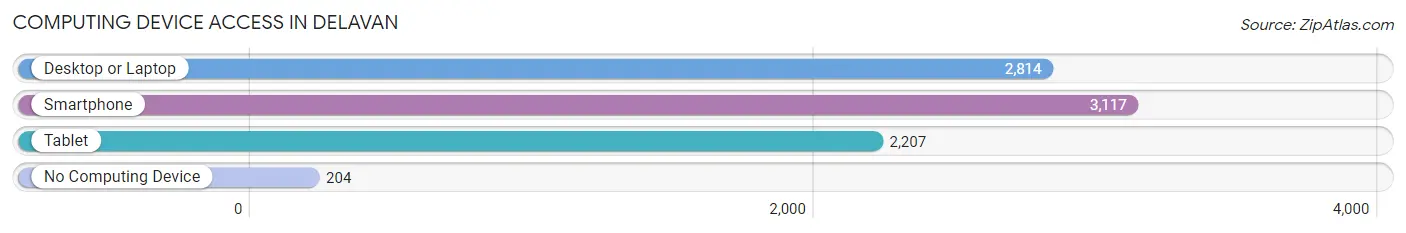
| Device Type | # Households | % Households |
| Desktop or Laptop | 2,814 | 79.5% |
| Smartphone | 3,117 | 88.1% |
| Tablet | 2,207 | 62.4% |
| No Computing Device | 204 | 5.8% |
| Total | 3,539 | 100.0% |
Internet Access in Delavan
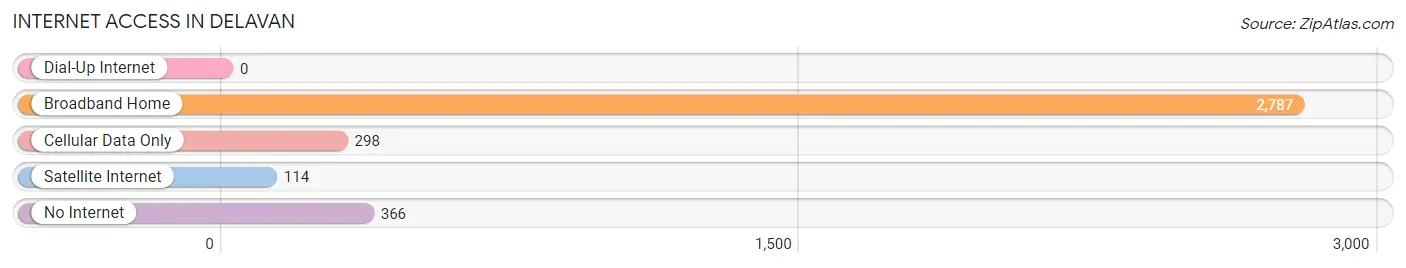
| Internet Type | # Households | % Households |
| Dial-Up Internet | 0 | 0.0% |
| Broadband Home | 2,787 | 78.7% |
| Cellular Data Only | 298 | 8.4% |
| Satellite Internet | 114 | 3.2% |
| No Internet | 366 | 10.3% |
| Total | 3,539 | 100.0% |
Delavan Summary
Delavan, Wisconsin is a city located in Walworth County, Wisconsin, United States. The population was 8,463 at the 2010 census. The city is located on the eastern shore of Lake Delavan, a natural lake formed by a terminal moraine. It is the largest city in Walworth County.
History
Delavan was founded in 1836 by settlers from New York and New England. The city was named after a Native American chief, Chief Delavan, who was a leader of the Potawatomi tribe. The city was incorporated in 1872.
In the late 19th century, Delavan was a popular resort destination for wealthy Chicagoans. The city was home to several grand hotels, including the Delavan Hotel, which was built in 1872 and was one of the largest hotels in the Midwest. The hotel was destroyed by fire in 1891.
In the early 20th century, Delavan was a popular destination for circus performers. The city was home to several circuses, including the Ringling Brothers Circus, which was based in Delavan from 1884 to 1918.
Geography
Delavan is located at 42°37′N 88°37′W (42.619, -88.619). According to the United States Census Bureau, the city has a total area of 5.2 square miles (13.4 km2), of which, 4.9 square miles (12.7 km2) is land and 0.3 square miles (0.7 km2) is water.
Economy
Delavan’s economy is largely based on tourism and manufacturing. The city is home to several manufacturing companies, including Delavan Industries, which produces industrial pumps and valves, and Delavan Manufacturing, which produces automotive parts.
The city is also home to several tourist attractions, including the Delavan Lake Resort, which offers a variety of recreational activities, including fishing, boating, and swimming. The city is also home to the Delavan Historical Society, which offers tours of the city’s historic sites.
Demographics
As of the census of 2010, there were 8,463 people, 3,521 households, and 2,092 families residing in the city. The population density was 1,717.2 people per square mile (662.3/km2). There were 3,845 housing units at an average density of 783.2 per square mile (302.7/km2). The racial makeup of the city was 87.2% White, 0.7% African American, 0.4% Native American, 0.7% Asian, 0.1% Pacific Islander, 8.7% from other races, and 2.2% from two or more races. Hispanic or Latino of any race were 16.2% of the population.
There were 3,521 households, out of which 28.2% had children under the age of 18 living with them, 43.2% were married couples living together, 12.7% had a female householder with no husband present, and 38.7% were non-families. 32.2% of all households were made up of individuals, and 13.2% had someone living alone who was 65 years of age or older. The average household size was 2.39 and the average family size was 3.02.
In the city, the population was spread out, with 24.2% under the age of 18, 8.3% from 18 to 24, 28.2% from 25 to 44, 22.3% from 45 to 64, and 16.9% who were 65 years of age or older. The median age was 38 years. For every 100 females, there were 93.2 males. For every 100 females age 18 and over, there were 89.7 males.
The median income for a household in the city was $37,917, and the median income for a family was $45,938. Males had a median income of $32,917 versus $25,000 for females. The per capita income for the city was $19,945. About 8.2% of families and 10.3% of the population were below the poverty line, including 14.2% of those under age 18 and 6.2% of those age 65 or over.
Common Questions
What is Per Capita Income in Delavan?
Per Capita income in Delavan is $31,716.
What is the Median Family Income in Delavan?
Median Family Income in Delavan is $80,036.
What is the Median Household income in Delavan?
Median Household Income in Delavan is $69,238.
What is Income or Wage Gap in Delavan?
Income or Wage Gap in Delavan is 39.1%.
Women in Delavan earn 60.9 cents for every dollar earned by a man.
What is Inequality or Gini Index in Delavan?
Inequality or Gini Index in Delavan is 0.40.
What is the Total Population of Delavan?
Total Population of Delavan is 8,519.
What is the Total Male Population of Delavan?
Total Male Population of Delavan is 4,379.
What is the Total Female Population of Delavan?
Total Female Population of Delavan is 4,140.
What is the Ratio of Males per 100 Females in Delavan?
There are 105.77 Males per 100 Females in Delavan.
What is the Ratio of Females per 100 Males in Delavan?
There are 94.54 Females per 100 Males in Delavan.
What is the Median Population Age in Delavan?
Median Population Age in Delavan is 37.0 Years.
What is the Average Family Size in Delavan
Average Family Size in Delavan is 2.9 People.
What is the Average Household Size in Delavan
Average Household Size in Delavan is 2.4 People.
How Large is the Labor Force in Delavan?
There are 4,651 People in the Labor Forcein in Delavan.
What is the Percentage of People in the Labor Force in Delavan?
68.9% of People are in the Labor Force in Delavan.
What is the Unemployment Rate in Delavan?
Unemployment Rate in Delavan is 4.3%.